Finance KPI Dashboard Excel Template
Excel spreadsheet for finance KPIs. Most common metrics for finance & accounting departments. Printable dashboard with trend charts. Ready for use.
TEMPLATE DESCRIPTION
Specifically, a Finance KPI Dashboard Excel Template involves Financial Key Performance Metrics that help determine the condition and sustainability of your current financial model. So, let’s take KPI review as a health checkup for your business. To emphasize, if you regularly review your KPIs, then you will be able to spot potential problems before they become serious and take action.
On the other hand, with a financial dashboard in Excel, you will be able to see the strong parts of your business which gives you insight into the right moves.
Generally, all KPIs and also OKRs (Objectives and Key Results) serve to keep a business fine-tuned for financial success. So, for the Finance department, we can say that it becomes even more crucial to track Key Performance Indicators on a regular basis and to assess your business’s financial health.

What are the benefits of using a Finance KPI Dashboard?
- Firstly, it allows users to track financial data in an easy-to-use and visual format. This allows users to quickly and easily monitor the performance of various financial metrics.
- Secondly, the dashboard allows users to gain a holistic view of the overall financial health of the business. By being able to look at key performance indicators all at once, it enables users to make more informed decisions.
- Thirdly, the dashboard is also easily customizable to accommodate the user’s individual preferences.
- Lastly, users can quickly and easily collaborate on the dashboard with other stakeholders and have access to up-to-date and relevant data.
How To Create The Most Effective KPI Dashboard For Finance Department?
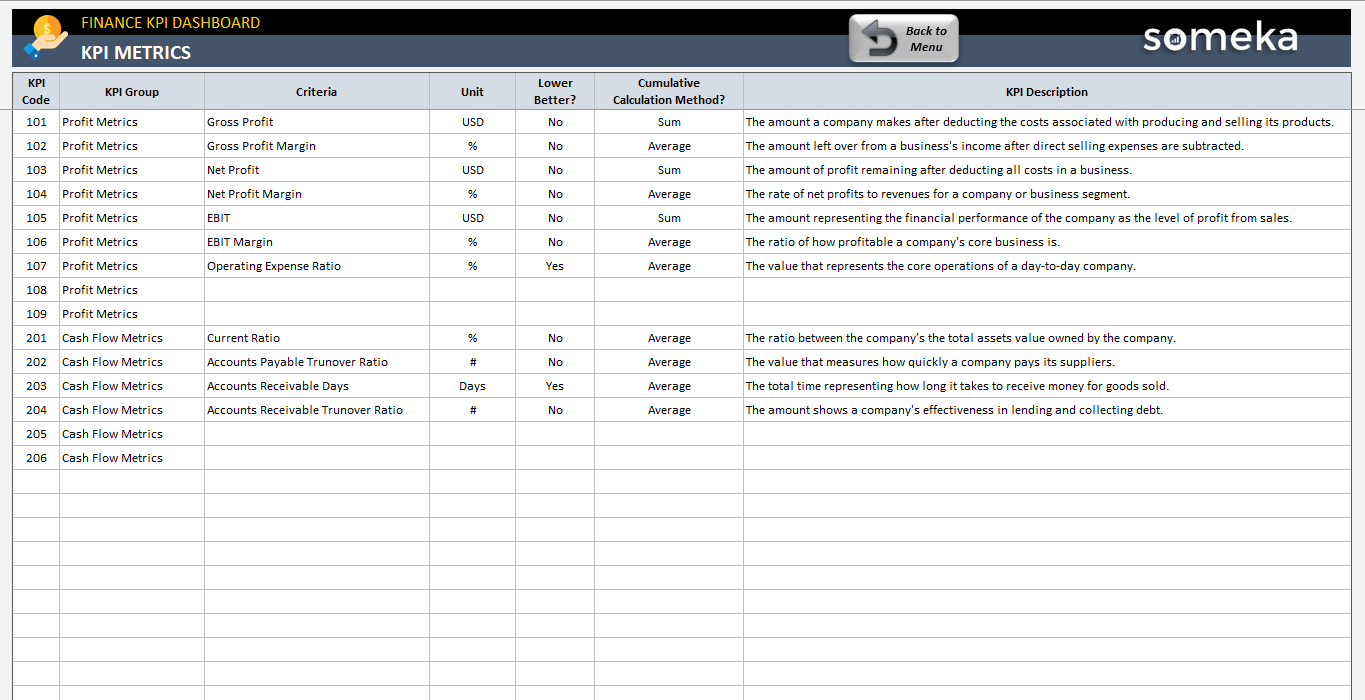
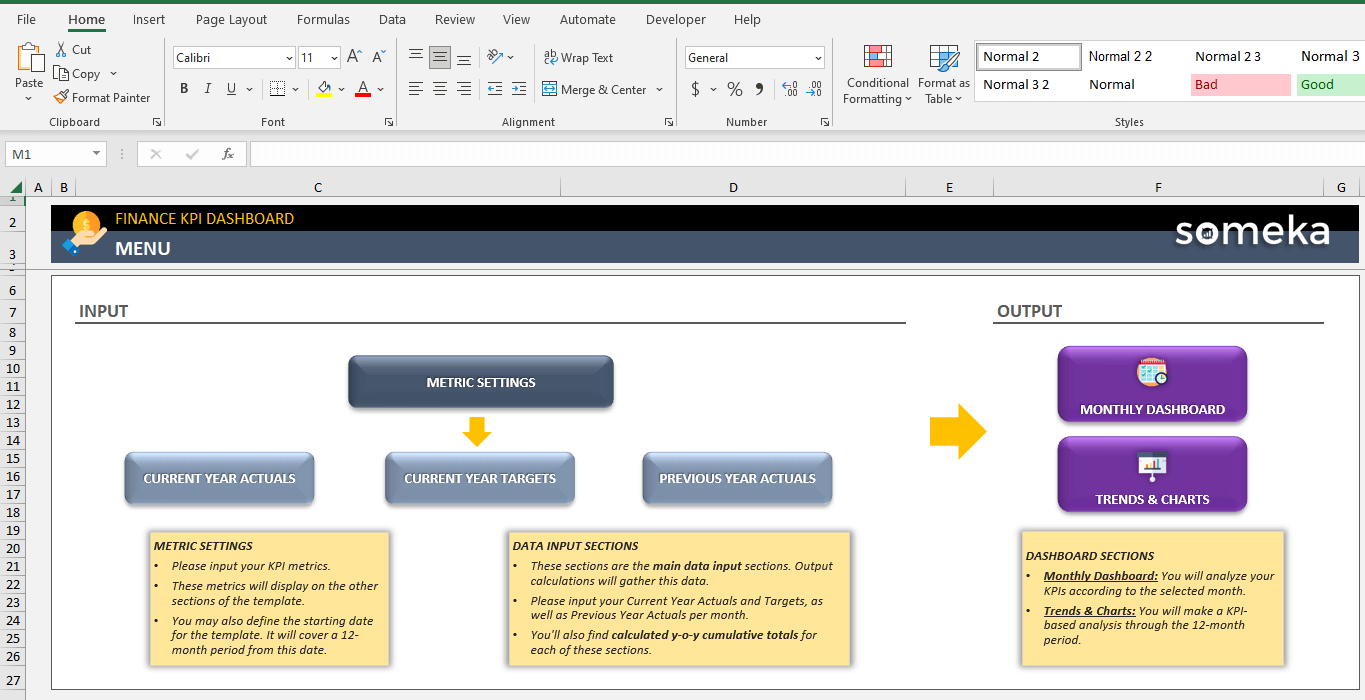
While creating a Finance KPI Dashboard the most important thing is to pick up the right performance metrics. Thus, we’re offering you a Ready-to-Use Excel Template which consists of:
- Key Financial Performance Indicators
- Trend Charts
- Previous Year and Target Comparisons
- Monthly and Cumulative Analysis
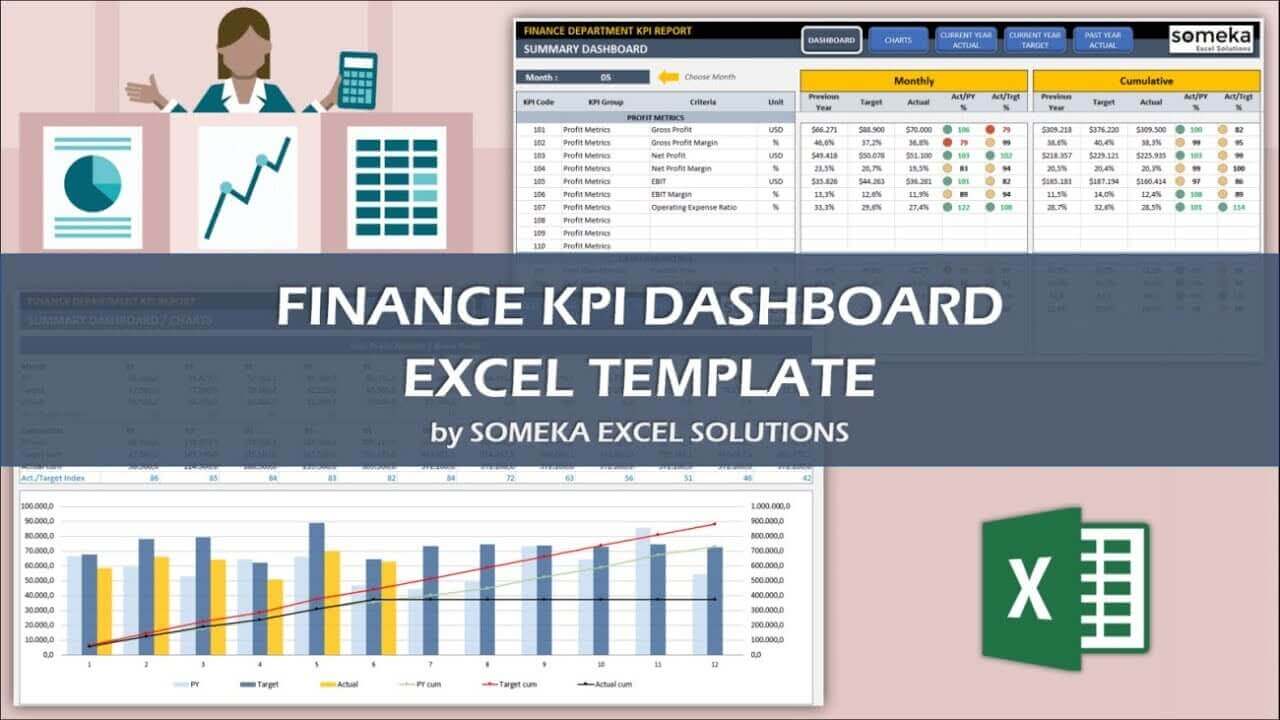
Finance KPI Dashboard Excel Template Features:
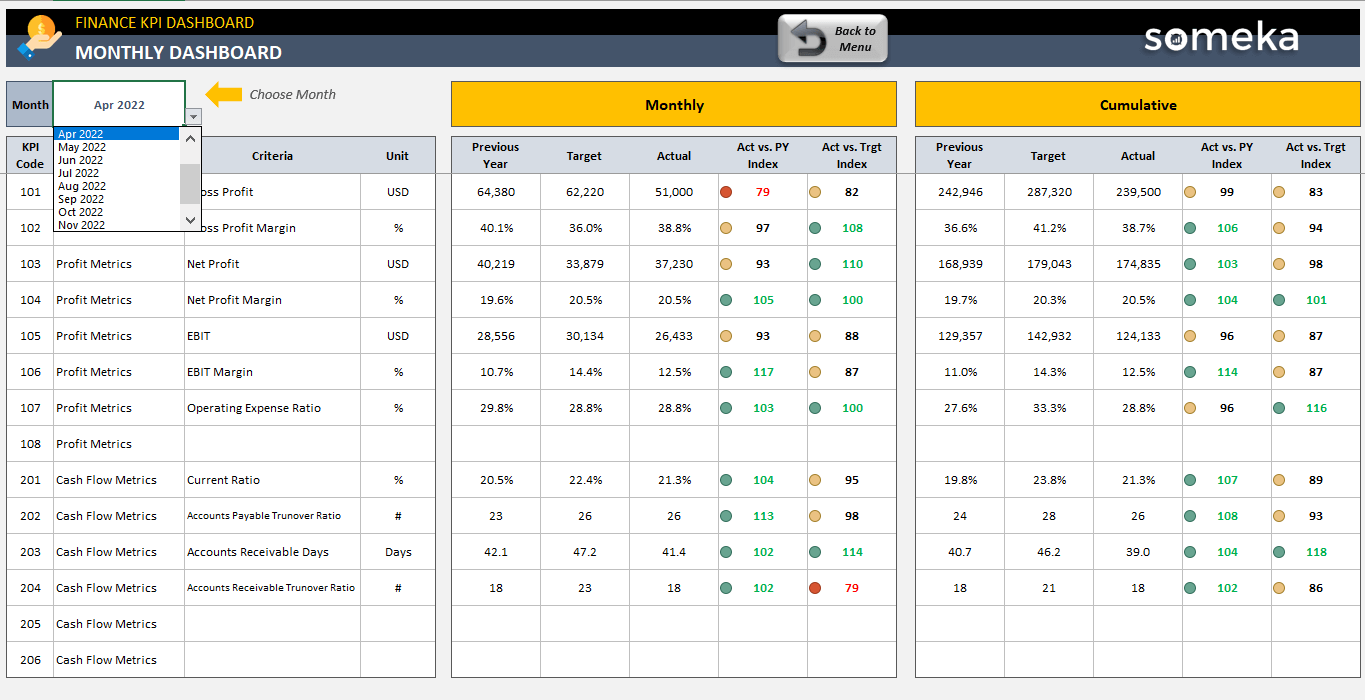
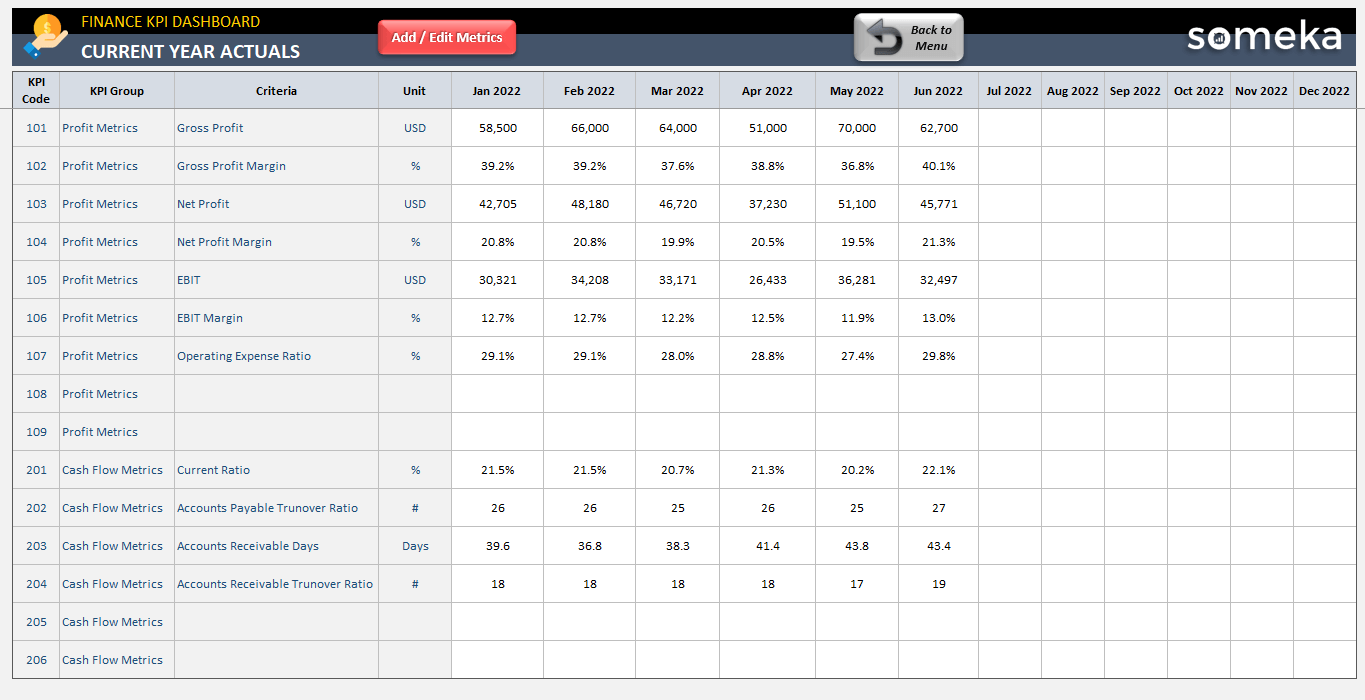
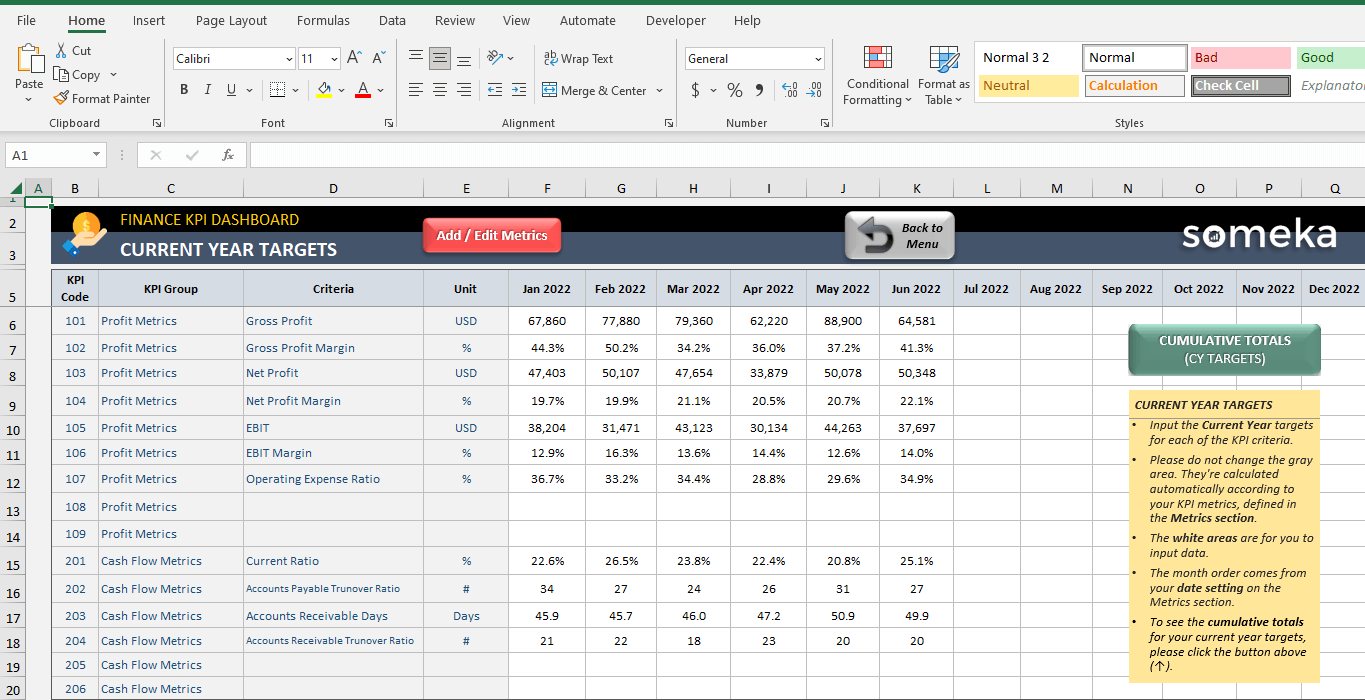
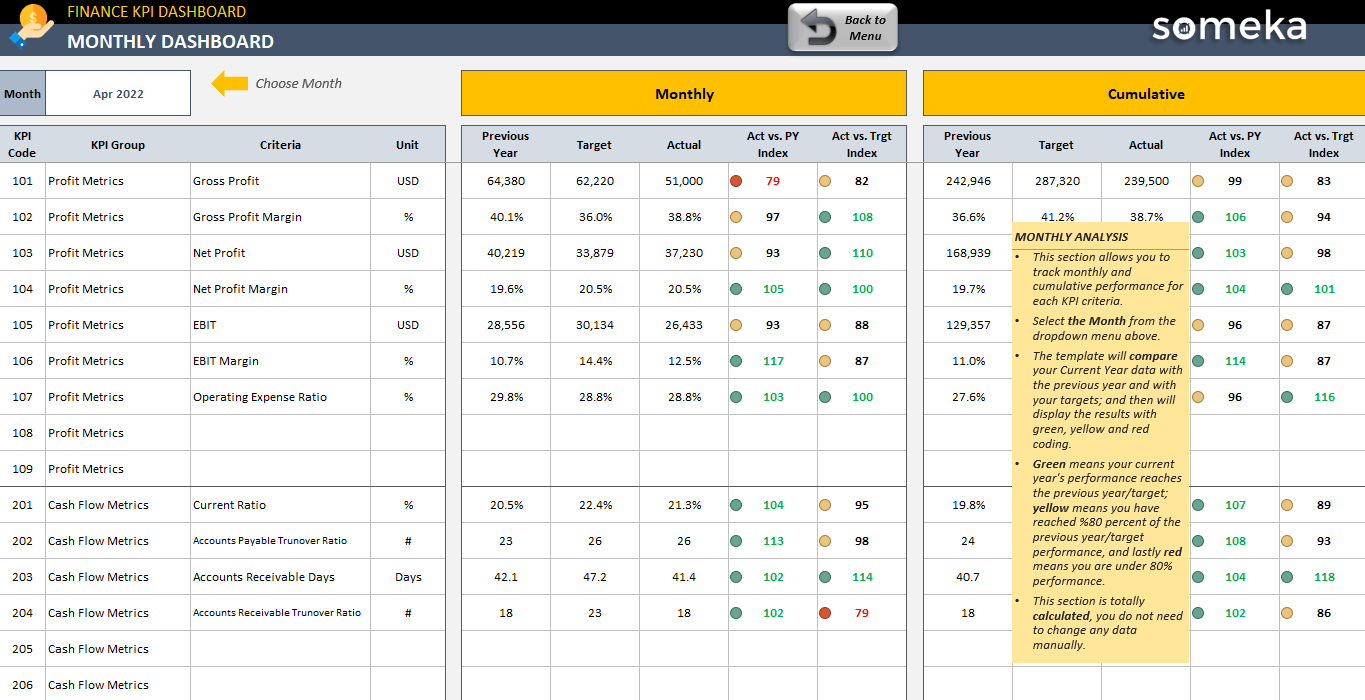
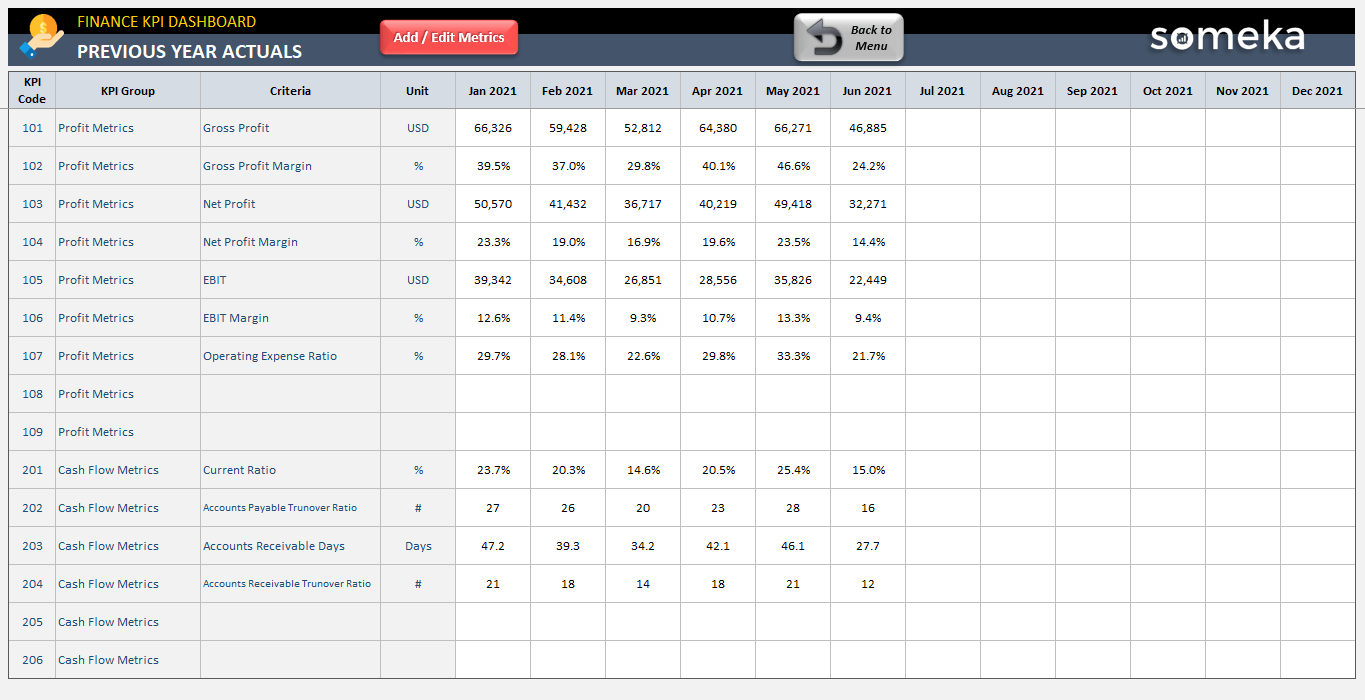
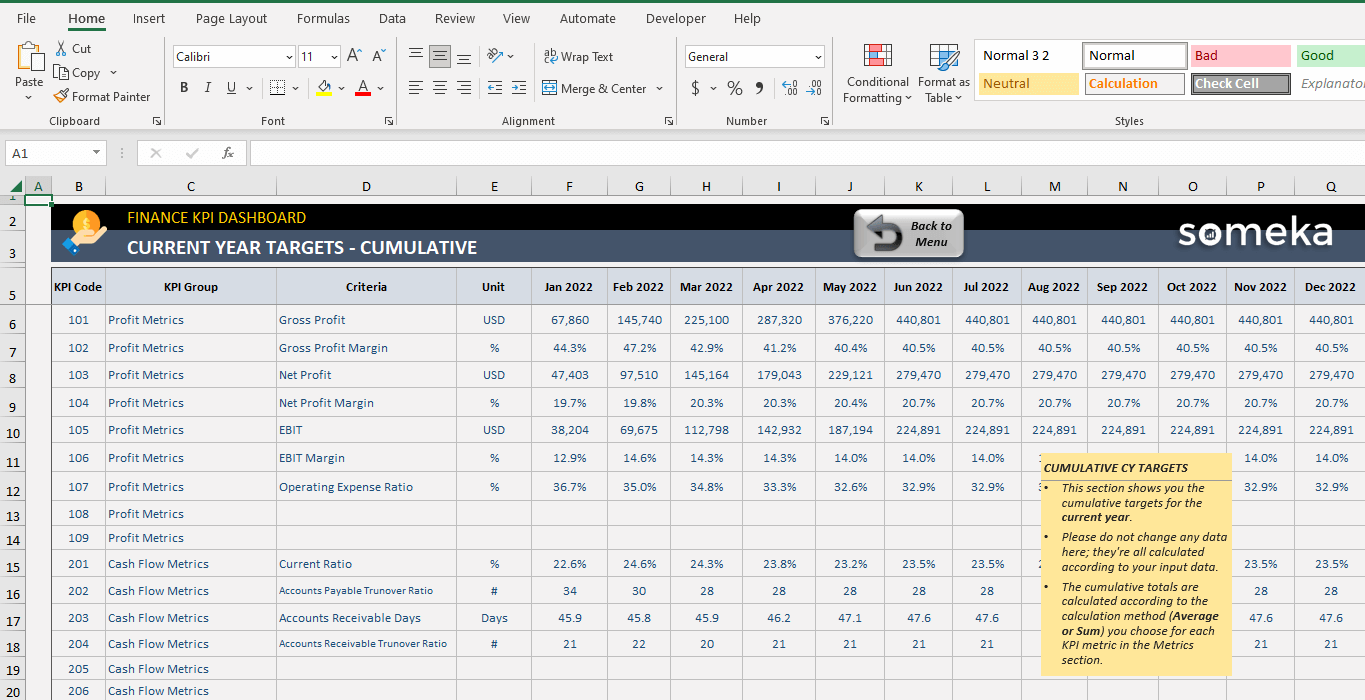
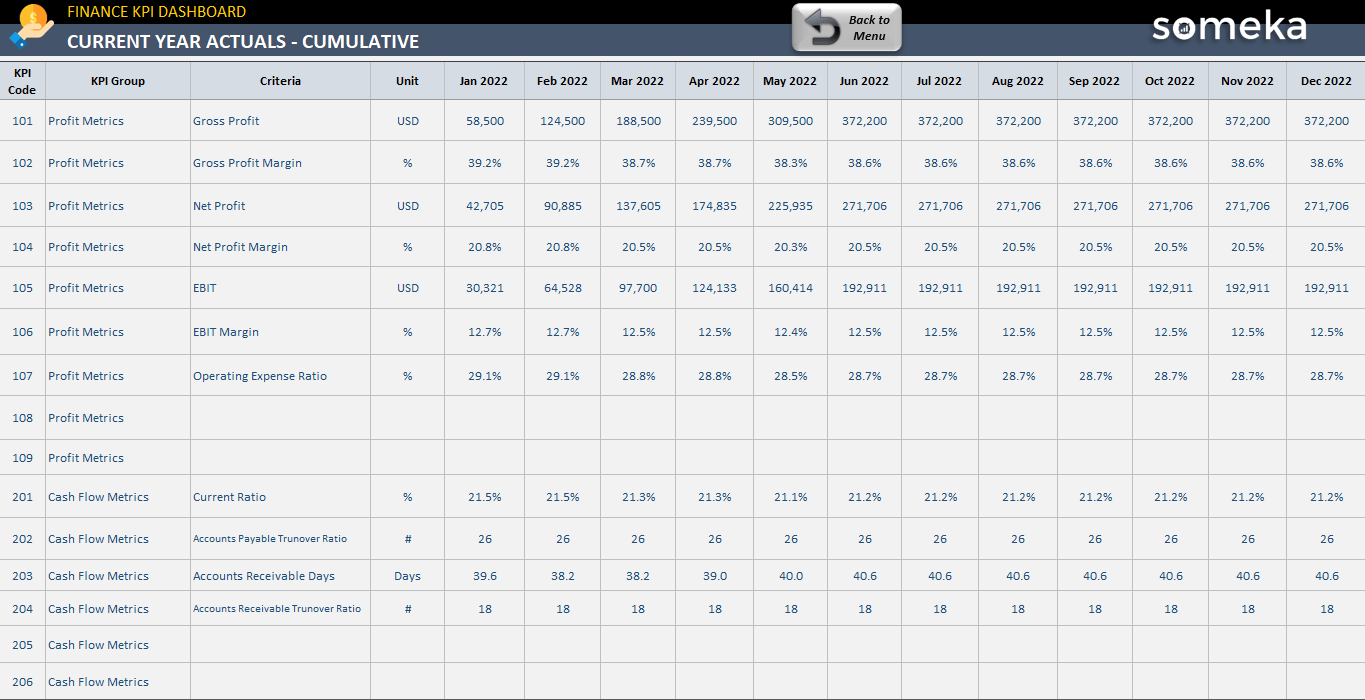
On the Dashboard, you will input the values Current Year Actual, Current Year Target, and Past Year Actual you would like to demonstrate. In this regards the navigation buttons are designed to make it easier to switch between other sections.
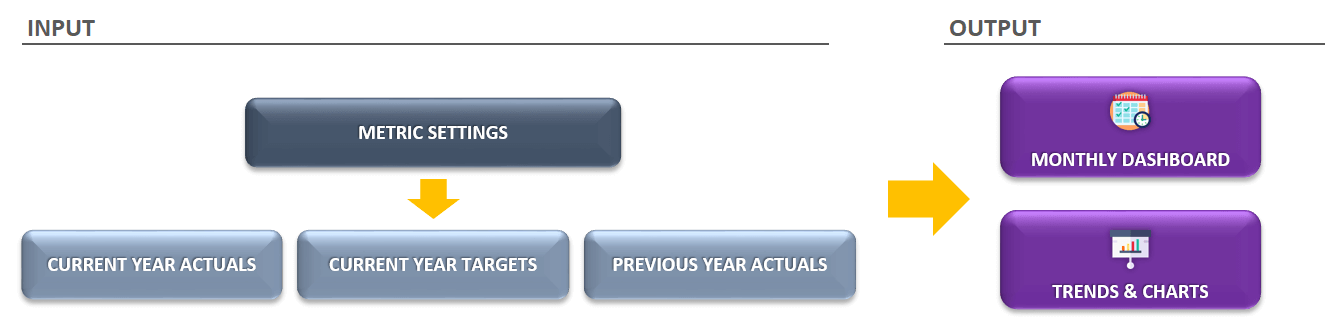
If you would like to add your own data or add a new row with a new KPI code, simply delete all dummy information we used for the sample.
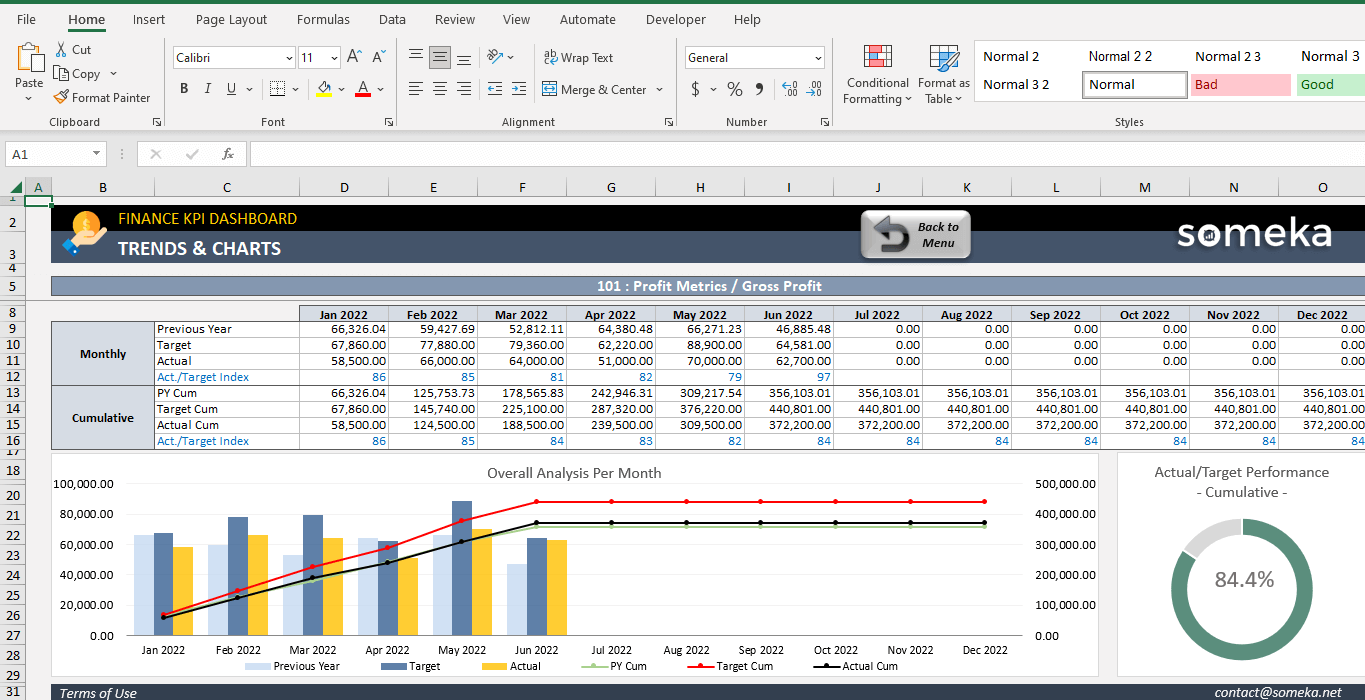
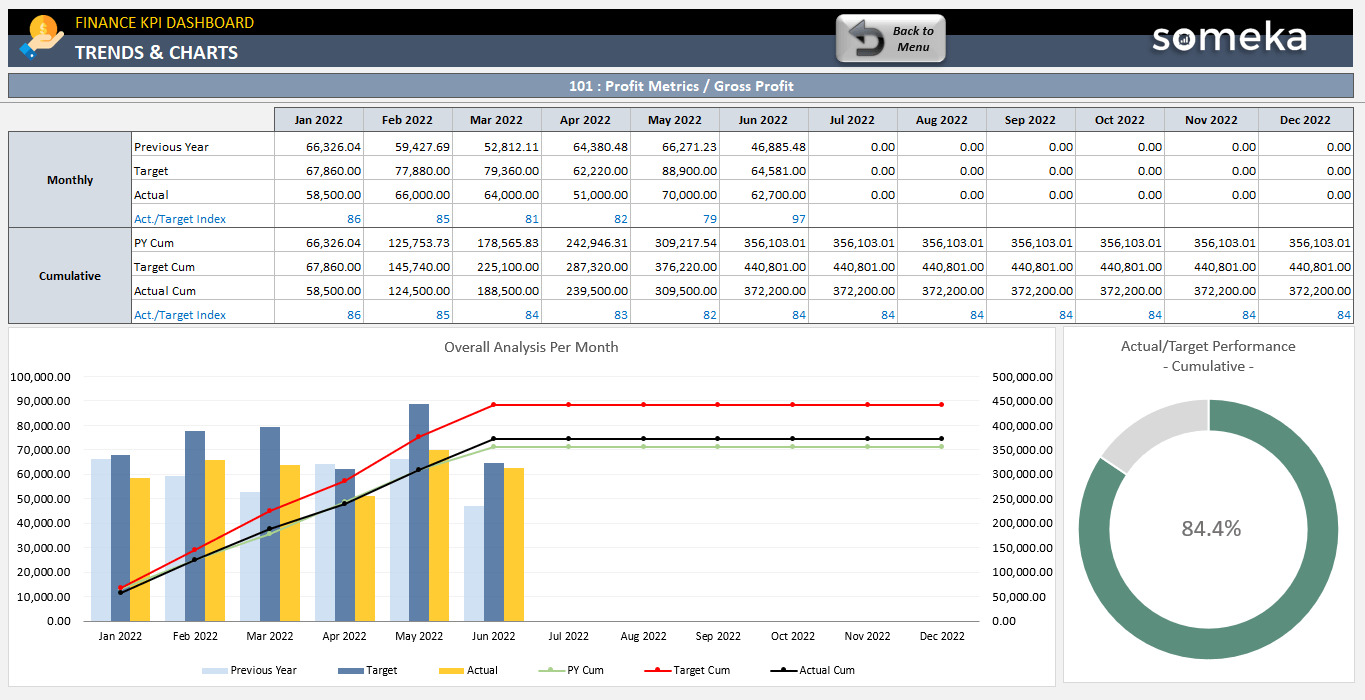
Trends forming with the charts will allow you to understand how your key metrics perform by giving visuals. You can select one of the KPIs you need to see.
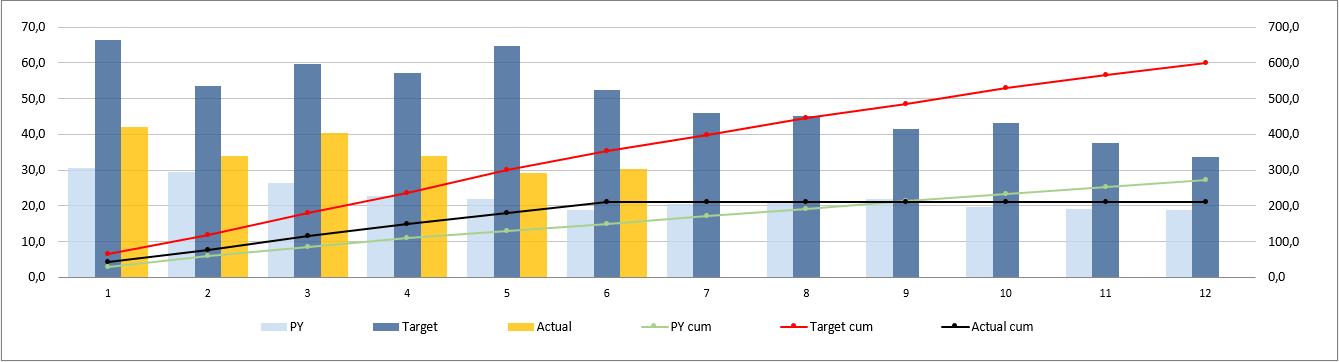
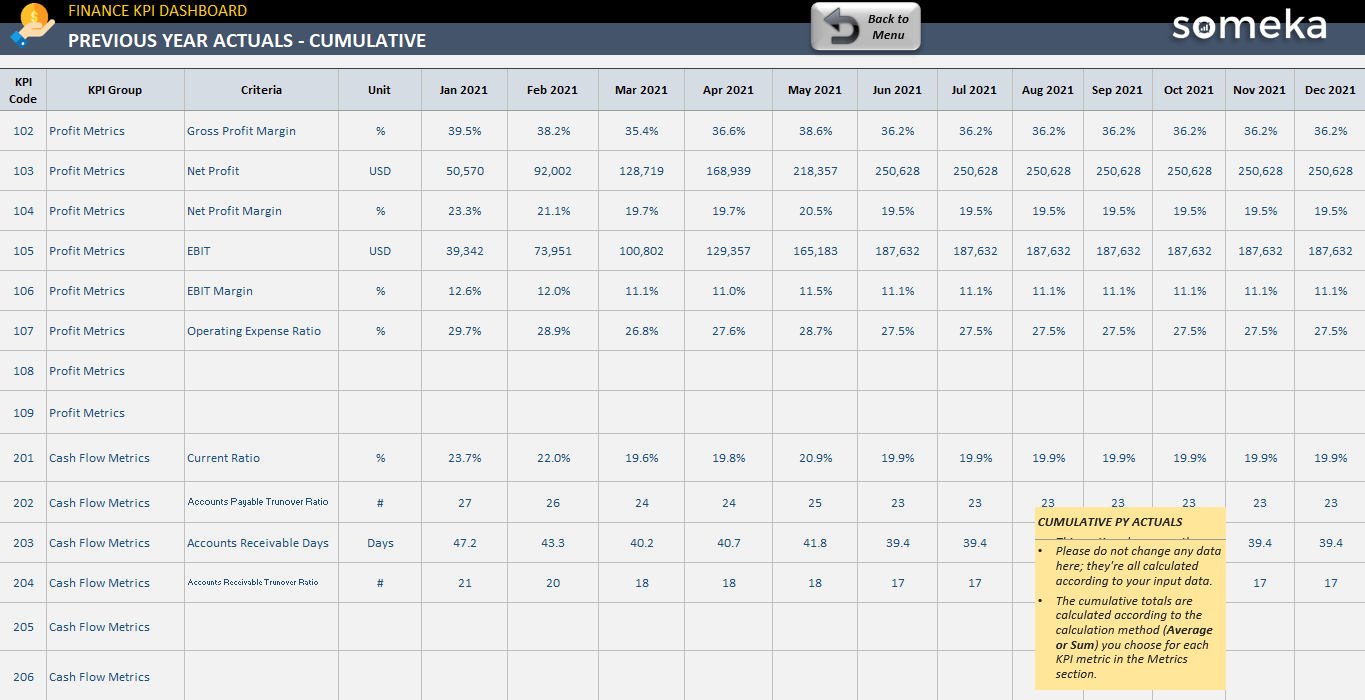
After you input all the figures into the Finance KPI Dashboard Template, the dashboard will present monthly and cumulatively results separately to provide a clear point of view for you. It will make it easier to interpret the past year and the company’s targets comparison
What Are The Right Financial KPIs?
In summary, we’ve collected the most commonly used KPIs in this Finance KPI Dashboard Excel Template:
- Gross Profit
- Gross Profit Margin
- Operating Expense Ratio
- Net Profit Margin
- EBIT and EBIT margin
- Accounts Payable Turnover Ratio
- Current Ratio
- Accounts Receivable Turnover
- Accounts Receivable Turnover Ratio
In addition to this, you can add more KPIs if you prefer. Afterward, you input relevant values and analyze the results in a nicely designed dashboard that is supported by charts. Moreover, it shows monthly and cumulative results separately. Moreover, you will be able to see the comparison with last year’s figures and company targets.
Finally, thanks to this Finance KPI Dashboard, you will easily follow your critical performance metrics, make comparisons and stay on track!
Finance KPI Dashboard Excel Template Features Summary:
- Both monthly and cumulative analysis
- Comparison with Past Year and Target values
- Summary financial dashboard in Excel as well as interactive charts
- Easy to use and nice design to be used in presentations
- Plus, clear on-sheet instructions
- Compatible with Excel 2010 and later versions
- Works both on Windows and Mac
- No installation is needed. So, ready to use
- Additionally, fully print ready
- White Label
- Does not include any VBA macros
EXCEL KPI DASHBOARDS COLLECTION
PRODUCT VIDEO
Watch the video below to see the template in action! Presentation also includes usage notes, explanations and tips & tricks about the template.
USER REVIEWS & COMMENTS
9 reviews for Finance KPI Dashboard Excel Template
You must be logged in to post a review.
RELATED TEMPLATES
-
 This product has multiple variants. The options may be chosen on the product page
Grocery Store Financial Model Excel Template
$99.95 – $199.95Easy-to-use financial model for grocery shops. Printable & clean financial statements. Dashboard with charts. No installation needed. All in Excel.
-
This product has multiple variants. The options may be chosen on the product page
Excel Balance Sheet Template
$29.95 – $59.95Balance Sheet Template in Excel spreadsheet. Automatic dashboard with charts and financial ratios. Easy-to-edit & ready-to-print. Export to PDF.
-
This product has multiple variants. The options may be chosen on the product page
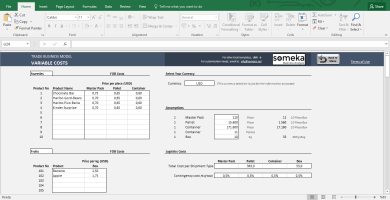
Feasibility Study Excel Template for Trade Startups
$39.95 – $79.95Financial plan Excel template for feasibility study of trade startups. Including sales projections, costs, financial calculations, charts, dashboard and many more.
-
This product has multiple variants. The options may be chosen on the product page
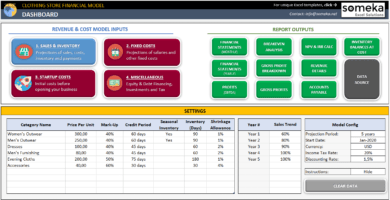
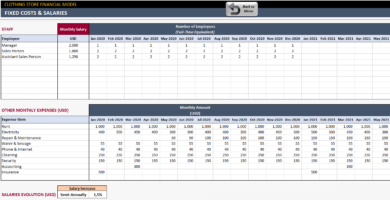
Clothing Store Financial Model Excel Template
$99.95 – $199.95Easy-to-use financial model for clothing business. Feasibility study, forecasts and budget. Printable financial statements. Ready for use. All in Excel.
-
This product has multiple variants. The options may be chosen on the product page
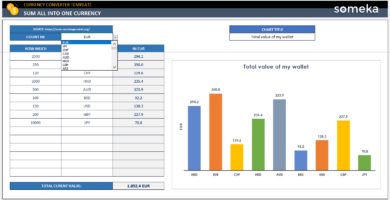
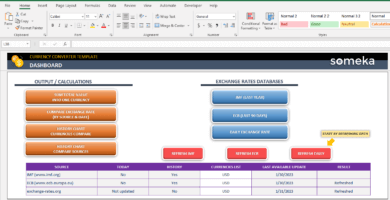
Currency Converter Excel Template
$9.95 – $19.95Exchange rates spreadsheet. Get historical currency rates. One-click conversions in world currencies with printable and dynamic charts. All in Excel.
-
This product has multiple variants. The options may be chosen on the product page
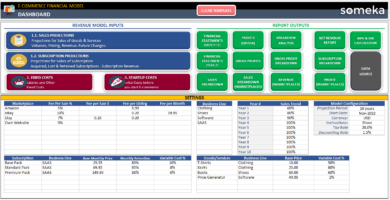
Ecommerce Financial Model Excel Template
$99.95 – $199.95All-in-one financial planning tool in Excel. Feasibility study & budget for SaaS startups. Ready to present financial projections. No installation needed.
Poorima –
I’m totally loving this excel tool
! It’s so simaple to use and has made it really easy for me to monitor my business’s finances.
Yasmine O –
It seems locked and I can’t add or delete any information.
Someka –
We apologize for any inconvenience this may have caused you. In order to use this template, please use the password file we initially sent to you in the zip file.
Frank Aldric –
Is it possible to add more Key Performance Indicators to the Finance KPI Dashboard Excel Template if I want to keep track of more metrics?
Someka –
Hey there! Thanks for your inquiry. Of course you can add more KPIs to this finance template – simply open the metric sheet and add any data you’d like to track. If you need a bit more assistance, don’t hesitate to reach out to us at contact@someka.net. We’d be happy to help.
Patrick A. –
I recently used the Finance KPI Dashboard Template and it was amazing. The template is easy to use and has a nice design. It made analyzing financial data so much easier.
Lizzie –
This template is absolutely awesome it is complete and perfect for managers. however i should have derailed the support service what should I do in this case?
Someka –
Hello Lizzie,
Thank you for your nice comment.
Someka customer service is always here to help. We will be happy to help you.
Whether you have questions about our excel templates, payments, or any issues, please feel free to contact us via the Contact Form or send an email to contact@someka.net.
Alternatively, you can try our live chat service on our website.
Generally, we will reply in 1 business day max.
Hugo –
Great product I recommend it. watch the video tutorial is very useful.
LarryTulse –
Hi! This is my first comment here so I just wanted to give a quick shout out and tell you I really enjoy reading your posts. Thank you so much!
FrankDelof –
Very nice article, totally what I needed.
Valeria Brown –
Well-structured but realized that the price unit is available in USD. can this be converted to CAD in the version I have right now?
Someka –
Thank you for your feedback Valeria! You can easily modify the currency. But for doing this you need to unlock sheet. Please refer this : How can I unlock the sheets? What is the password?