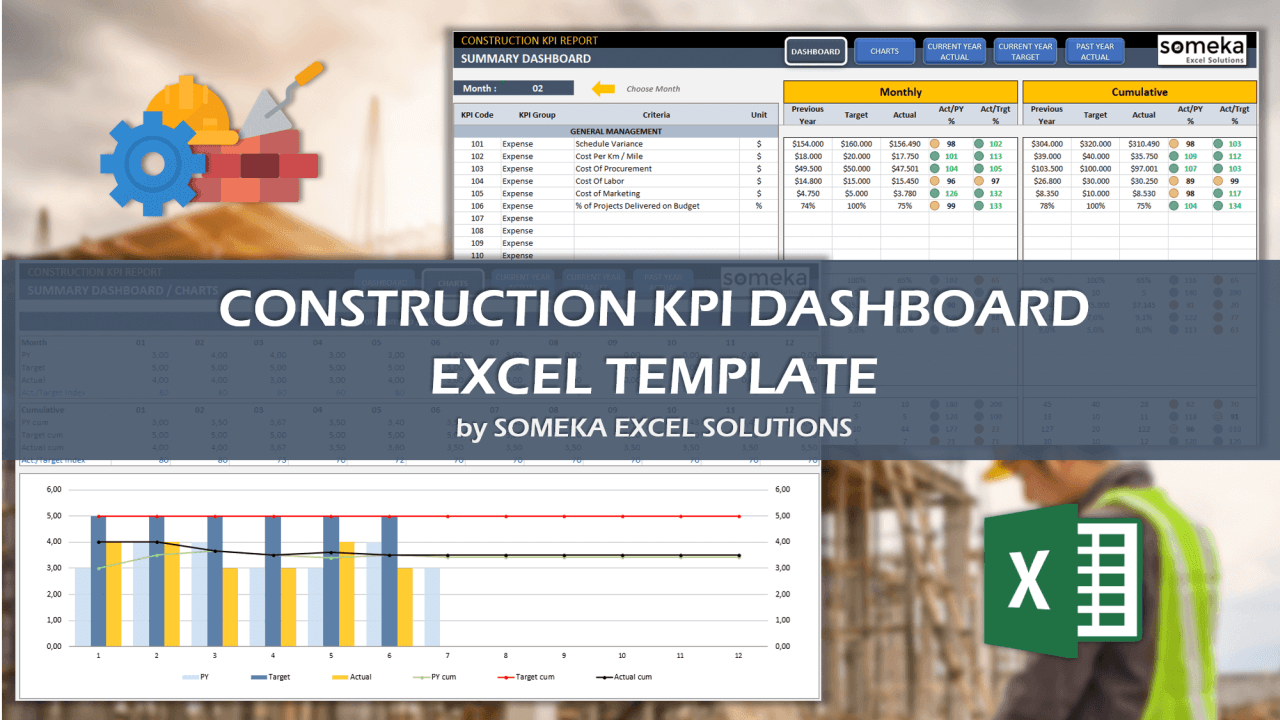
Construction KPI Dashboard Excel Template
Excel KPI spreadsheet for construction industry. Track your key metrics with monthly and cumulative trend analysis. Printable and ready-to-use template.
TEMPLATE DESCRIPTION
Construction is one of the most important areas which has to keep track of strengths and weaknesses. The instant access Construction KPI Dashboard Excel Template will improve your quality and manage the critical health and safety aspects of the building industry.
You should always track your KPI and also OKR (Objectives and Key Results) metrics for a sustainable business in construction industry. KPIs are used to maintain operational stability and monitor day-to-day activities, while OKRs are used to drive innovation, set challenging goals, and ensure alignment with strategic objectives.
To manage your business more professional, we’ve focused on the most used 23 KPIs in 5 main groups:

Now, let’s see the details of the Construction KPI Dashboard Excel Template.
Construction KPI Dashboard Excel Template Features:
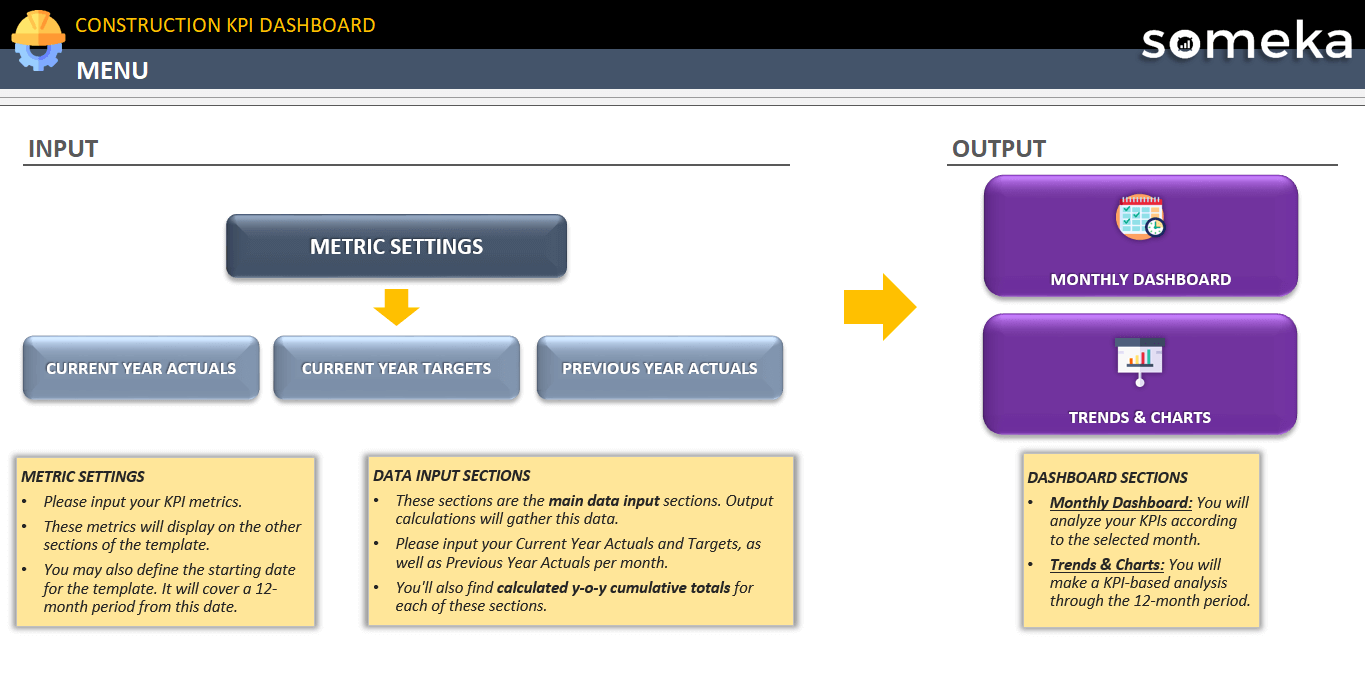
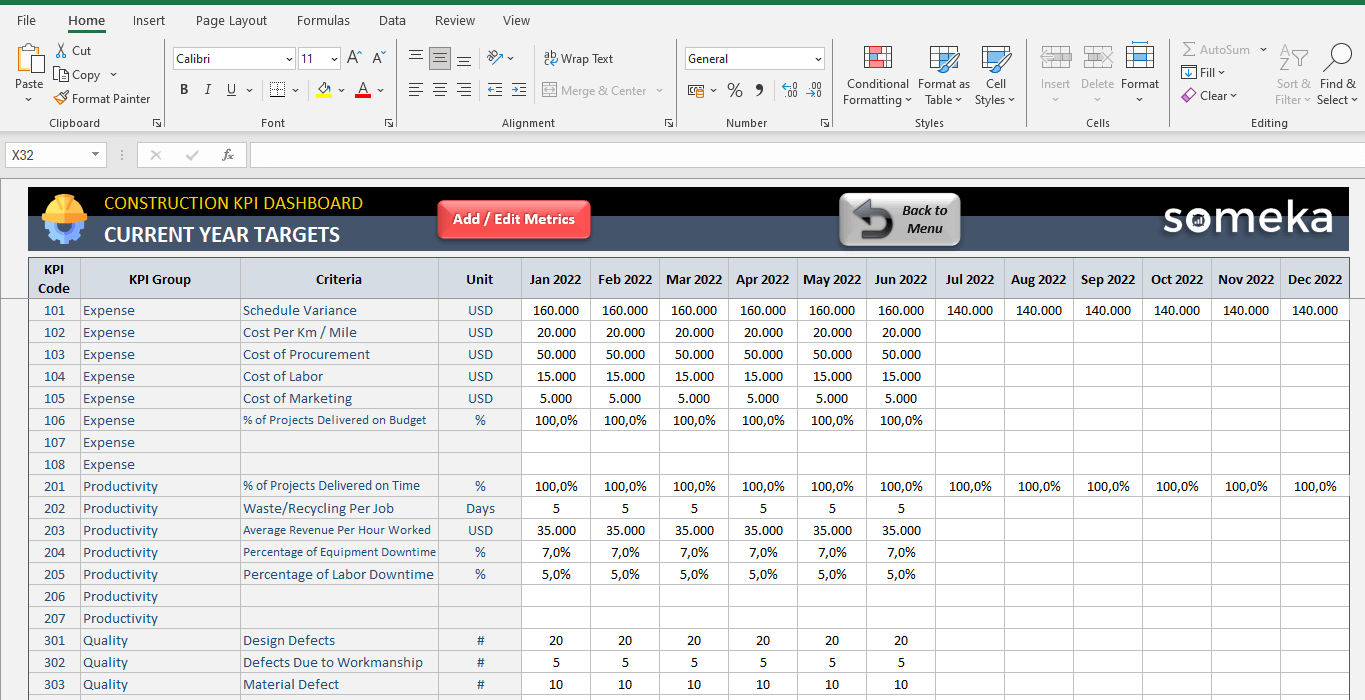
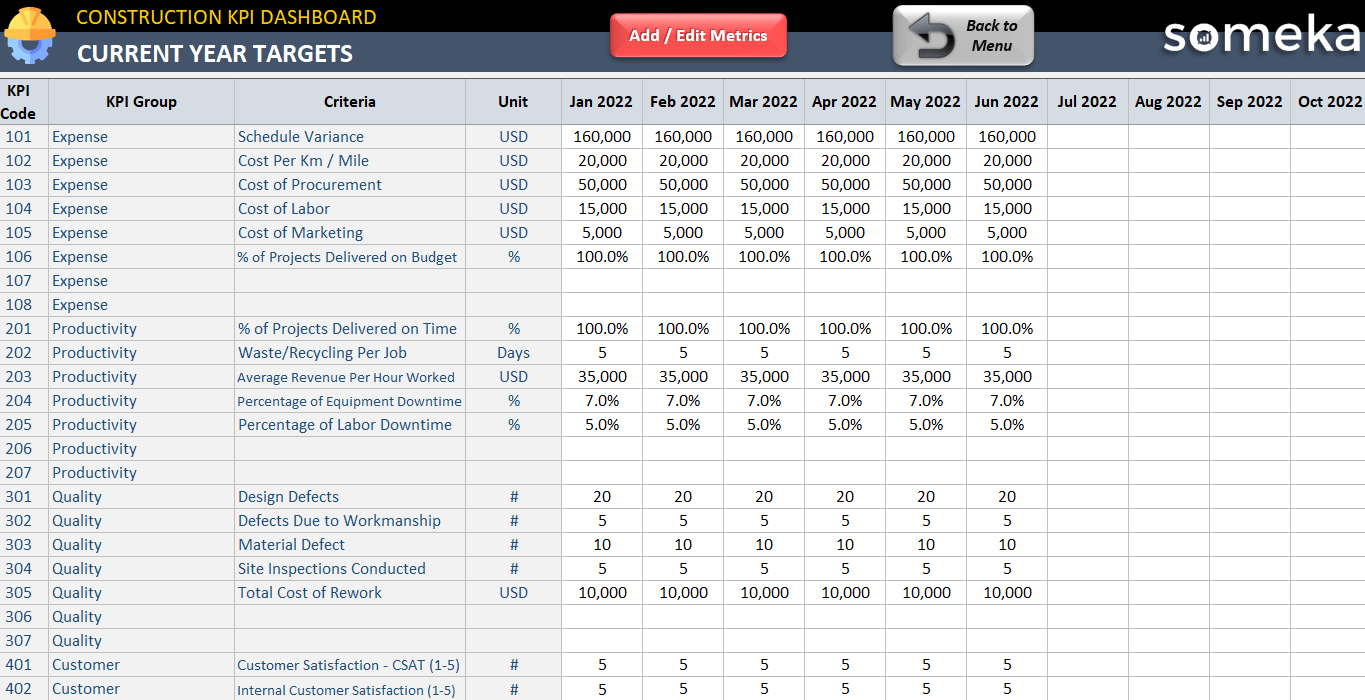
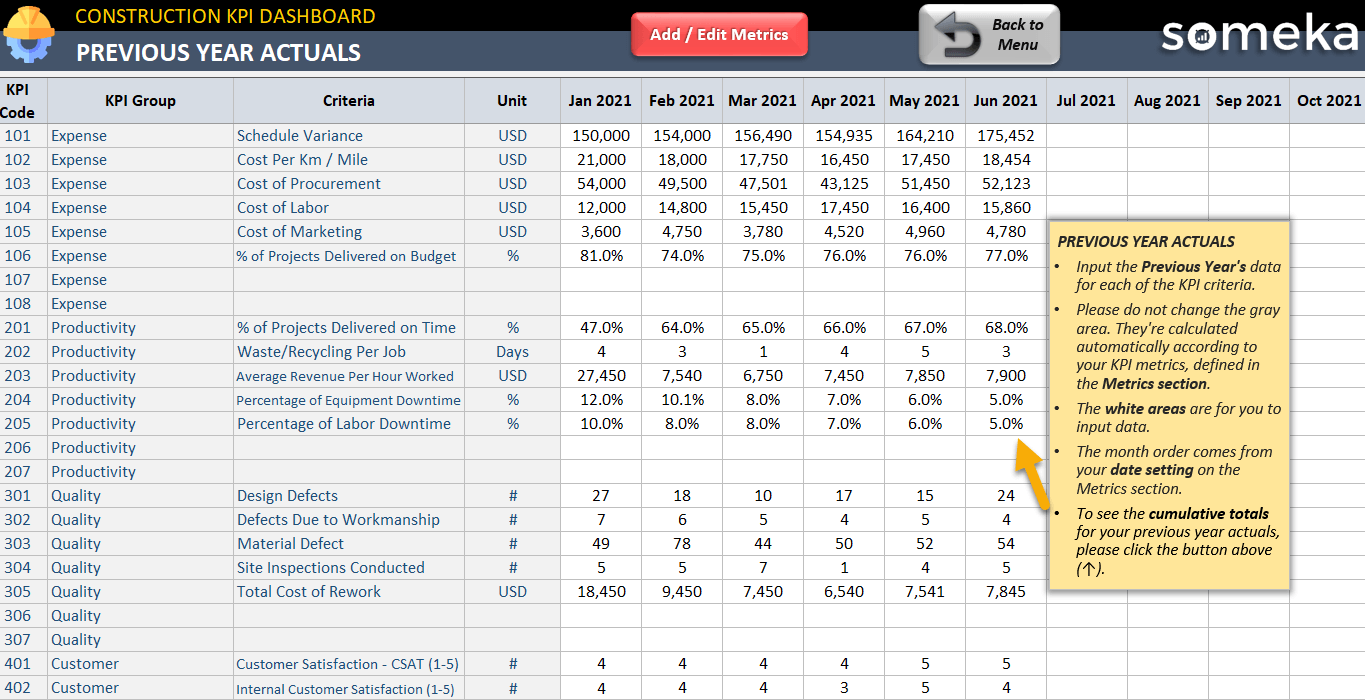
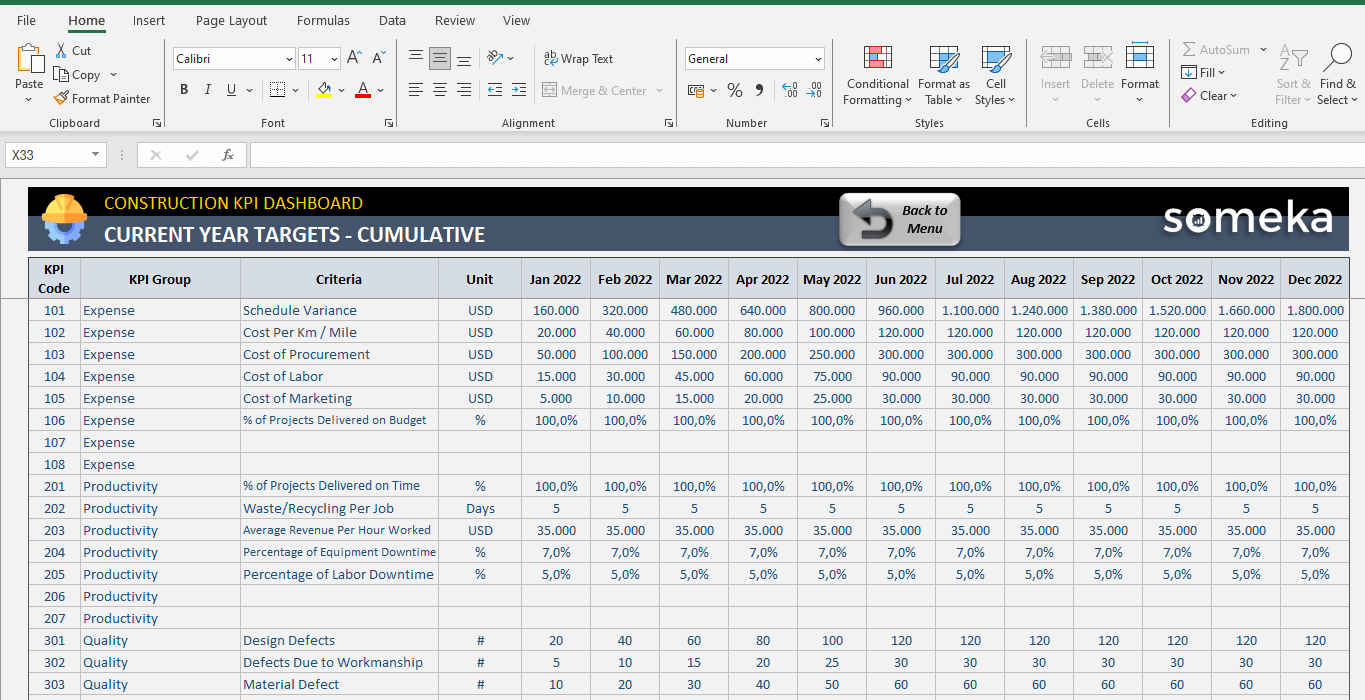
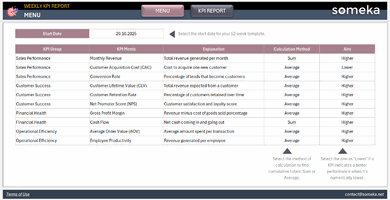
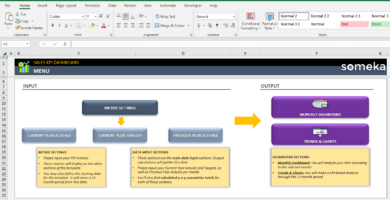
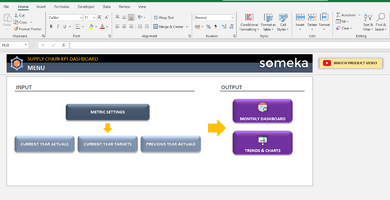
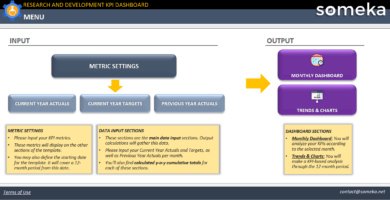
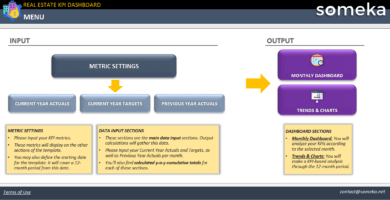
These navigation buttons are for switching between other sections. So here, the first section that which you are going to input your own values is Current Year Actual, Current Year Target, and Past Year Actual.
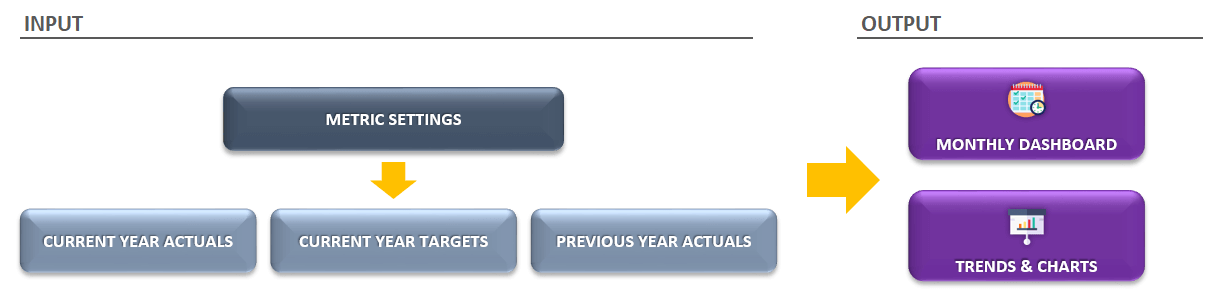
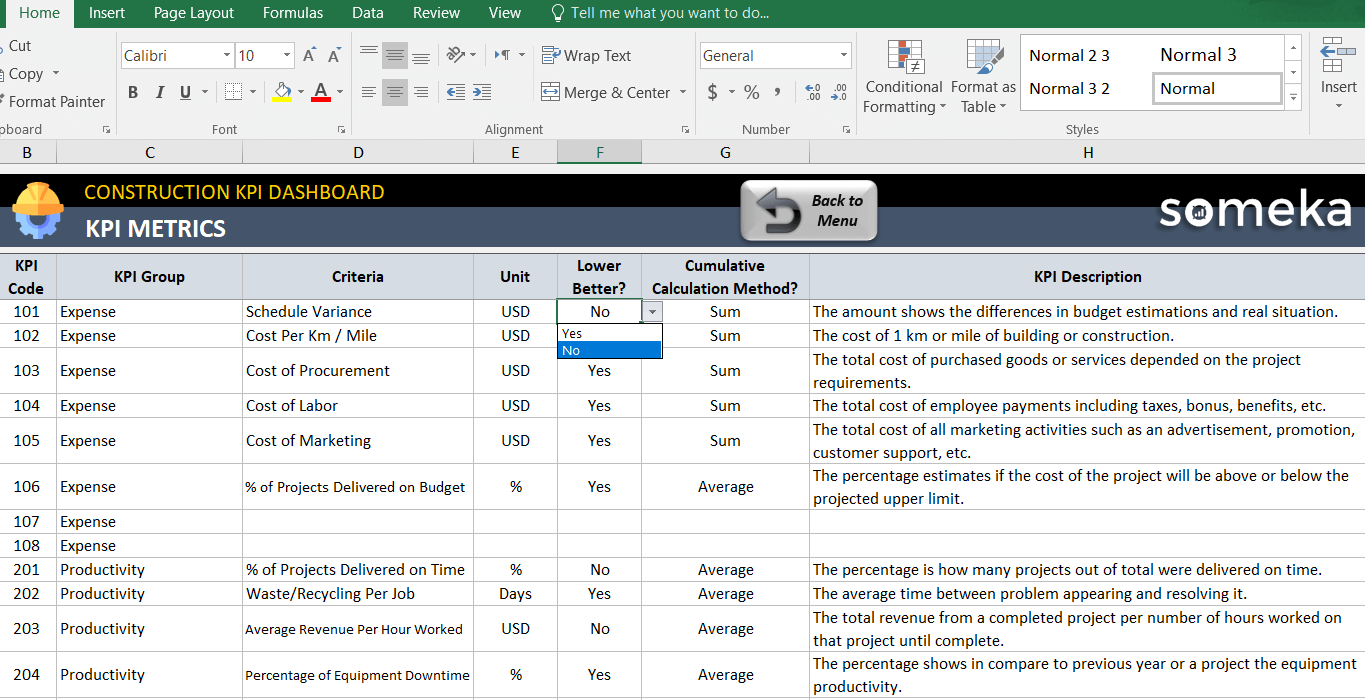
You will find some dummy data we used but you can also put your own data or add new rows with a new Construction KPI code.
Warning!: Please note that you should change other sections as well when you add/remove a KPI code. For example, with the new Construction KPI in CY Actual section, you should also add it in CY Target, PY Actual, and Cumulative.
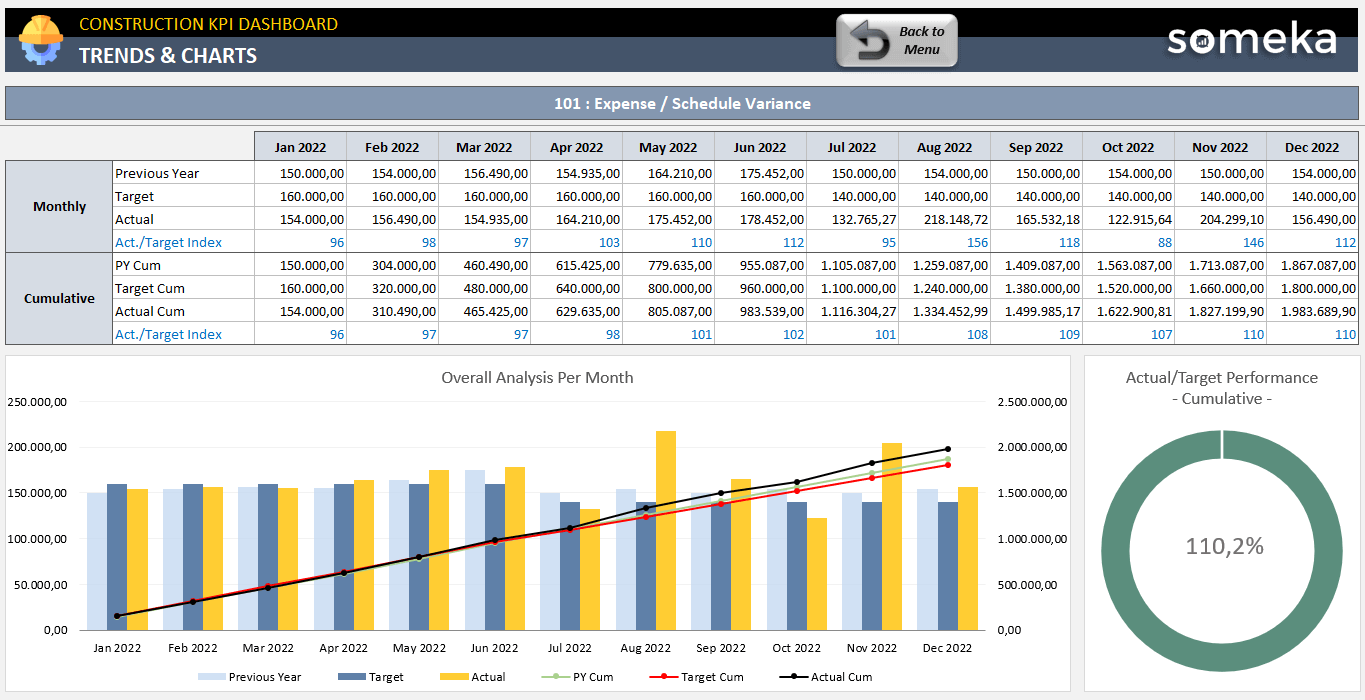
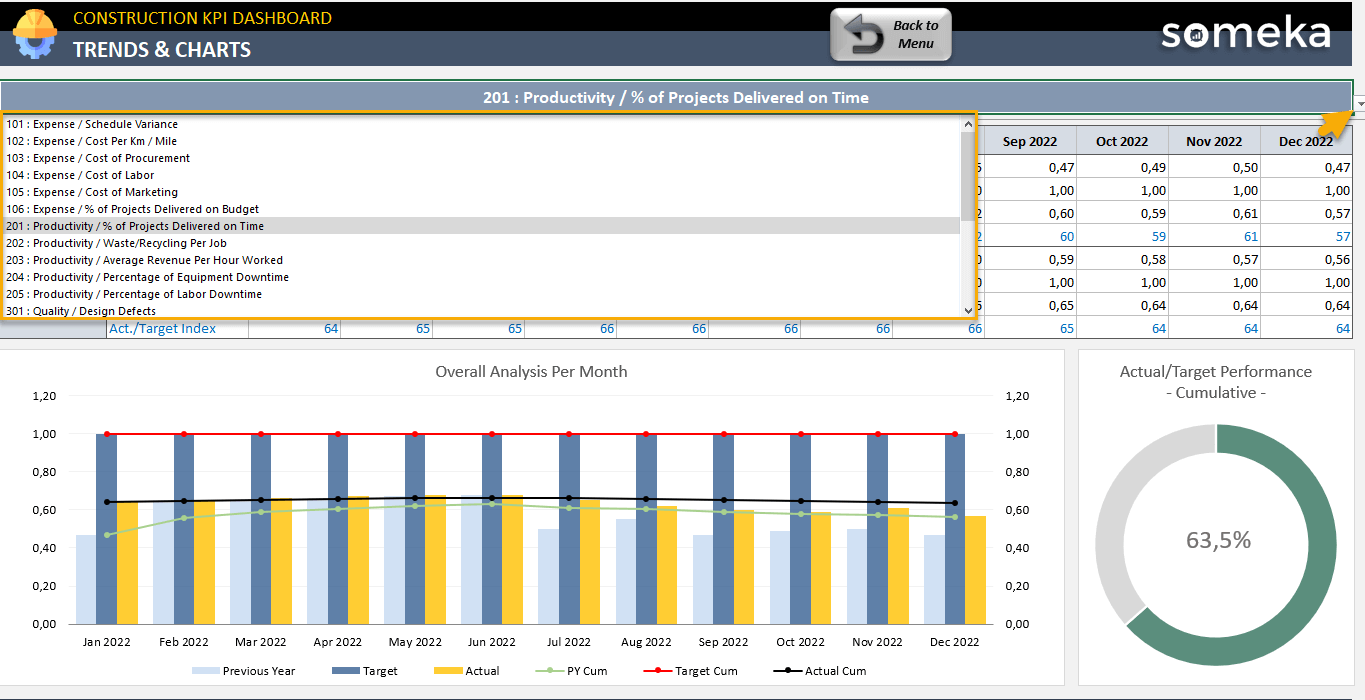
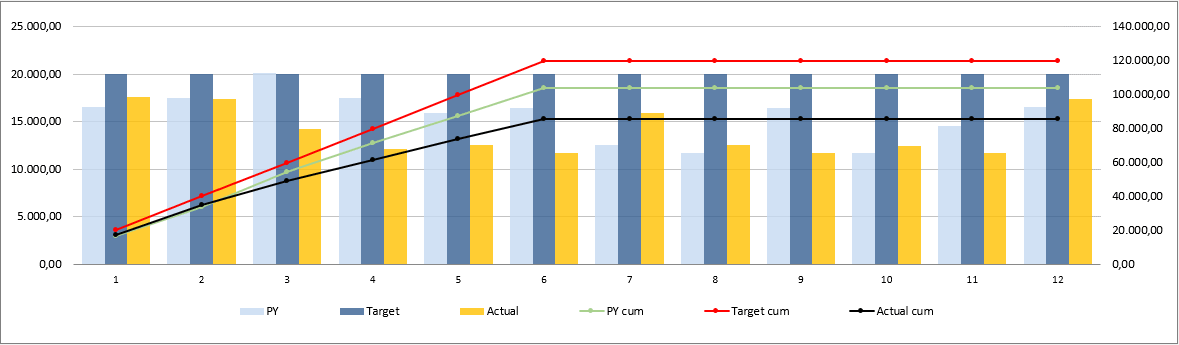
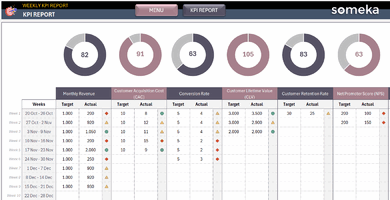
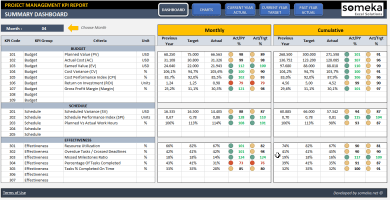
On the other hand, trends charts will allow you to understand how your key Construction metrics perform. So, you can select one of the KPIs you would like to analyze.
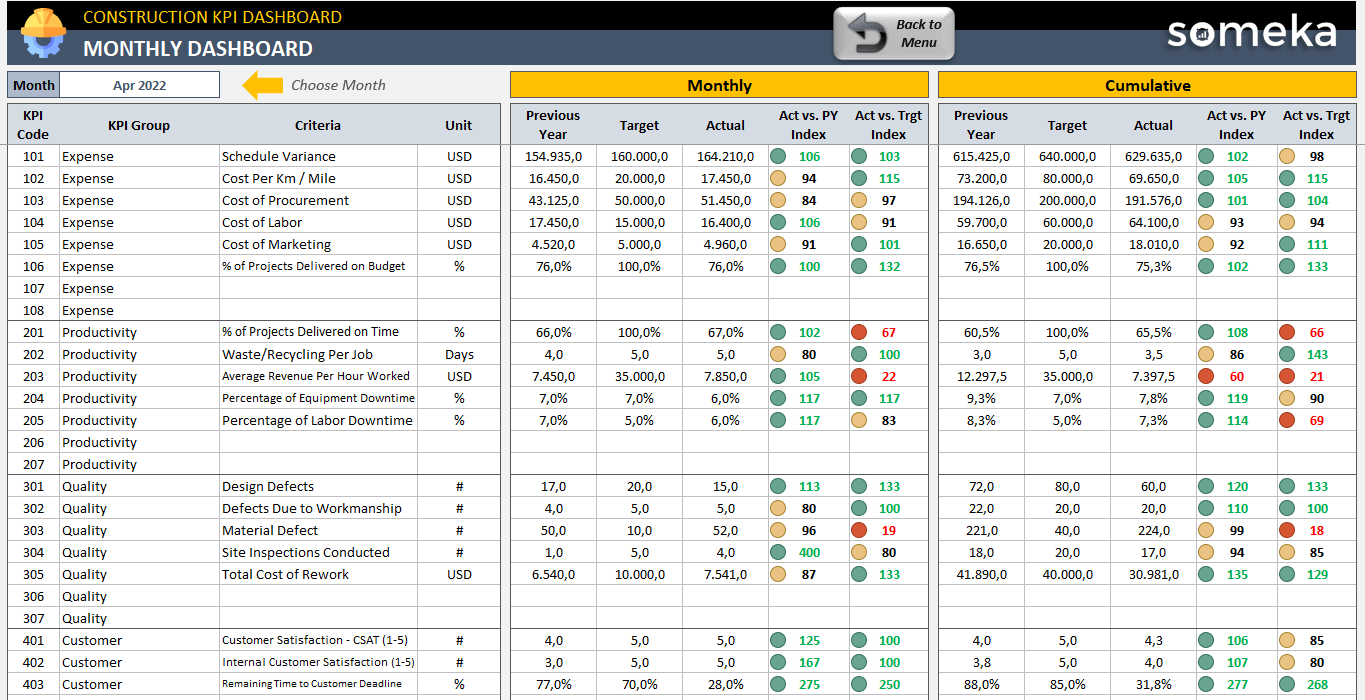
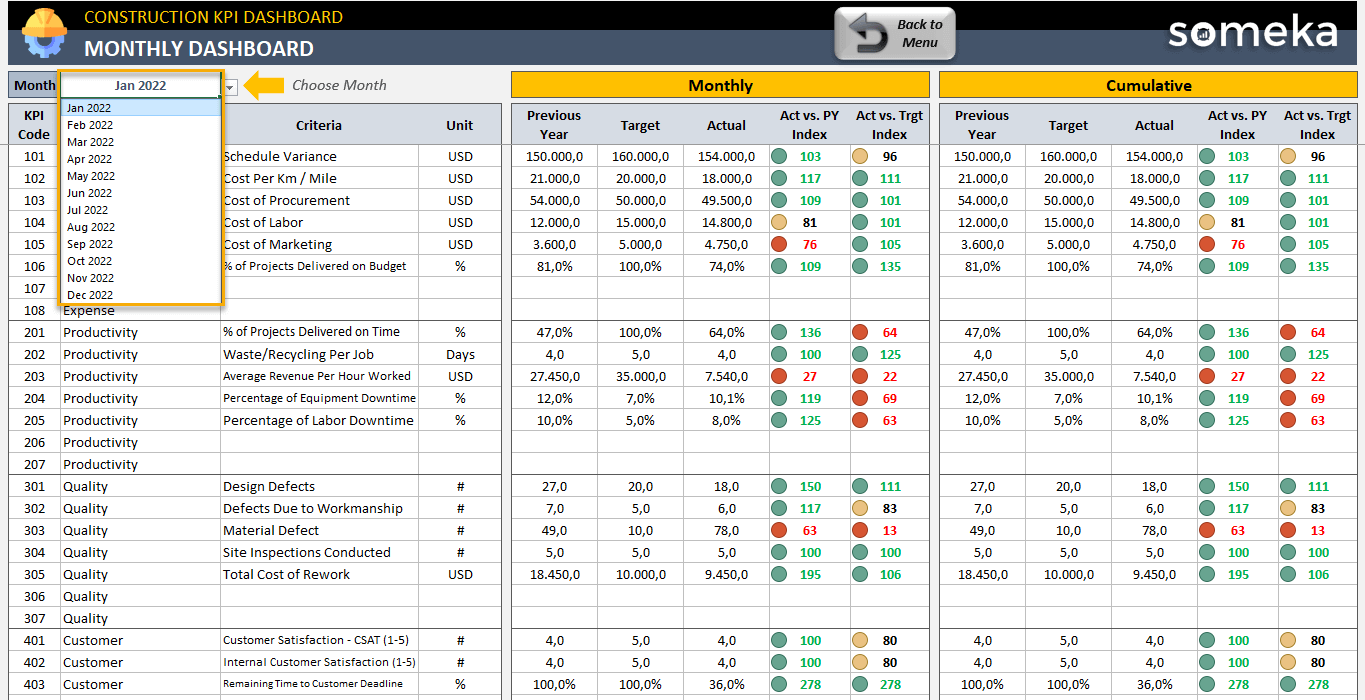
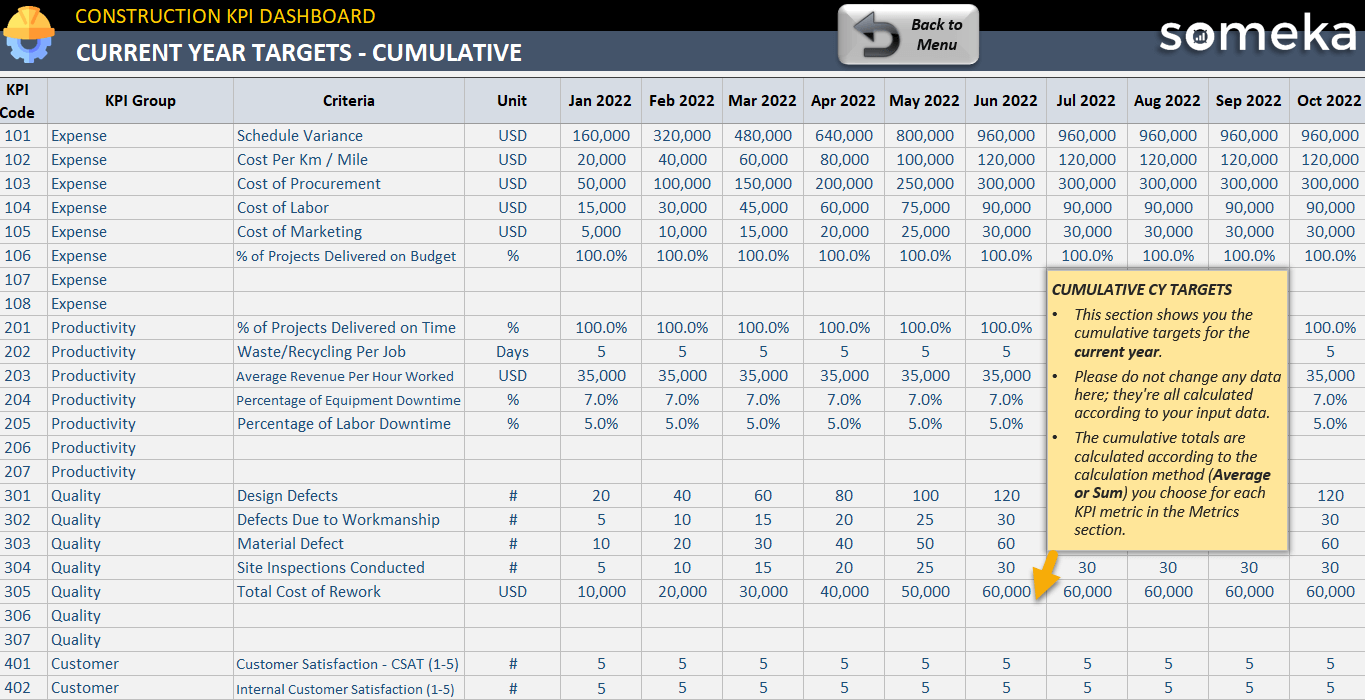
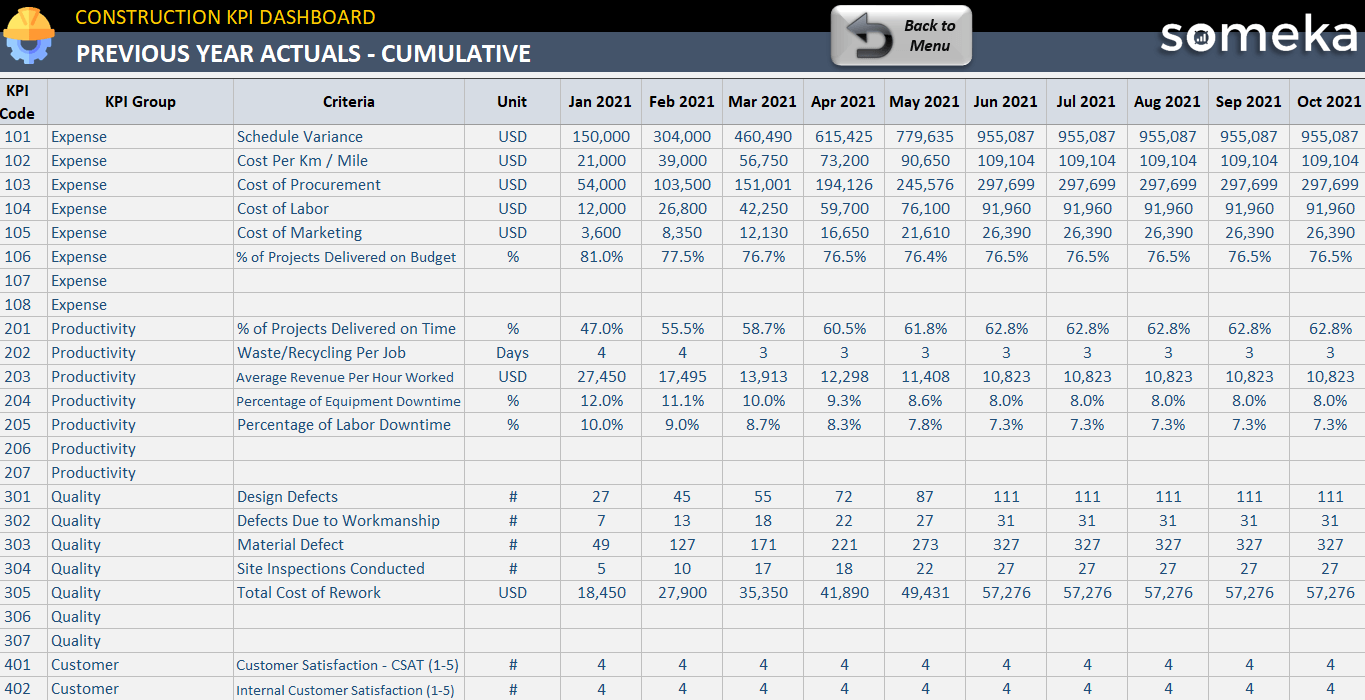
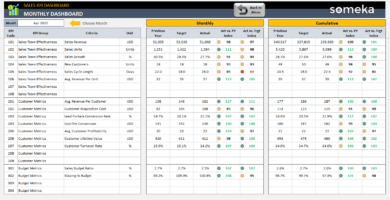
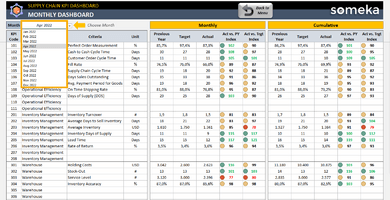
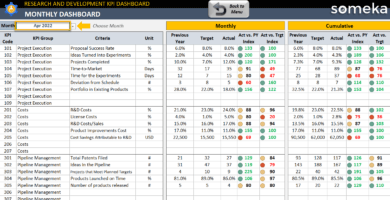
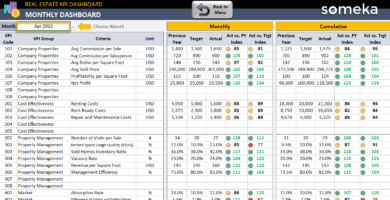
After filling out the Construction KPI Dashboard Template, you can check all the monthly and cumulatively results from the Dashboard. In that way, you will be able to interpret the past year and the company targets comparison.
Detailed Description of Construction KPIs in Excel Template
 Expense
 Expense
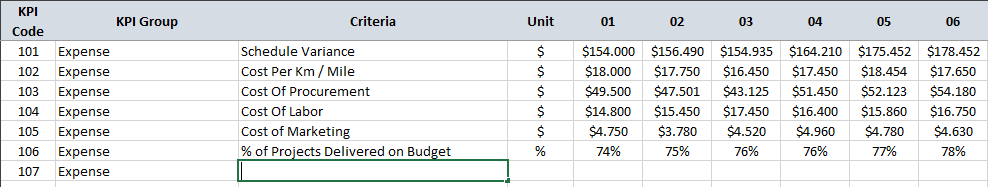
Schedule Variance: To measure this construction KPI use this formula: Subtract the Budgeted Cost of Work Scheduled (BCWS) from the Budgeted Cost of Work Performed (BCWP). If the conclusion is negative it means you are behind the schedule.
Cost Per Km / Mile: The cost of 1 km or mile of the building. It could be trained stations as well as a subway system or an office tower.
Cost Of Procurement: The total cost of purchasing depends on the project requirements.
Total Cost Of Labor: The total cost of employee payments including taxes, bonuses, benefits, etc.
Cost of Marketing: The total cost of all marketing activities such as an advertisement, customer support, etc.
% of Projects Delivered on Budget: This KPI metric estimates if the cost of your project will be above or below your projected upper limit.
To emphasize, you can add new KPI’s on your dashboard in this Excel template.
Productivity
 Productivity
% of Projects Delivered on Time: An insight into the delivery timeline for your project. It’s quite simple to set clear targets for this metric and measure it if you manage your projects with timelines.
Waste/recycling Per Job: Also known as Mean Time Repair represents the time between the start of a problem and the moment it gets resolved.
Average Revenue Per Hour Worked: To calculate this metric use this approach: Total Revenue/Scheduled Cost.
Percentage of Equipment Downtime: Consider your equipment productivity. If your ratio is too high for the target or previous project/year you may reconsider changing your equipment. It can be an advantage in the long term.
Percentage of Labor Downtime: Do you have too much wasting time based on internal or external reasons? Consider your personal productivity. Then reconsider your team management system.
Moreover, this KPI Dashboard Excel template for construction companies gives the opportunity to add new metrics.
Quality
 Quality
Design Defects: How many issues appear in a specific period of time. This metric can include the defects of siding and fascia, windows, roofs, wood floors, ventilation, and drywall. Defects may also be related to design and engineering, soil, and structure.
Defects Due to Workmanship: This metric can include a defect of poor workmanship, the defects of craftsmanship, skillfulness, expertise, technique, and artistry.
Material Defect: This metric can include the defects of manufacturer faults that don’t realize until after installation.
Site Inspections Conducted: Regular inspections are an important part of the workplace’s overall occupational health and safety program.
Total Cost Of Rework: This construction KPI shows your defects cost caused by supplier, material, or workmanship. Also, you may need to rework caused by customer unsatisfactory.
Customer
 Customer
Customer Satisfaction – CSAT (1-5): Once, you supply an experience with a product or service to your customers, you should measure how to meet expectations.
Internal Customer Satisfaction (1-5): Internal customers are important as as the external customers for your continuity of business health.
Remaining Time to Customer Deadline: The ratio in percent of the passed time and remaining time from a certain time span with start and end date.
Also, feel free to add new metrics or change the existing ones according to your needs in this KPI Excel template.
Workmanship
 Workmanship
Worker Satisfaction: To decrease your turnover rate you should measure whether your employees are happy and fulfilling their needs and engaged at work. You might conduct a private survey to understand the level of satisfaction of the employees.
Turnover Rate: This rate indicates the number or percentage of workers who leave and are replaced by new employees. It’s calculated with this formula: Turnover = (Employees Separated / Average Number of Employees) x 100.
Safety/Incident Rate: This important metric shows your safety performance level. However, the impress of reportable incidents may not be the same, so you should track your national or state average and compare your company’s safety performance.
Safety Meetings: You should create and improve your safety performances by providing sound guidelines to improve safety-related communications.
Finally, please remember that this KPI Dashboard template for construction industry lets you to add custom metrics according to your needs.
Construction KPI Dashboard Excel Template Features Summary:
- Monthly and Cumulative analysis
- Comparison with Past Year and Target values
- Summary dashboard supported with interactive charts
- Easy to use and nice design for the building industry
- Clear on-sheet instructions
- Compatible with Excel 2010 and later versions
- Works both on Windows and Mac
- No installation needed. Ready to use
- Full Print ready
- White Label
- Does not include any VBA macros
EXCEL KPI DASHBOARDS COLLECTION
PRODUCT VIDEO
Watch the video below to see the template in action! Presentation also includes usage notes, explanations and tips & tricks about the template.
USER REVIEWS & COMMENTS
12 reviews for Construction KPI Dashboard Excel Template
You must be logged in to post a review.
RELATED TEMPLATES
-
 This product has multiple variants. The options may be chosen on the product page
Weekly KPI Report in Excel
$29.95 – $59.95Download Weekly KPI Report Excel Template. Compare Actuals vs Targets on weekly basis. Ready spreadsheet. Cumulative charts included. Editable and printable.
-
This product has multiple variants. The options may be chosen on the product page
Sales KPI Dashboard Excel Template
$39.95 – $79.95Sales KPI Spreadsheet. Track your key metrics on sales team. Dynamic dashboard with trend charts and comparison analysis. All in Excel.
-
This product has multiple variants. The options may be chosen on the product page
Supply Chain KPI Dashboard Excel Template
$39.95 – $79.95Logistics KPI Tracker in Excel. Key metrics report for supply chain business with yearly and target-based comparisons. Printable dashboard with charts.
-
This product has multiple variants. The options may be chosen on the product page
Research and Development KPI Dashboard Excel Template
$39.95 – $79.95Excel KPI spreadsheet for R&D departments. Track your key metrics with monthly and cumulative trend analysis. Printable and dynamic dashboard.
-
This product has multiple variants. The options may be chosen on the product page
KPI Dashboard Excel Templates Bundle
$199.95 – $399.95Bundle pack for KPI Dashboard templates in Excel. Top selling KPI tools. All uniquely designed, printable, professional spreadsheets. Ready for use.
-
This product has multiple variants. The options may be chosen on the product page
Real Estate KPI Dashboard Excel Template
$39.95 – $79.95Excel KPI spreadsheet for real estate business. Track your key metrics with monthly and cumulative analysis. Printable and ready-to-present dashboard.
Alessio Bianchi –
Your templates seem to focus on simplicity
Mikhail Ivanov –
I loved the monthly dashboard, it’s an elegant view to analyze our metrics.
William Harris –
These templates are so reliable, I keep coming back for more.
Ramesh –
Templates that are intuitive and a joy to work with.
Abdullah Enzadi –
Thaks team! Yo addressed my questions and concerns quickly, maintaining consistent communication throughout.
Nour Ahn –
I noticed clean slide layouts in yourtemplates. Well thought!
Luca –
I appreciate the quality, but the pricing is a factor I have to think about.
Rodney –
This has nice charts and metrics can be added and modified independently.
Krista Obrien –
Easy to use, not expensive, simply to navigate.
Michael Xu –
great
Russell –
It is so flexible that it enables me to create reports without needing extras. Being so flexible, I had no friction to start adding reports and to check them periodically. If I had to make it from scratch instead, I probably wouldn’t have even half of the reports I currently have.
brett parks –
I appreciate all the help I got. This was a critical project for me and your product seems to be EXACTLY what I need. I am NOT a spread sheet expert by any means but I can get it to work the way I need.