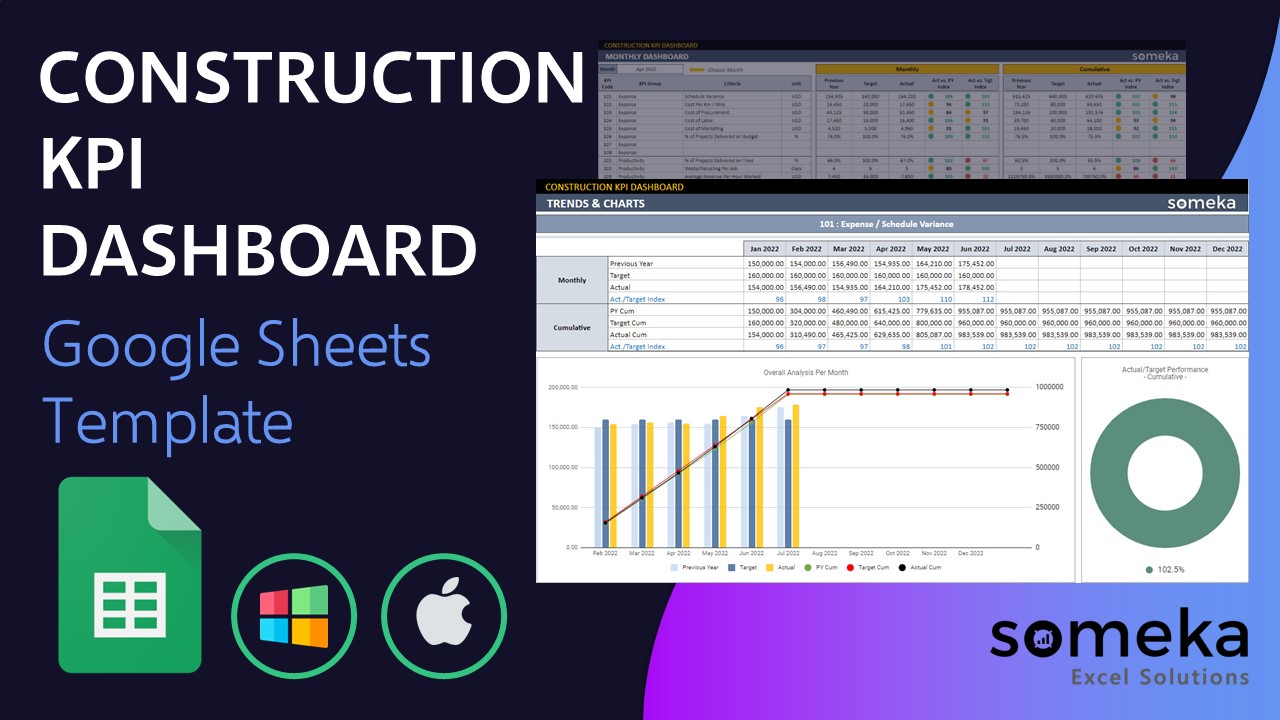
Construction KPI Dashboard Google Sheets Template
Google Sheets KPI tool for construction firms. Track performance indicators to keep business safety. Printable dashboard with monthly chart analysis.

TEMPLATE DESCRIPTION
The Construction KPI Dashboard Google Sheets Template is an excellent tool for managing and tracking the productivity and effectiveness of your team. Also, you can easily design your own dashboard panel that displays all the information you require about your construction projects.
In addition, you should keep an eye on Objectives and Key Results (OKRs) and several key performance indicators (KPIs), and you can find them all in one place. Moreover, you won’t have to learn any new third-party tools! This Google Sheets template allows you to do everything.

Besides, there are numerous advantages to using the Construction KPI Dashboard, including:
- Simply show your KPIs
- Performance Tracking
- Printing or sharing your data with team members and stakeholders with one click
Construction Key Metrics
Here’re some very common key indicators for construction projects, engineering and safety:

- Rate of Safety Incidents: Firstly, a safer site carries low risk and costs less in the long run. If problems arise, they may cause your project to be delayed with time cost. In addition, safety incidents may result in higher insurance payments. As a result, knowing and understanding your safety rating is critical to cutting costs and keeping your employees productive.
- Workplace Satisfaction: While tracking your employees’ performance is critical for project success, measuring their development and satisfaction is also essential. Employees who are invested in and happy with their jobs will be able to work more efficiently in the long run and contribute more to the bottom line.
- Some other metrics: Recycling Per Job/Material Defect/Turnover Rate/Cost of Procurement
Besides the preset metrics in the template, you can also add new ones according to your needs.
Sections of Construction KPI Dashboard Google Sheets Template
Basically, the welcome page includes a simple switch panel. To clarify, you can move between sections by swiping. You can navigate through the main panel to enter data or check your statistics.
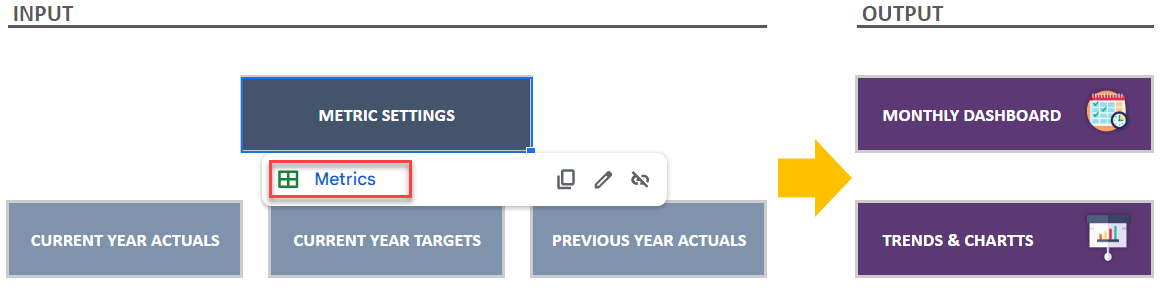
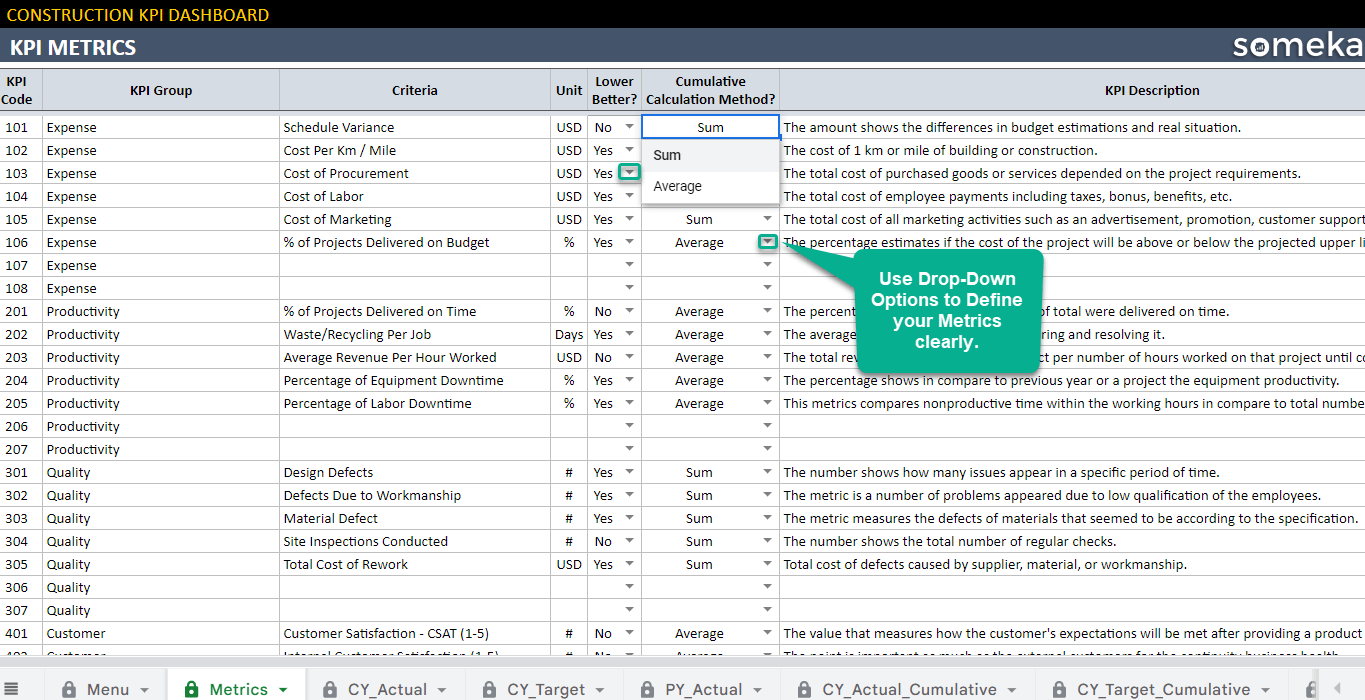
1. Metrics:
Firstly, you can add your metrics here along with their category, unit, and even a brief description of each metric. This serves as the template’s basis. As a result, to more clearly define your objectives, always consult with your team, find out their opinions, and strive for extreme detail in this section.
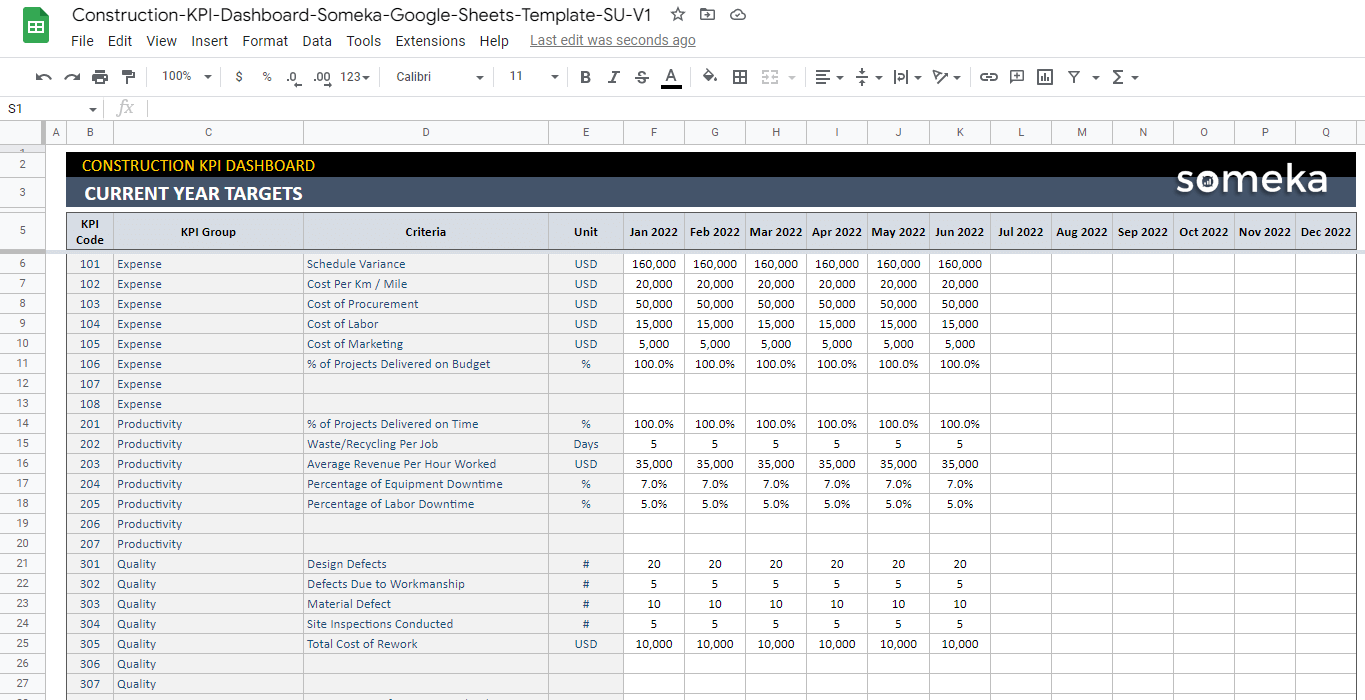
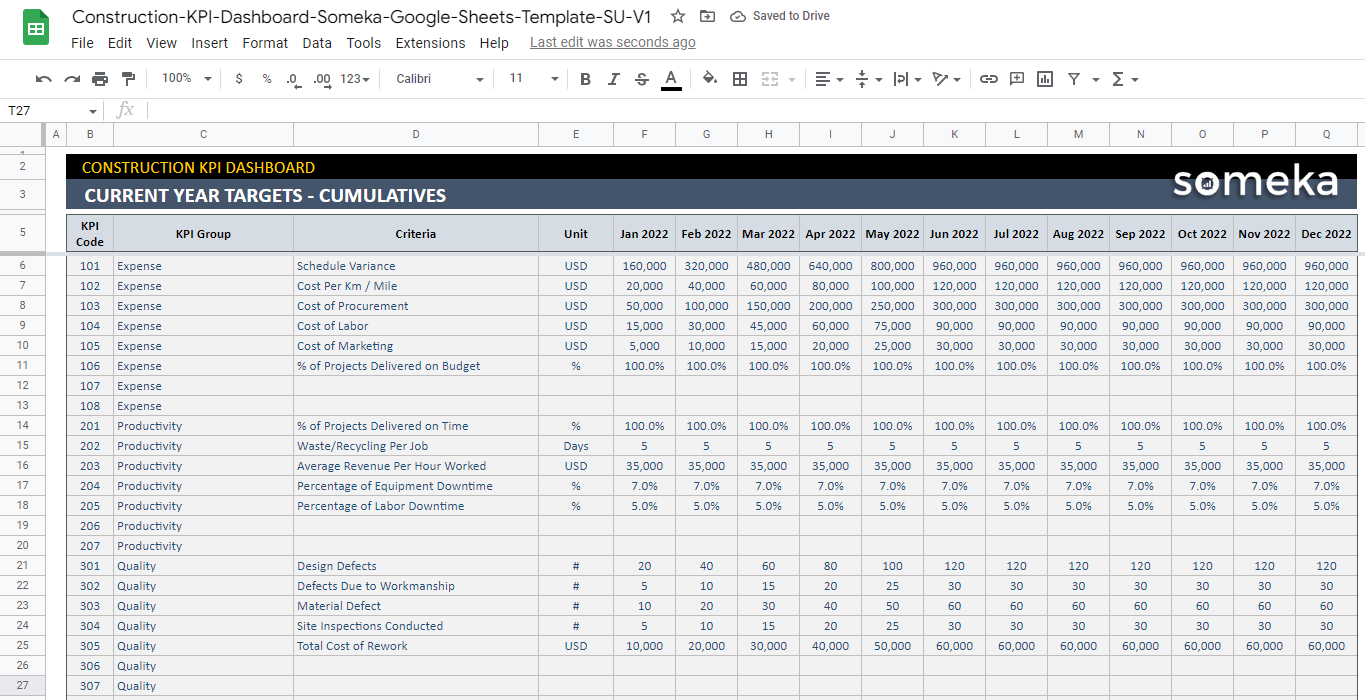
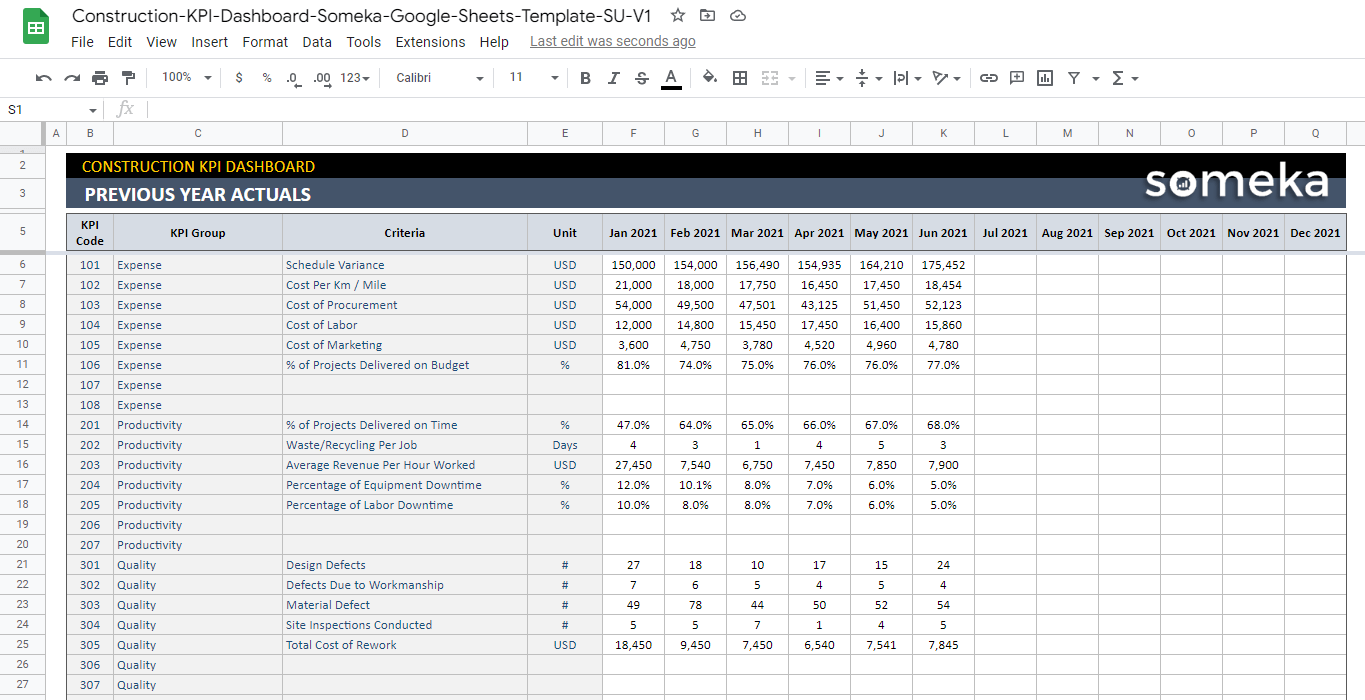
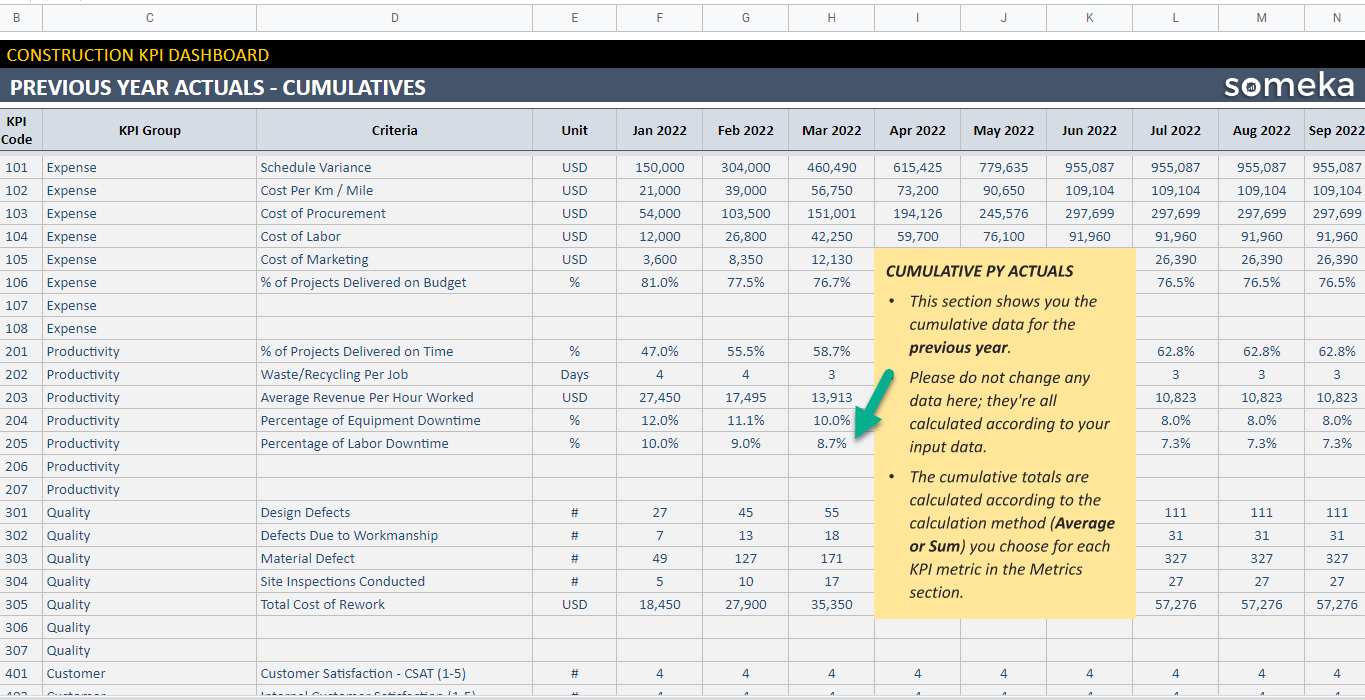
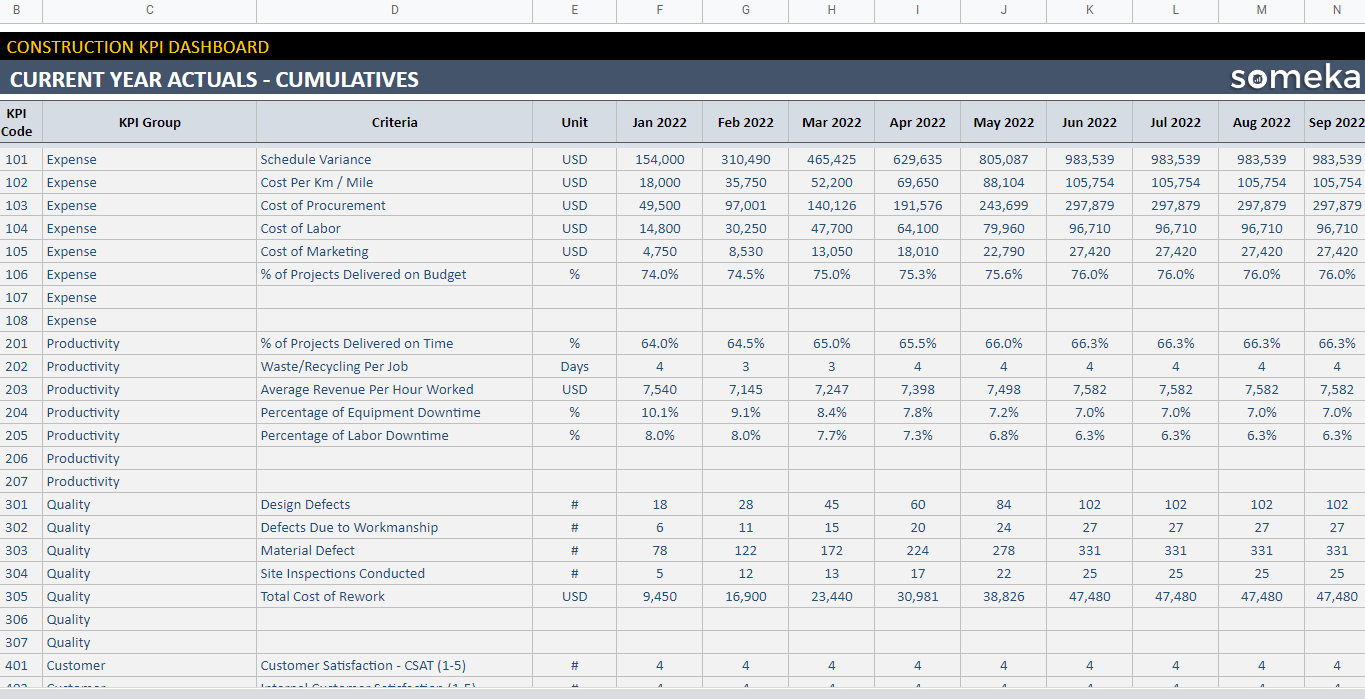
2. Actual and Target Values from the Current and Previous Years Actual:
Secondly, the KPI Dashboard Google Sheets Template calculates the current years actual cumulative, current year target cumulative, and previous years actual cumulative after you add the results for each month to the sheet.
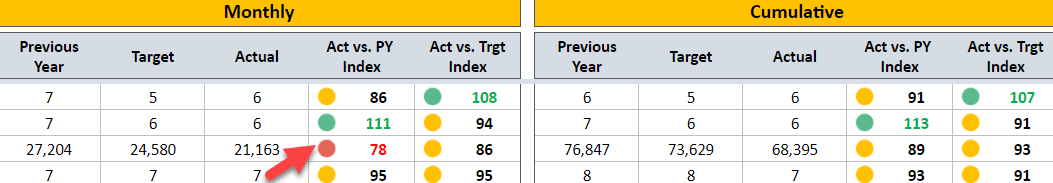
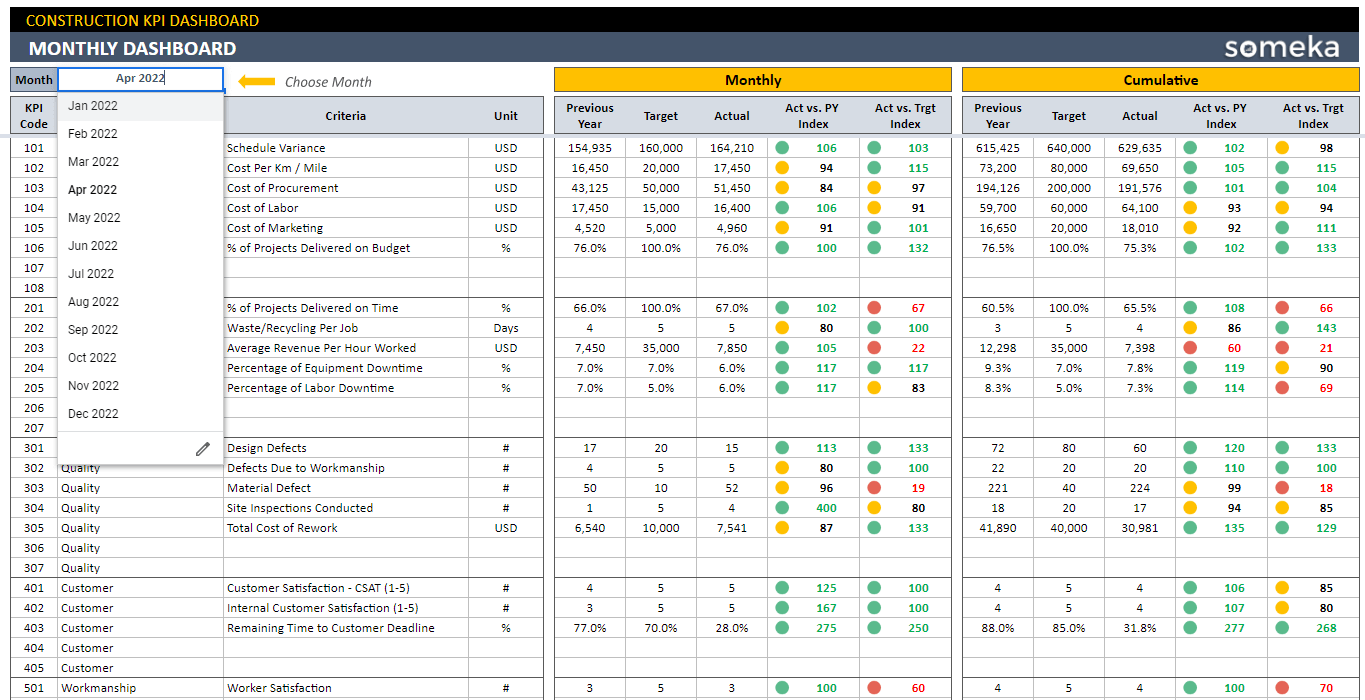
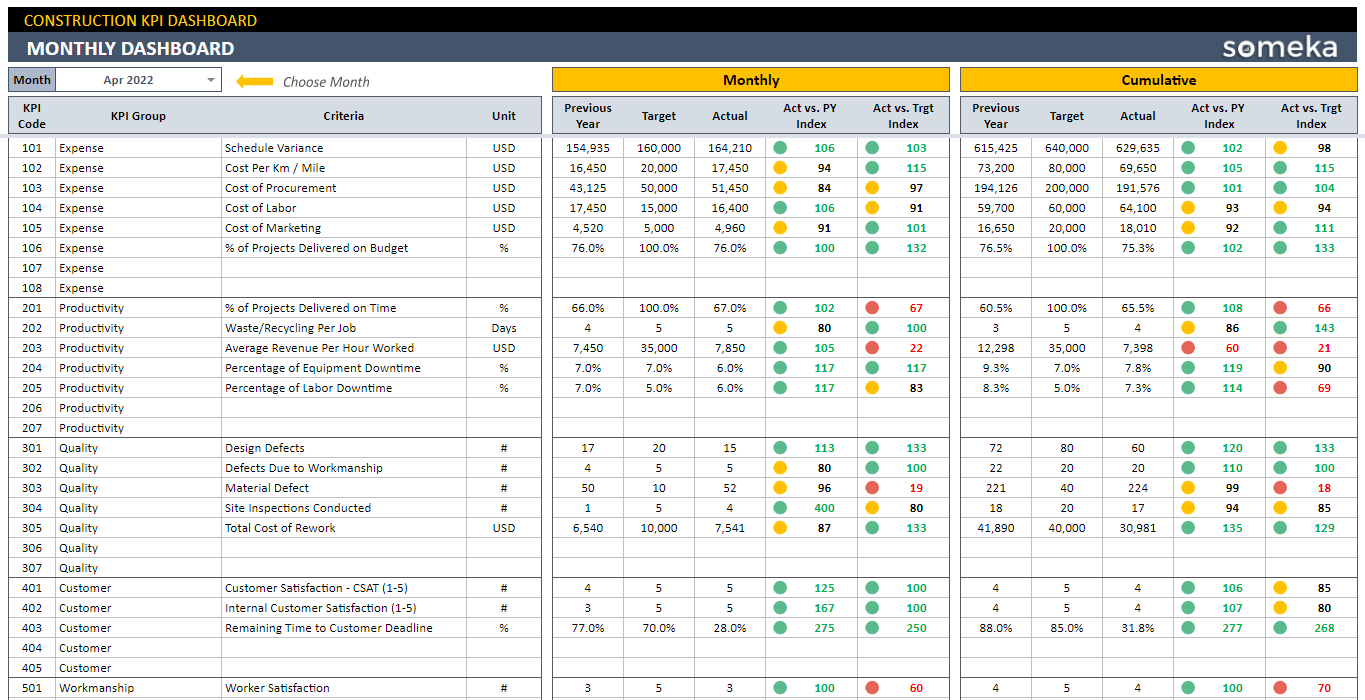
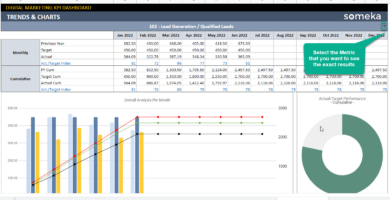
3. Monthly Analysis:
With the Monthly Analysis section, you can understand if the selected month has a positive impact on your cumulative statistics. You can also see each of the KPIs-specific data for actual and target years.
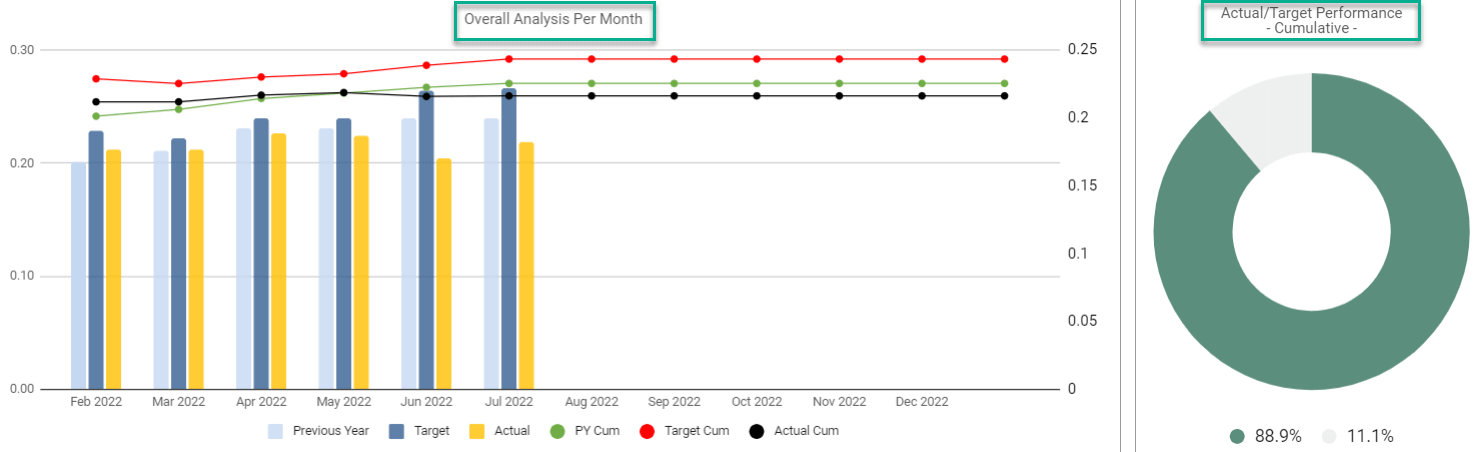
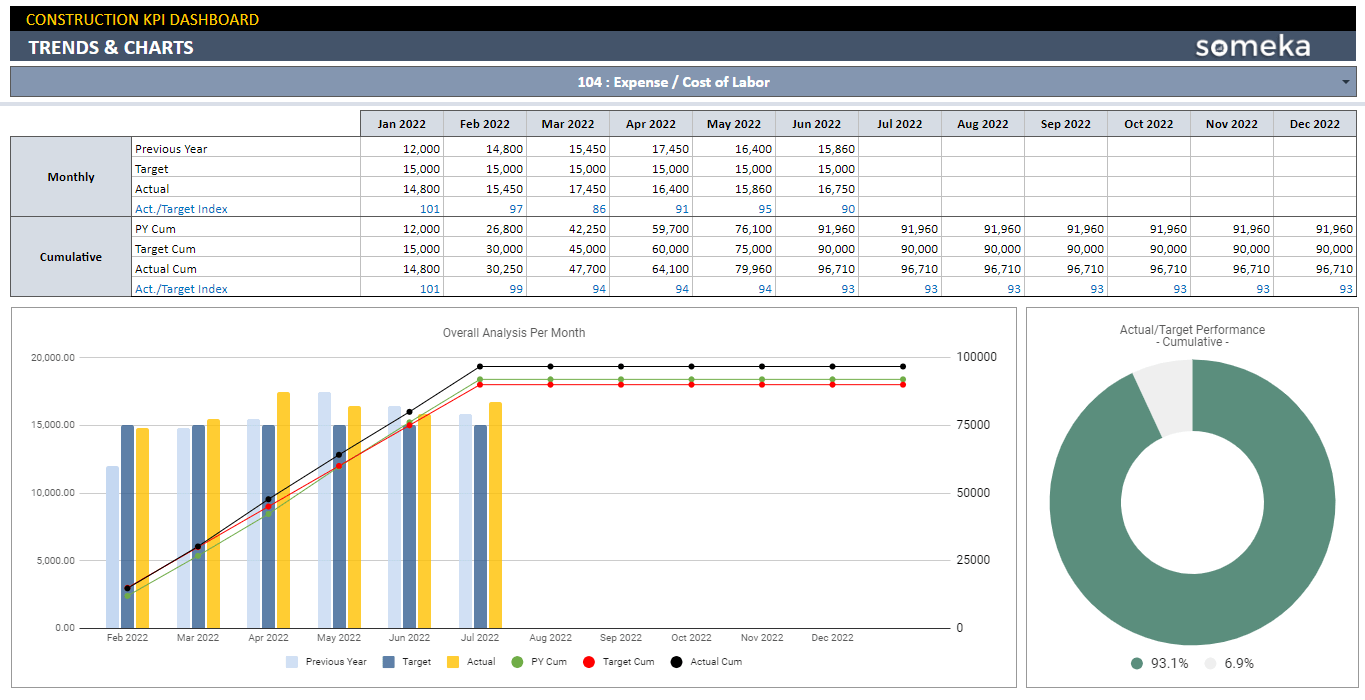
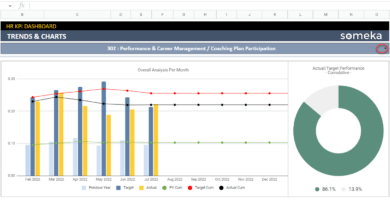
4. KPI Analysis in Construction Google Sheets Template
Finally, Trend charts allow you to inspect and compare all metrics. You can select one of your KPIs and check to see if everything is in order.
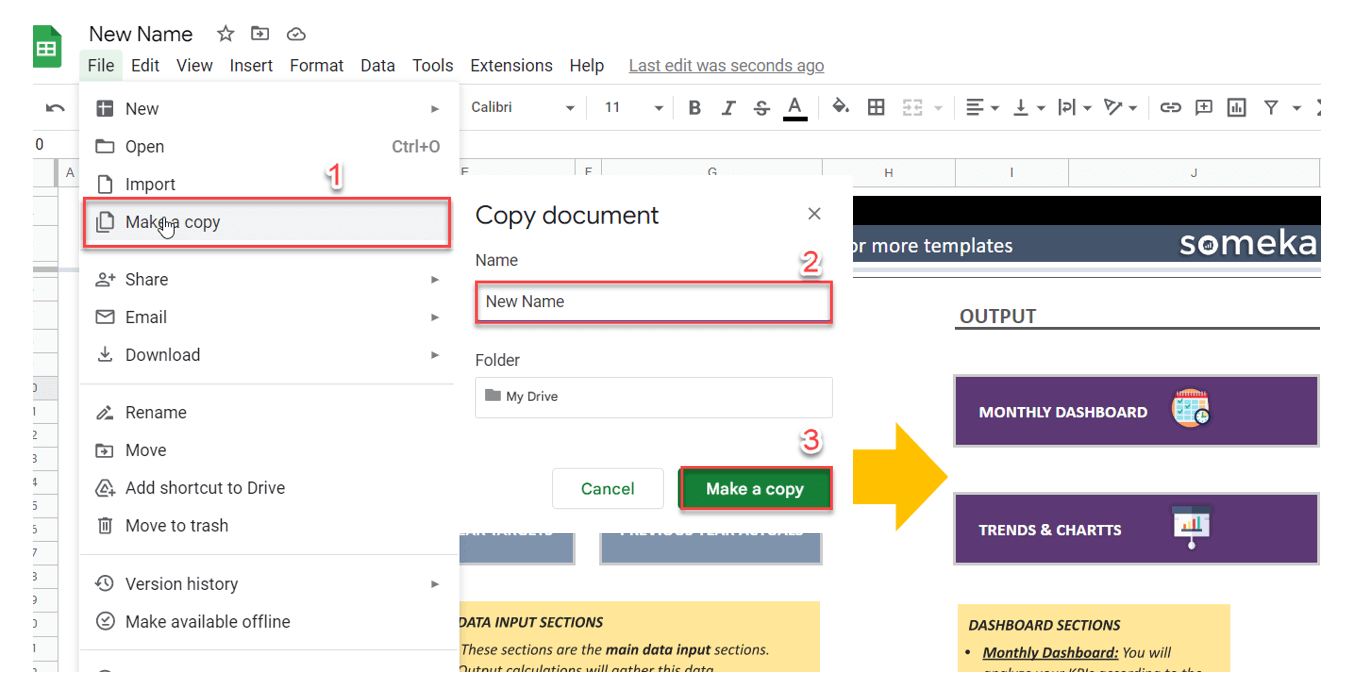
Meanwhile, all you need is an internet connection and a Google account to get started. And everything will be in sync!
Construction KPI Dashboard Google Sheets Template Features Summary:
- Track performance in Google Sheets
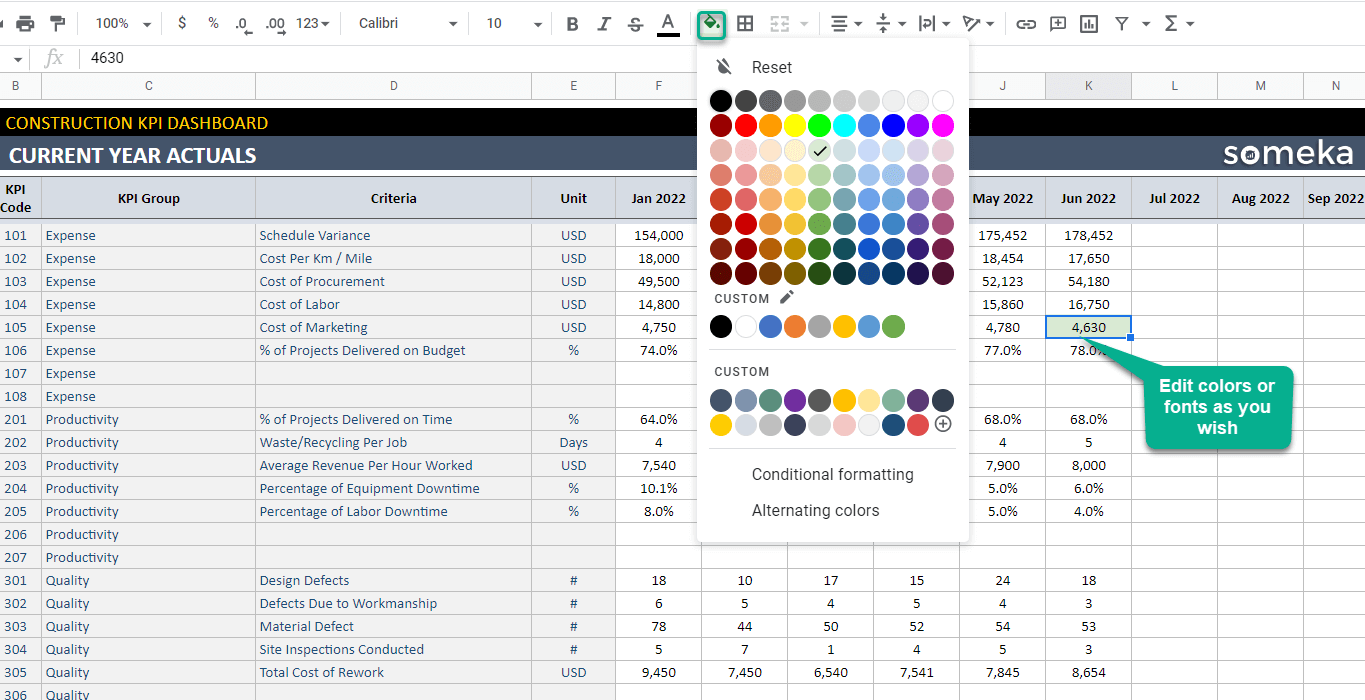
- Easily customizable layouts for contractors
- Monitor each metric separately to assess your performance
- Improve quality with clear targeting
- Ready to Print template
- Informational notes included
- No installation is needed, ready to use
- Works on any operating system
- Suitable for any device including mobile, tablet, desktop
GOOGLE SHEETS KPI DASHBOARDS COLLECTION
PRODUCT VIDEO
Watch the video below to see the template in action! Presentation also includes usage notes, explanations and tips & tricks about the template.
USER REVIEWS & COMMENTS
6 reviews for Construction KPI Dashboard Google Sheets Template
You must be logged in to post a review.
RELATED TEMPLATES
-
 This product has multiple variants. The options may be chosen on the product page
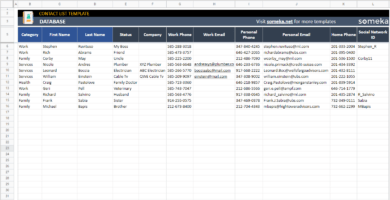
Contact List Google Sheets Template
$9.95 – $19.95Contact list template in Google Sheets. Keep all your customer data in one place. Printable, shareable, and editable online file with access from all devices.
-
This product has multiple variants. The options may be chosen on the product page
HR KPI Dashboard Google Sheets Template
$39.95 – $79.95Google Sheets dashboard for HR key metrics. A visual presentation of employee data. Printable file with preset and custom KPIs. All ready-to-use.
-
This product has multiple variants. The options may be chosen on the product page
Digital Marketing KPI Dashboard Google Sheets Template
$39.95 – $79.95Digital marketing tracker in Google Sheets. Keep all your performance metrics in one place. Printable KPI dashboard with access from any device.
-
This product has multiple variants. The options may be chosen on the product page
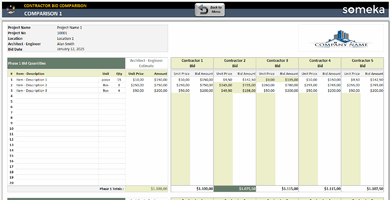
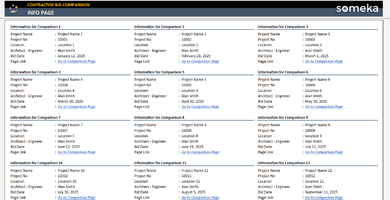
Contractor Bid Comparison Spreadsheet in Excel
$29.95 – $59.95Contractor Bid Comparison Spreadsheet. Compare offers, analyze costs and select the best contractor. Ready template in Excel. No installation, no set up.
-
This product has multiple variants. The options may be chosen on the product page
Team To Do List Excel Template
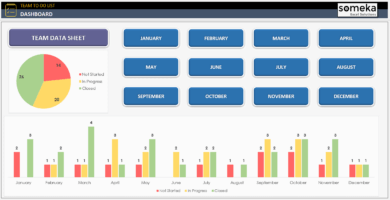
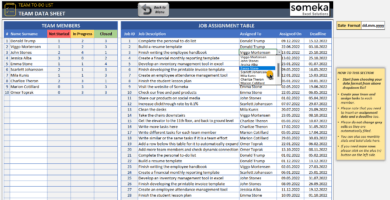
$34.95 – $69.95Excel Team To Do List Template is designed for task management and tracking of employees. Summary dashboard with charts. Editable & printable.
-
This product has multiple variants. The options may be chosen on the product page
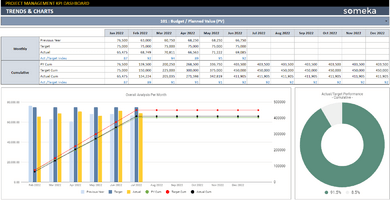
Project Management KPI Dashboard Google Sheets Template
$39.95 – $79.95KPI dashboard in Google Sheets for project managers. Monthly comparisons with trend charts. Ready-to-use template with access from all devices.


Nicholas A. –
Thats great but I wanna add some different kpi but how? Please help!
Someka –
Hello Nicholas,

You can quickly enter your value as a KPI while on the KPI metrics tab.
If you require further assistance, please contact us at contact@someka.net and a member of our team will assist you.
Lucy B. –
Adorable for any googlesheets!
Hadley Santiago –
I wasn’t expected to have sth like this. Simple and cool!
Mia –
If youre in construction job, you gotta have it, surellly!!!
Yvette –
Great tool to make diference on construction evaluation
Daniel Wells –
I couldn’t understand the any operating system. Help pls!!
Someka –
Hello Daniel
This tool will help you in quickly understanding any type of KPI if you wish to operate, check, and analyze them. You can track the progress of the KPIs you entered.
If you have any extra questions, please email us at contact@someka.net and one of our professionals will assist you.