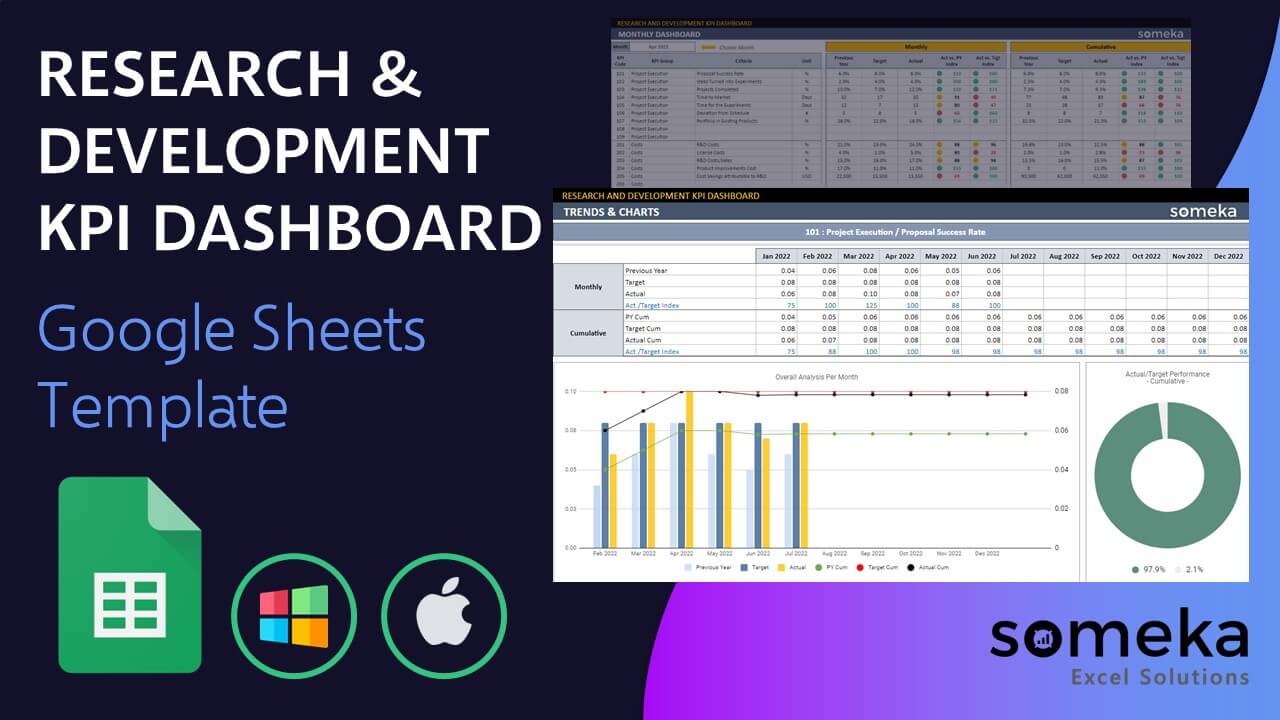
Research and Development KPI Google Sheets Template
R&D KPI template in Google Sheets. Track key metrics with dynamic and printable dashboard. Online spreadsheet with access from any device.

TEMPLATE DESCRIPTION
Keeping track of key metrics, such as time to market, product cost, and usage metrics, can be a difficult task for R&D departments. So, this Research and Development KPI Google Sheets Template is here to help you track and analyze your data in great detail. You can easily track your R&D KPIs with performance indicators including R&D budget, product development ,etc.
Actually, R&D managers face a lot of challenges in their daily tasks: making sure the company is meeting its goals, managing teams, and completing projects. Also, it’s important that you’re using the right KPIs (key performance indicators) and OKRs (Objectives and Key Results) to track your progress against your goals.

What is Research and Development KPI Dashboard?
A Research and Development (R&D) KPI Google Sheets Template, is a tool that gives you a summary of the recent data related to your R&D department. By using this dashboard, you can compare your company’s performance with industry standards. This also helps in understanding where the company needs improvement, and what are the steps to enhance performance.
Benefits of Research and Development KPI Google Sheets Template
In order to improve the efficiency and effectiveness of your R&D department, you need a way to track and analyze your key metrics. So, a Research and Development KPI Dashboard can help you do just that.
Above all, this is a printable and dynamic dashboard so, you can keep it on-screen as a constant reference for yourself. Also, you can share it with team members.
The monthly trend analysis will show you how your performance has changed over time. While the cumulative trend will give you an overview of how well your department is performing overall.
Plus, the dashboard is interactive so that you can easily add new data points or change existing ones.
What are the 8 most useful R&D KPI and Metrics?

- R&D Costs: This metric measures the amount of money spent on research and development activities. It can be useful for benchmarking efficiency against industry peers or assessing the return on investment in R&D.
- Research Staff Productivity: This metric captures how much value is being generated per researcher employed in the department.
- New Patent Applications: A measure of innovation, this metric tracks how many new patent applications are filed each month/year.
- Number of Published Papers: Another marker of innovation, this statistic reflects how many papers are published by researchers within the department each month/year that contain original research findings.
- Technology Readiness Level (TRL): Assesses a technology’s readiness for prime-time commercialization, ranging from 1-9 with 9 being fully developed).
- Time to Market (TTM): Track the time between you made the idea until it becomes available as a product or service offering.
- Revenue Generated from Innovation Outputs: Measures sales generated from products or services resulting from innovations within the R&D department
- Return on Investment In R&D: Compares net income generated through sales of innovative products & services to the amount of R&D investment in those products & services.
You can add more metrics according to your particular needs.
Research and Development KPI Google Sheets Template Sections
There is an input part and an output part in this template. It is possible to go through all other sheets of the template with a single click. Just use Navigation Menu on the first sheet.
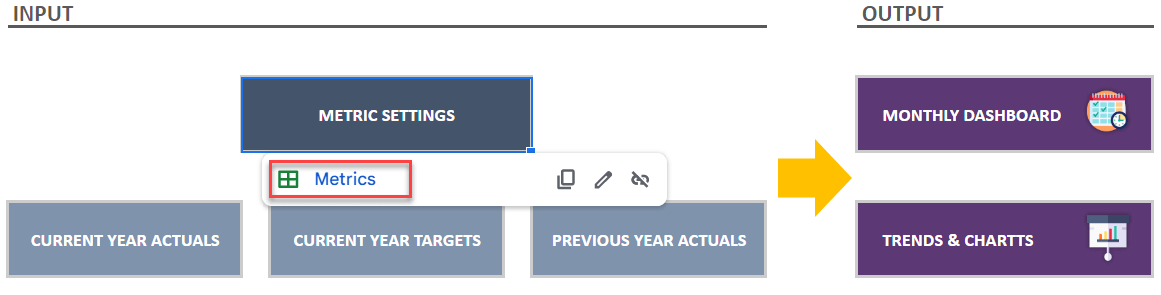
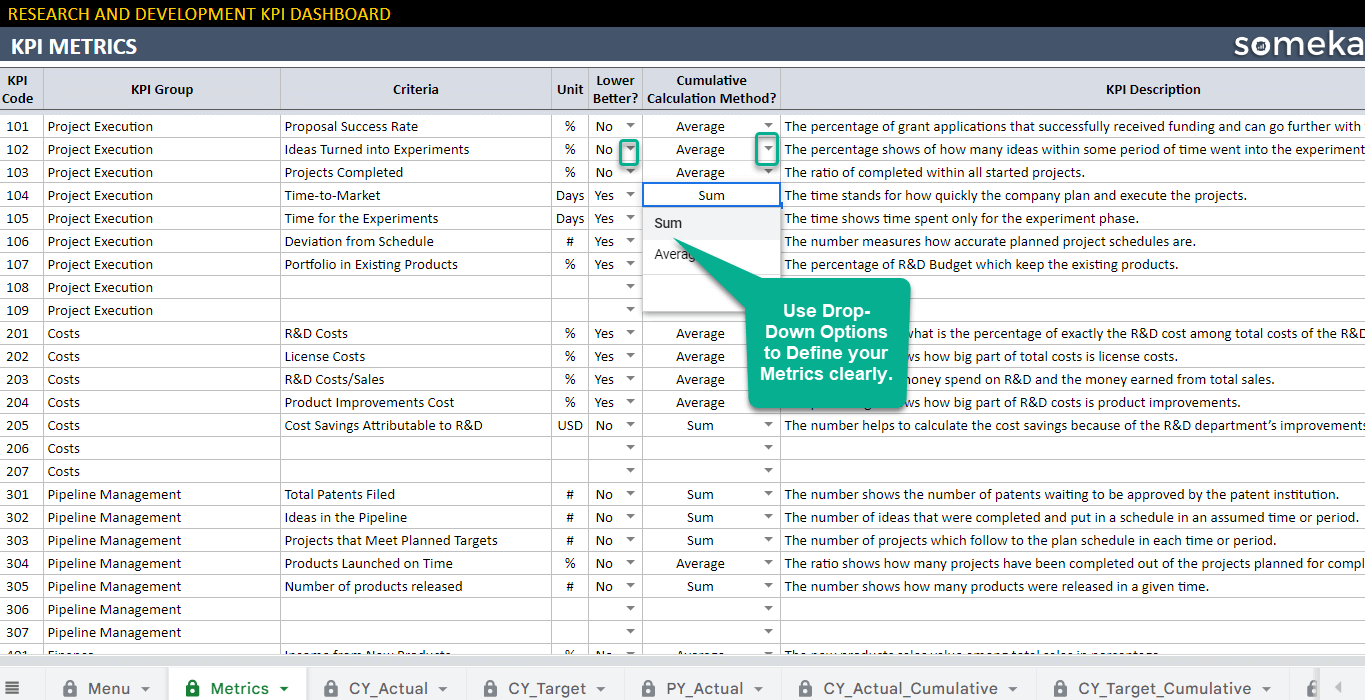
1. Metrics: Firstly, in this section, you have to add each of your desired metrics one at a time. Additionally, you can define Units and a low-level metric.
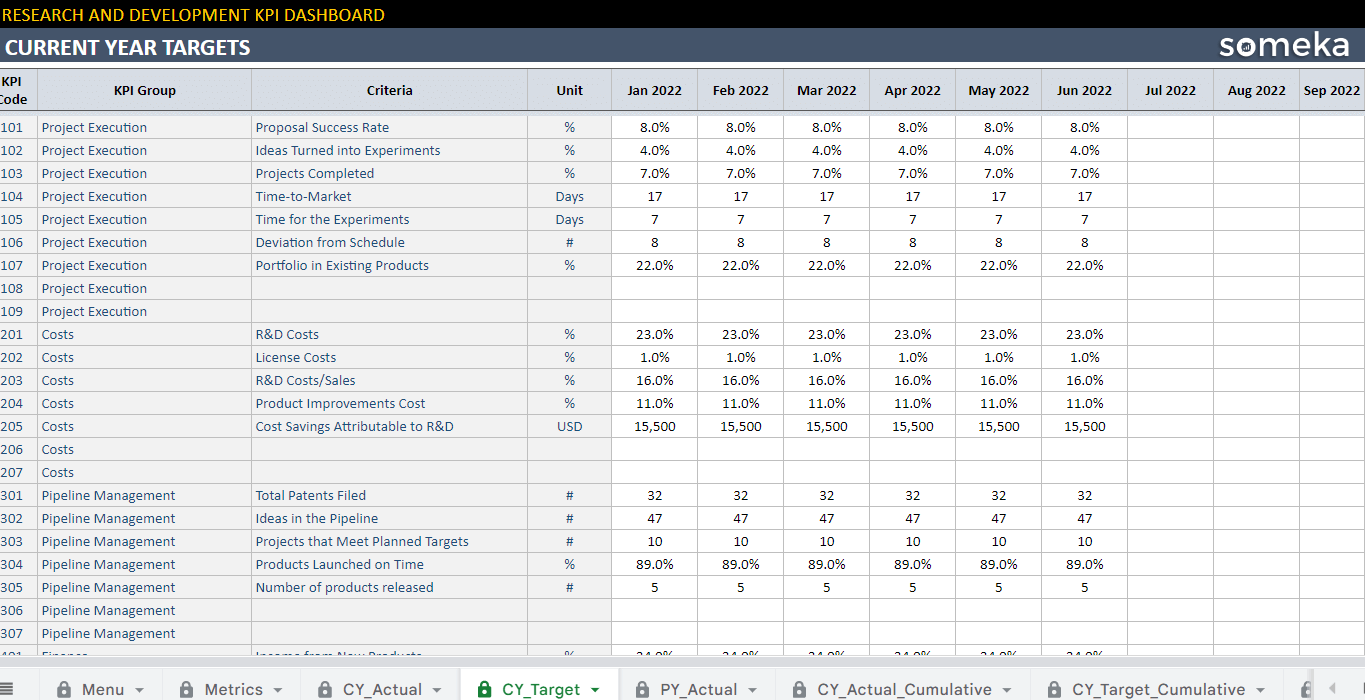
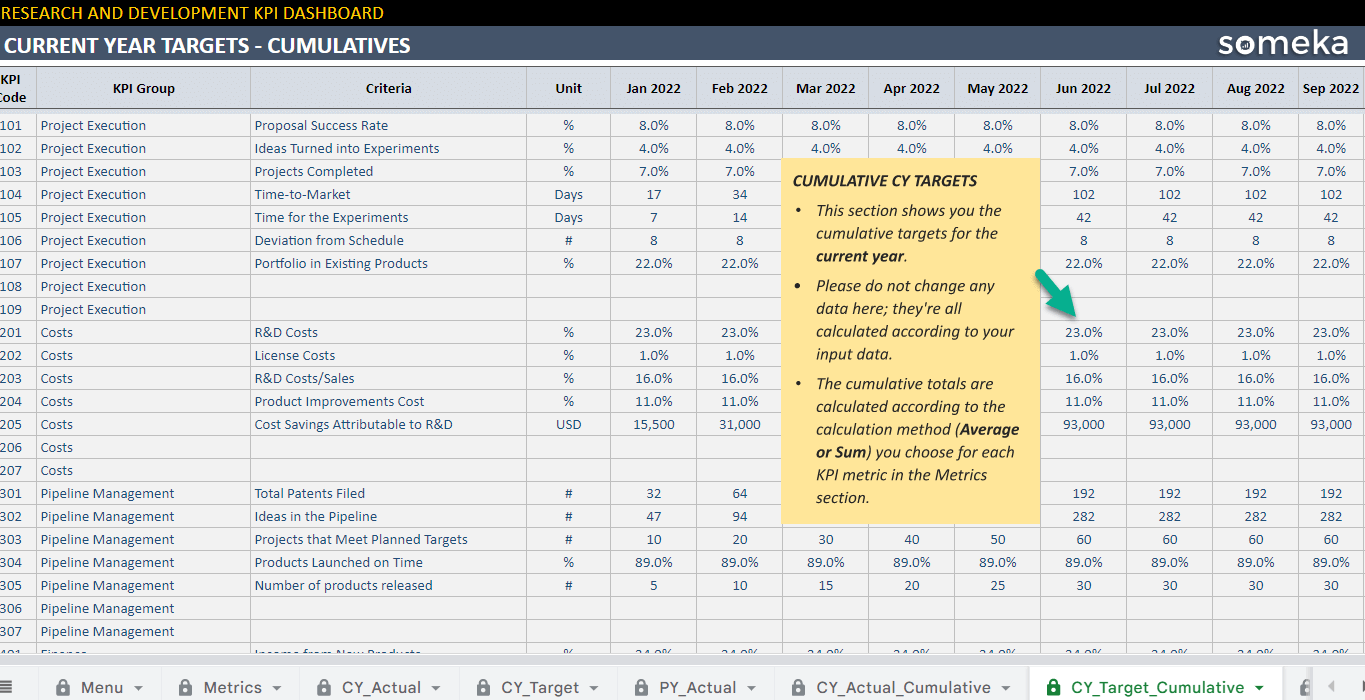
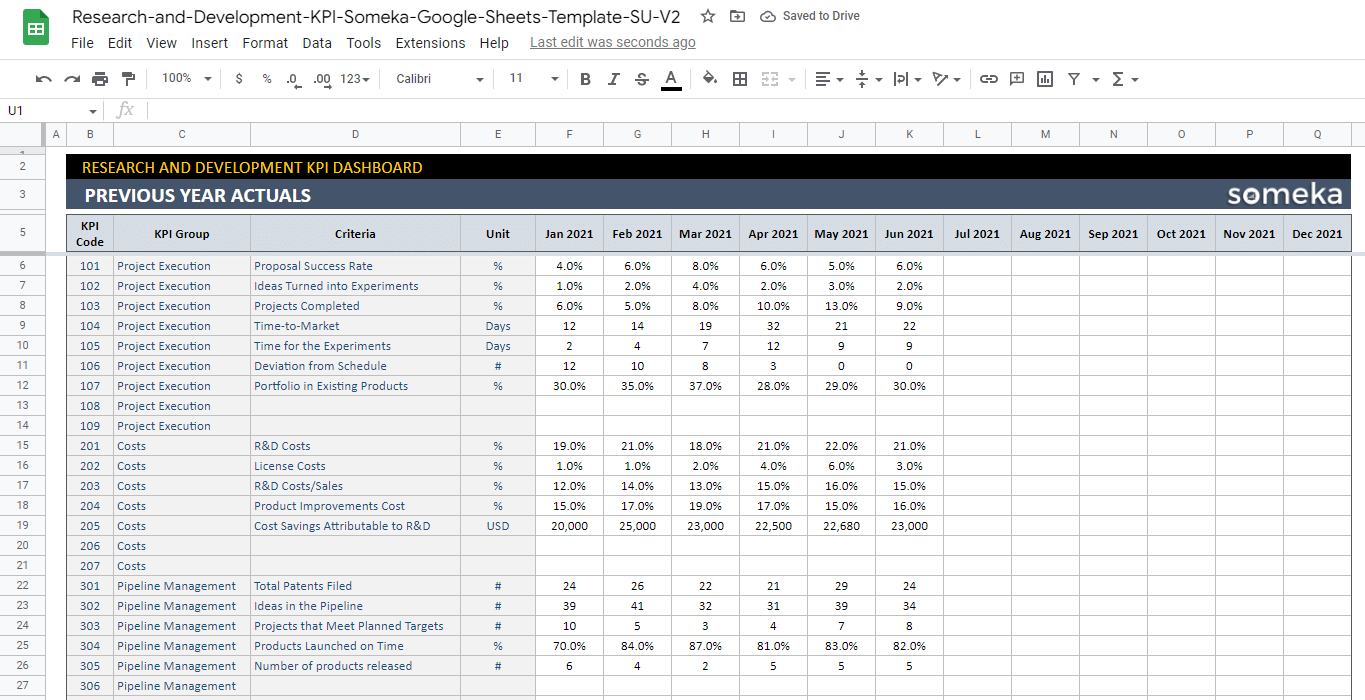
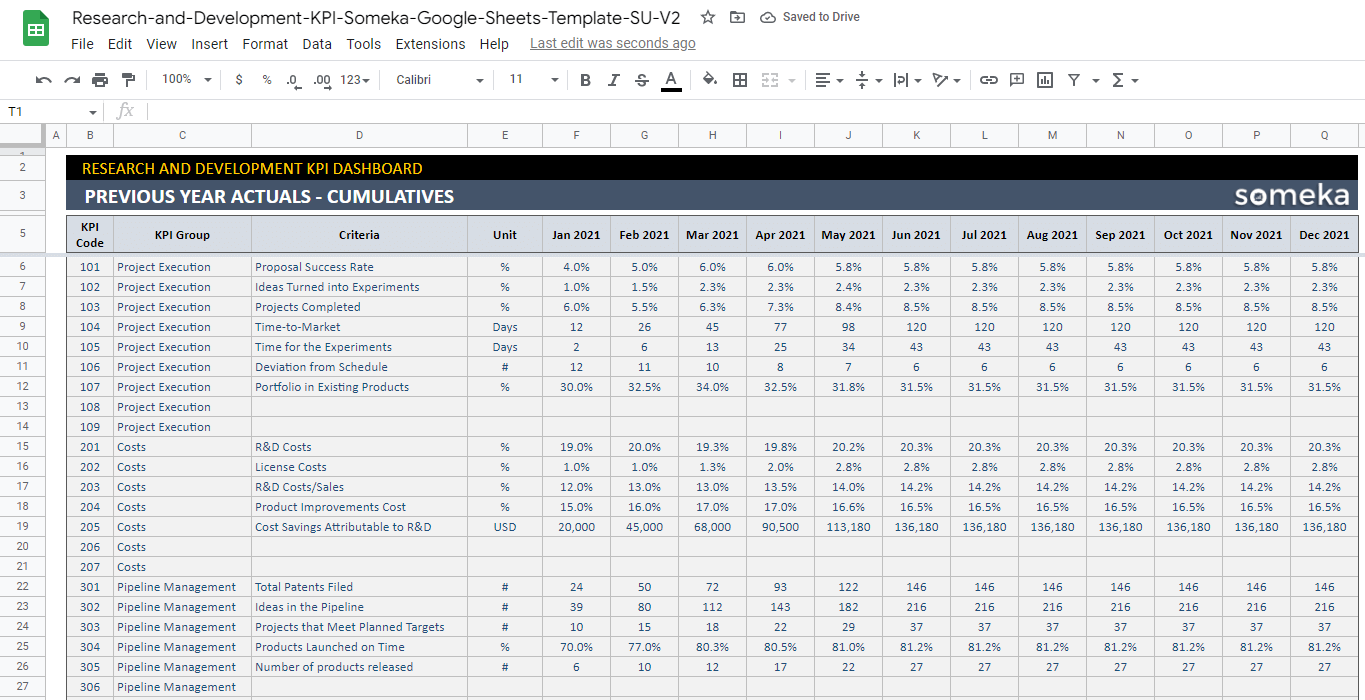
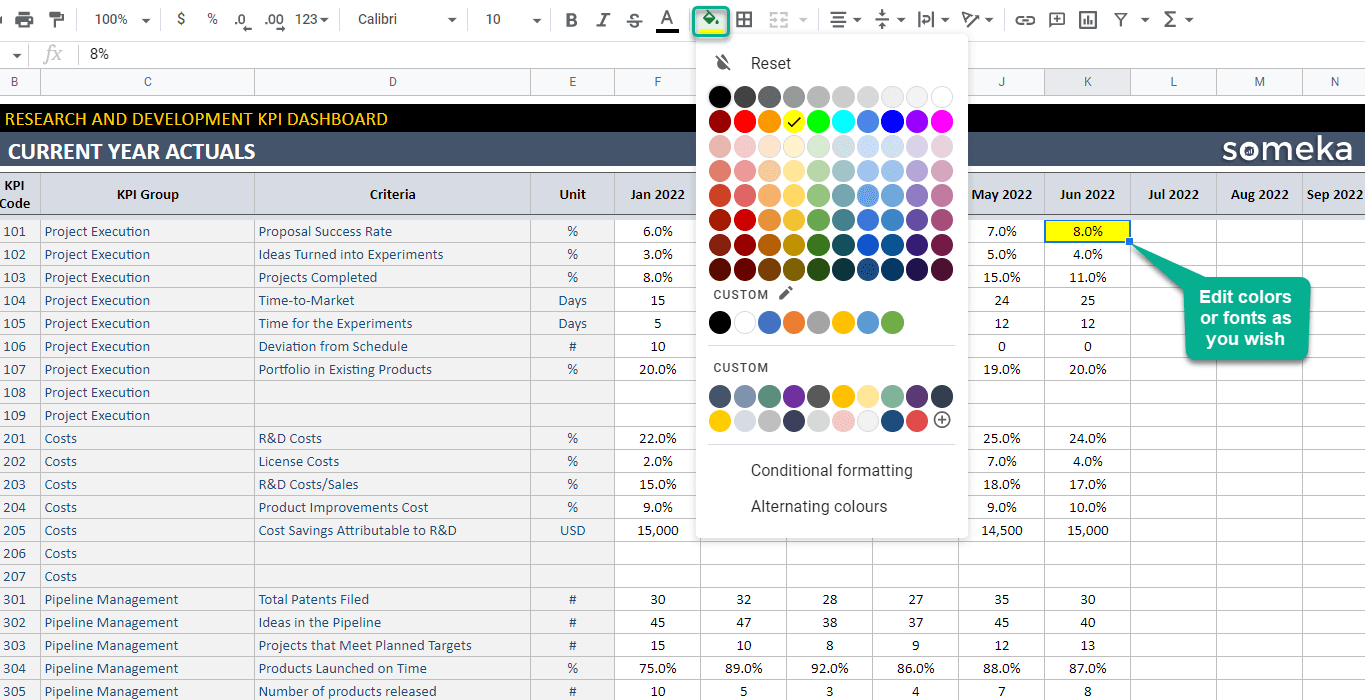
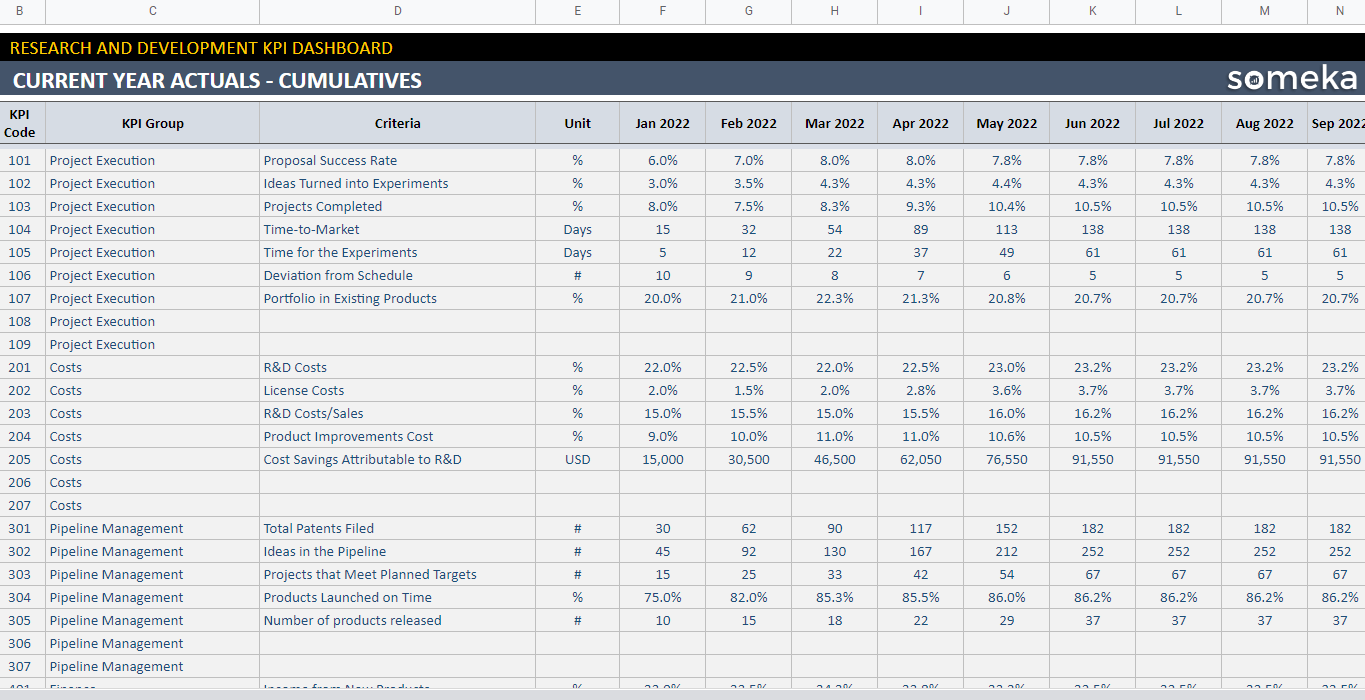
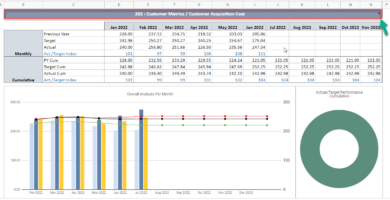
2. Current Year Actual and Cumulative: Secondly, the KPI Dashboard Google Sheets Template calculates the actual cumulative of the current year. The target incremental of the current year. And, the actual cumulative of the previous year by adding the results for each month to this sheet.
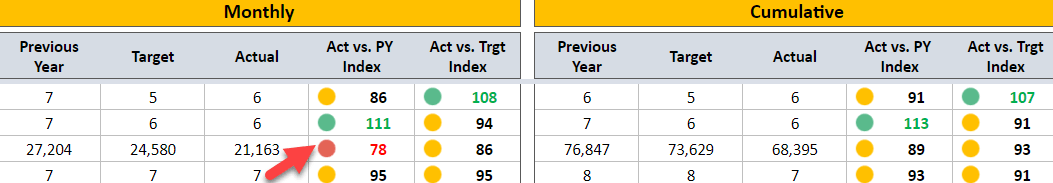
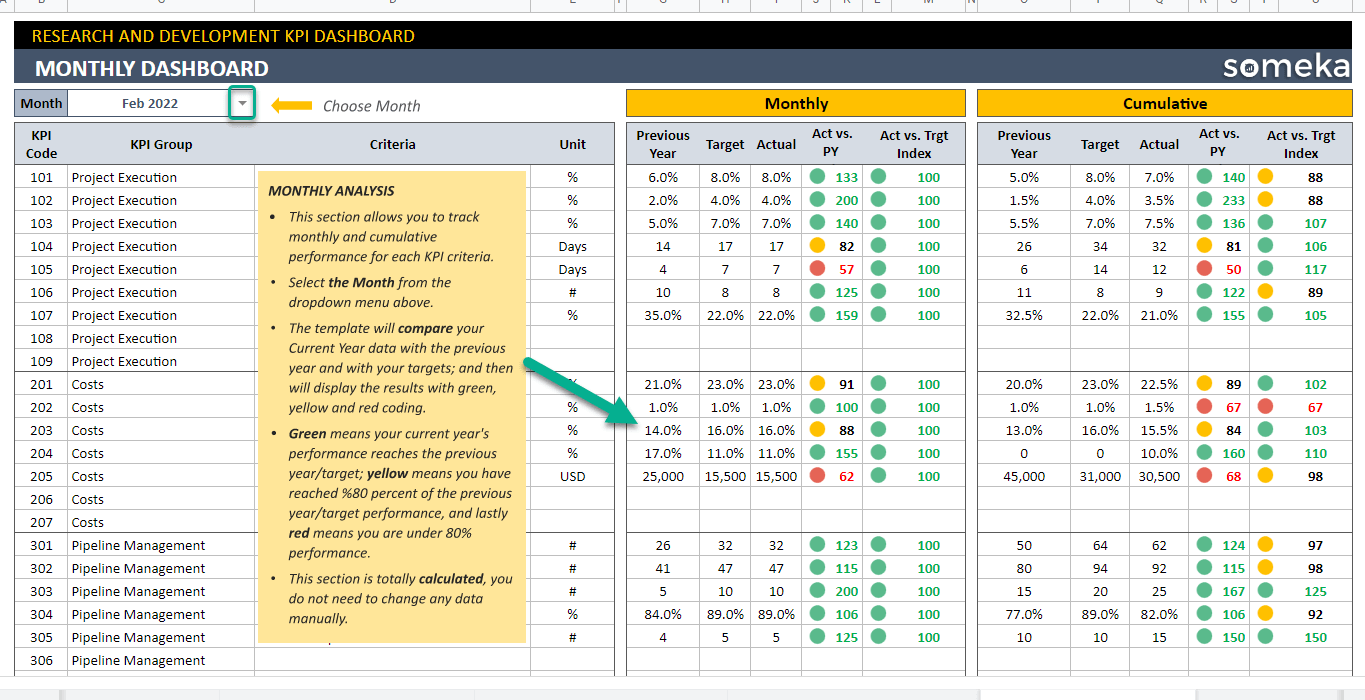
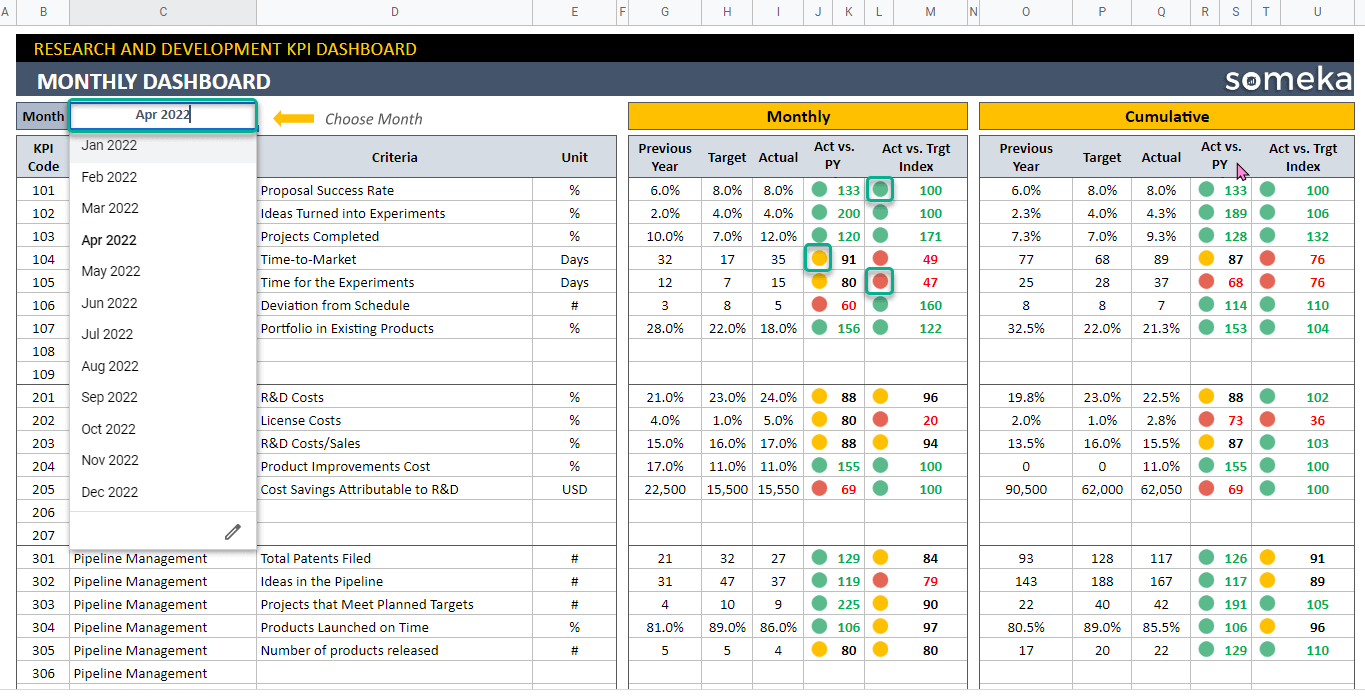
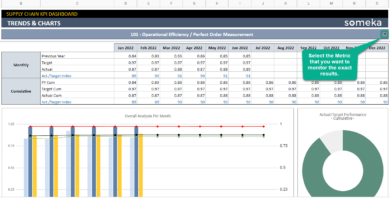
3. Analysis by Month: Here you can see a detailed summary of your overall analytics. By selecting the Month option, and the template will automatically display the results in color code and numbers.
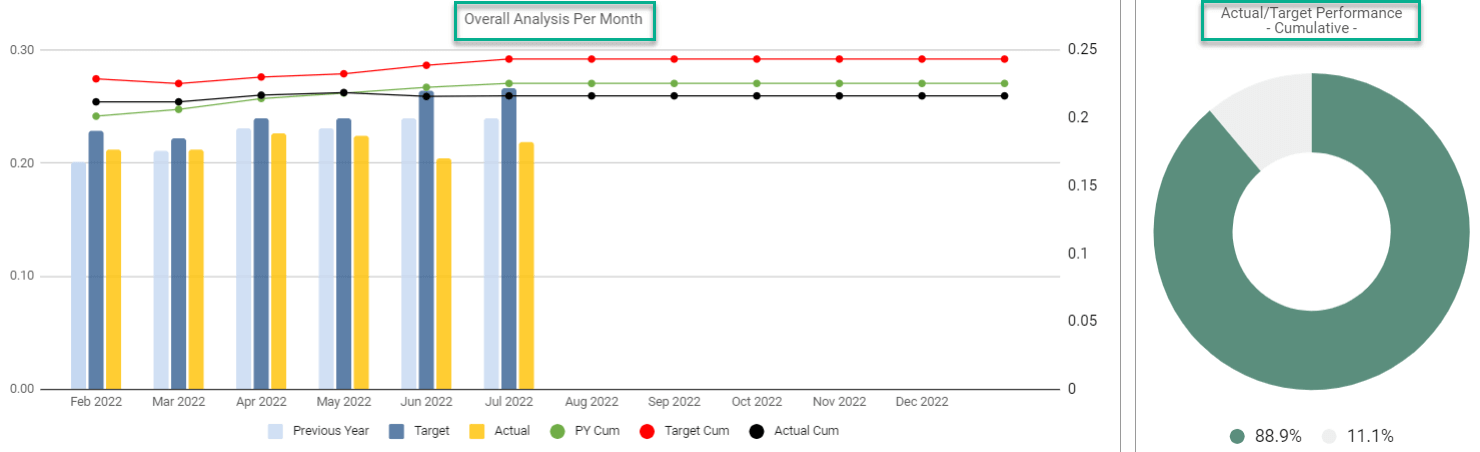
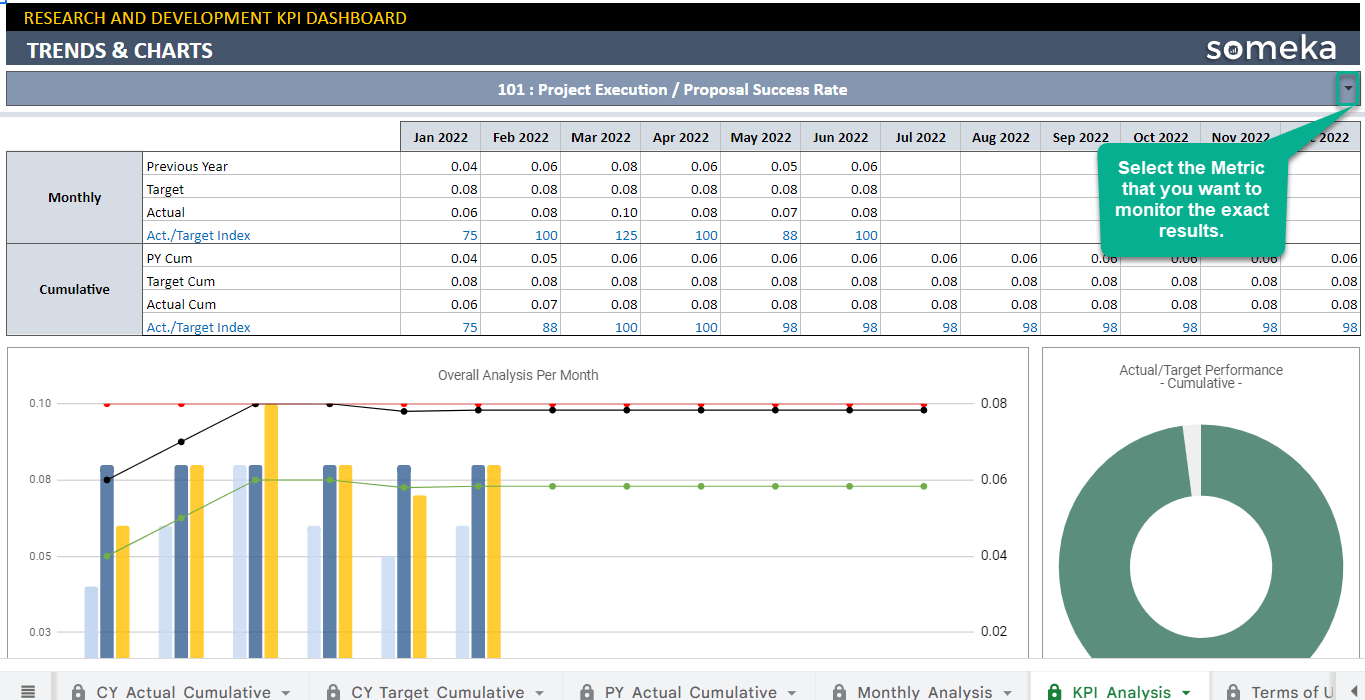
4. KPI Analysis: Last but not least, here you can see a detailed summary of your data in different chart types.
Meanwhile, all you need is an internet connection and a Google account to get started. And everything will be in sync!
Research and Development KPI Google Sheets Template Features Summary:
- KPI Dashboard in Google Sheets for Research & Development specialists
- Track and analyze metric in detail
- Track Progress against goals and competitor
- Use Monthly and Cumulative to monitor the monthly change of metrics
- Ready to Print template
- Informational notes included
- Ready to use template
- Works on any operating system
- Suitable for any device including mobile, tablet, desktop
GOOGLE SHEETS KPI DASHBOARDS COLLECTION
PRODUCT VIDEO
Watch the video below to see the template in action! Presentation also includes usage notes, explanations and tips & tricks about the template.
USER REVIEWS & COMMENTS
5 reviews for Research and Development KPI Google Sheets Template
You must be logged in to post a review.
RELATED TEMPLATES
-
 This product has multiple variants. The options may be chosen on the product page
Real Estate KPI Dashboard Google Sheets Template
$39.95 – $79.95Real estate agency KPI tracker in Google Sheets. Property management dashboard with monthly trend charts and analysis. Ready to present.
-
This product has multiple variants. The options may be chosen on the product page
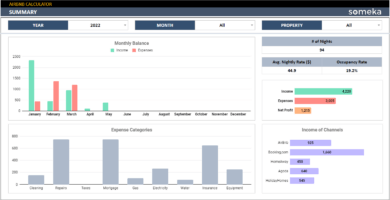
Airbnb Calculator Google Sheets Template
$34.95 – $69.95Income tracker in Google Sheets for AirBnb hosts. Track your daily bookings in dynamic dashboard. Easy-to-use tool with access from all devices.
-
This product has multiple variants. The options may be chosen on the product page
Supply Chain KPI Dashboard Google Sheets Template
$39.95 – $79.95Google Sheets KPI Dashboard for logistics. Track and analyze monthly performance metrics of your supply chain operations. Comparison charts included.
-
This product has multiple variants. The options may be chosen on the product page
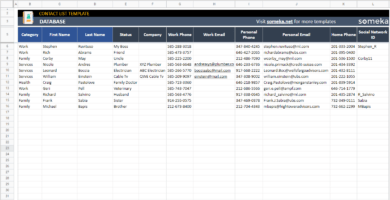
Contact List Google Sheets Template
$9.95 – $19.95Contact list template in Google Sheets. Keep all your customer data in one place. Printable, shareable, and editable online file with access from all devices.
-
This product has multiple variants. The options may be chosen on the product page
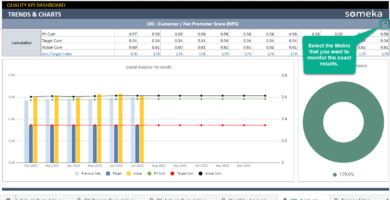
Quality KPI Dashboard Google Sheets Template
$39.95 – $79.95QA Dashboard in Google Sheets. Monitor your quality KPIs in all-in-one template. Visual dashboard and trend charts with access from any device.
-
This product has multiple variants. The options may be chosen on the product page
Marketing KPI Dashboard Google Sheets Template
$39.95 – $79.95Professional Marketing KPI dashboard in Google Sheets. Track goals and metrics for your marketing efforts. Ready for presentations and reports.


Christie –
How can I see on the charts of other KPIs? I can see only one KPI. Help!
Someka –
Hello Christie
You can choose which related KPIs you want to see. Please refer to the image below or watch the video on this page.

Hope this helps!
Ailish –
Reports with a low cost that are smart. The chart section is extremely useful in providing information about the real matter.
Dana W. –
I enjoy the template. I’d like to fetch this template as well, but I have a few questions before proceeding with the purchase. How can I add additional KPI metrics to this template?
Someka –
Hello Dana,
To begin, thank you very much for your kind words!
There are currently 26 different KPI metrics available. However, we left some blank rows in each category for our customers to fill in with their own KPI metrics. Please let us know if you have any further queries!
Ed –
I enjoy this templete and I would recommend it to anyone. Thx!!
Arnold Allen –
Great job, this product is useful and complete. But I am having problems to modify it How can I unlock file?
Someka –
Hello Arnold,

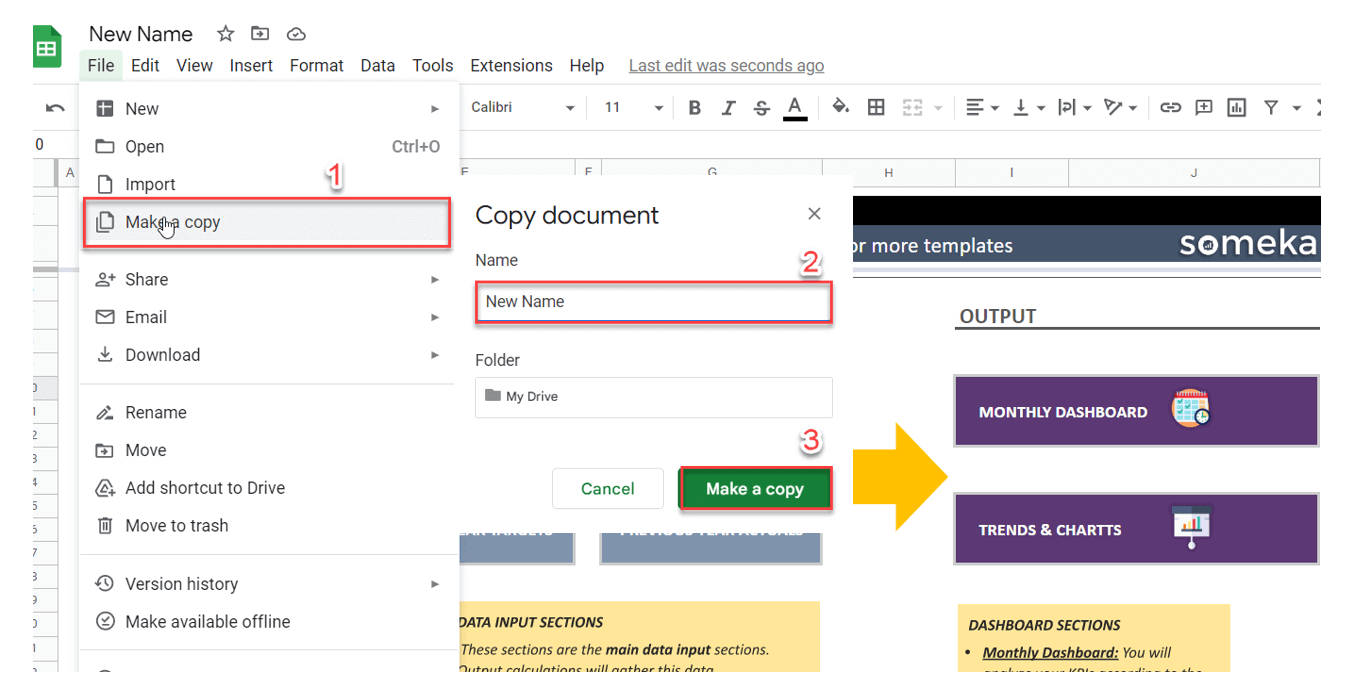
After making your copy of the Google Sheets ( or as shown below), you can customize it according to your needs. If you need to customize your template, our development team can help you, contact them via email at contact@someka.net and describe your needs.
Hope this helps!