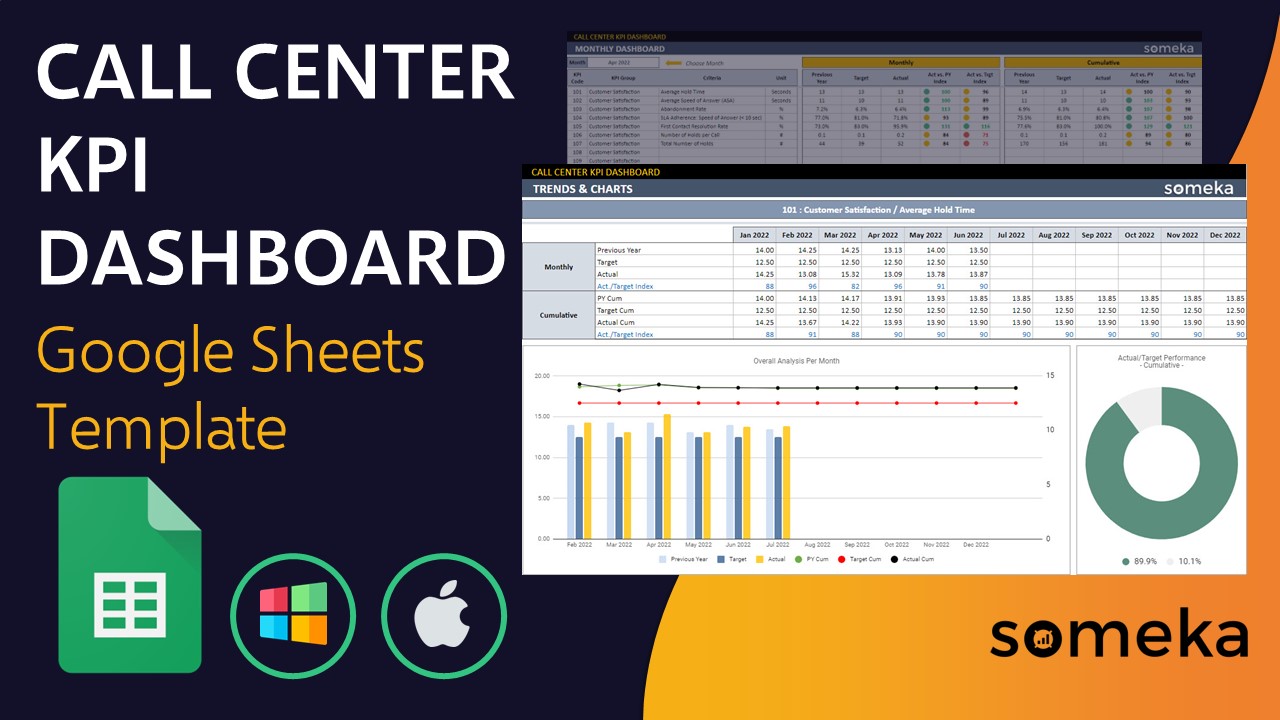
Call Center KPI Dashboard Google Sheets Template
Customer service KPI dashboard. Ready-to-use performance tracker for your call center team. Google Sheets template with access from all devices.


TEMPLATE DESCRIPTION
Do you struggle to manage your call center and customer service teams or telesales? Then, our Call Center KPI Dashboard Google Sheets Template is here to help your business. Managing a call center without the use of third-party apps has never been easier!
Above all, this Call Center Google Sheets Template includes a variety of measurements and data constructions, such as performance indicators, a chart displaying trends and target comparisons, and so on.

To clarify, the Contact Center KPI, allows you to see everything in one simple template. When you successfully enter your data into the template, it will display the appropriate metrics, allowing you to determine what you can do for your team. This template may also serve as a reference for your OKR (Objectives and Key Results) tracker in call center business.
What are the benefits of using the Call Center KPI Google Sheets Template?
- Integrating your team’s data into a single centralized dashboard
- Consistently obtaining analytical data
- Determine your team’s strengths and weaknesses
Benefits of Call Center KPI Reporting Template
1- Measuring Call Center Performance
Firstly, you can add the metrics that you want to see on your dashboard. Also, these metrics could include average hold time, abandonment rate, cost per call, and so on.
2- Customer Satisfaction Surveys
Secondly, you can include as many customer satisfaction criteria as you want to better understand your customers’ needs and desires. You can also learn how to improve your team’s performance so that they can meet their goals.
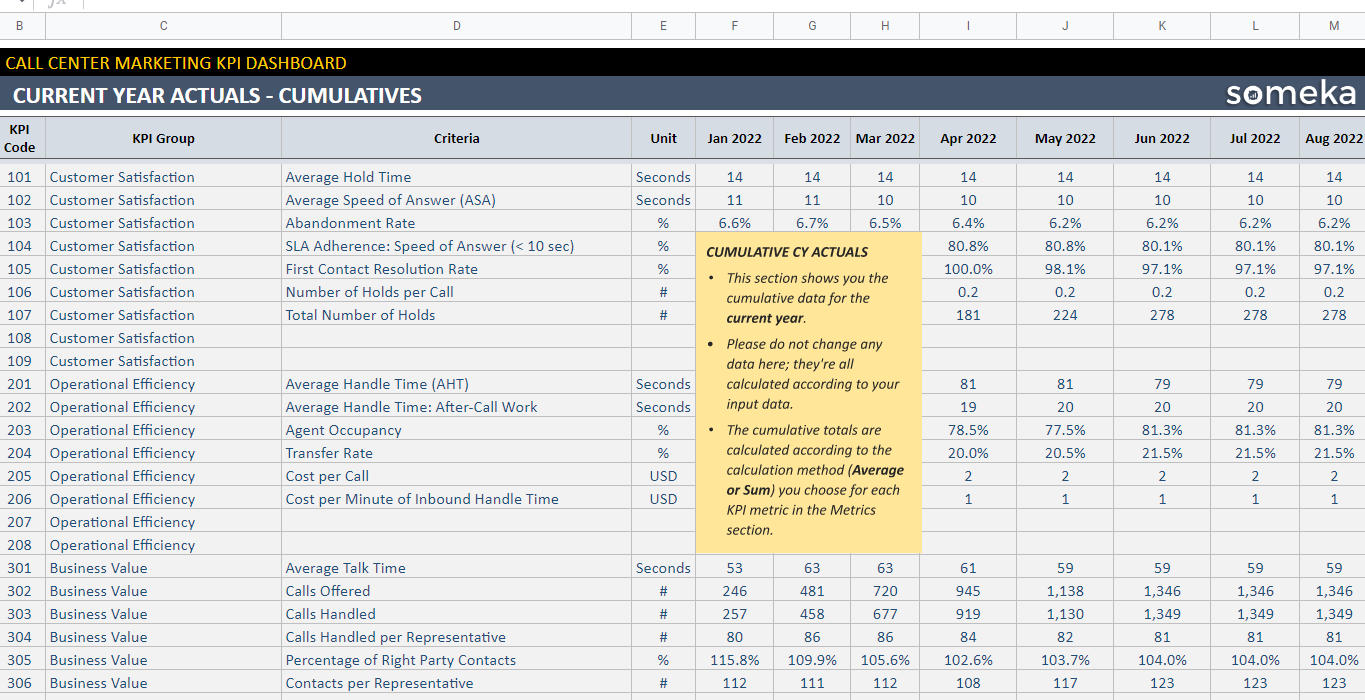
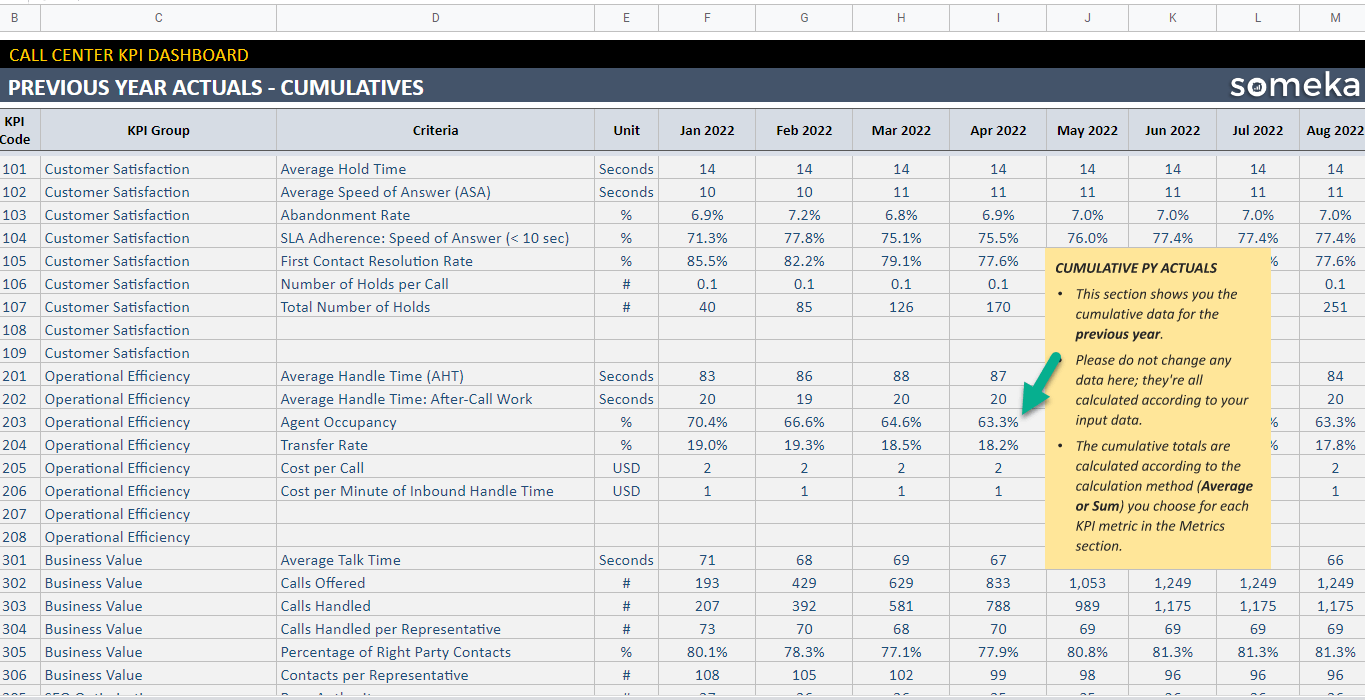
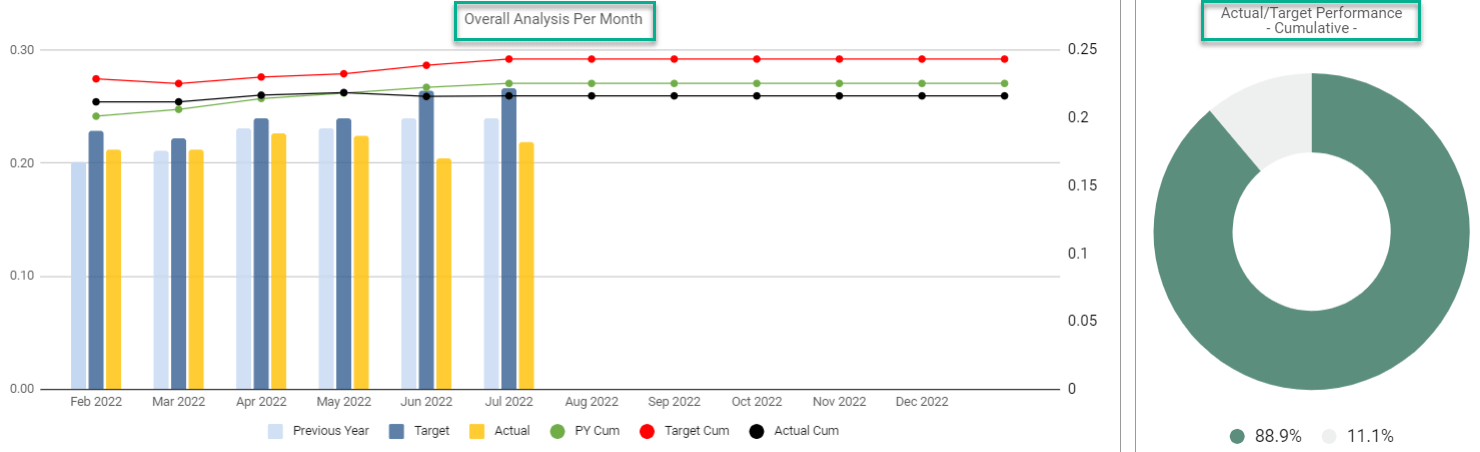
3- KPI Charts and Cumulative Calculations
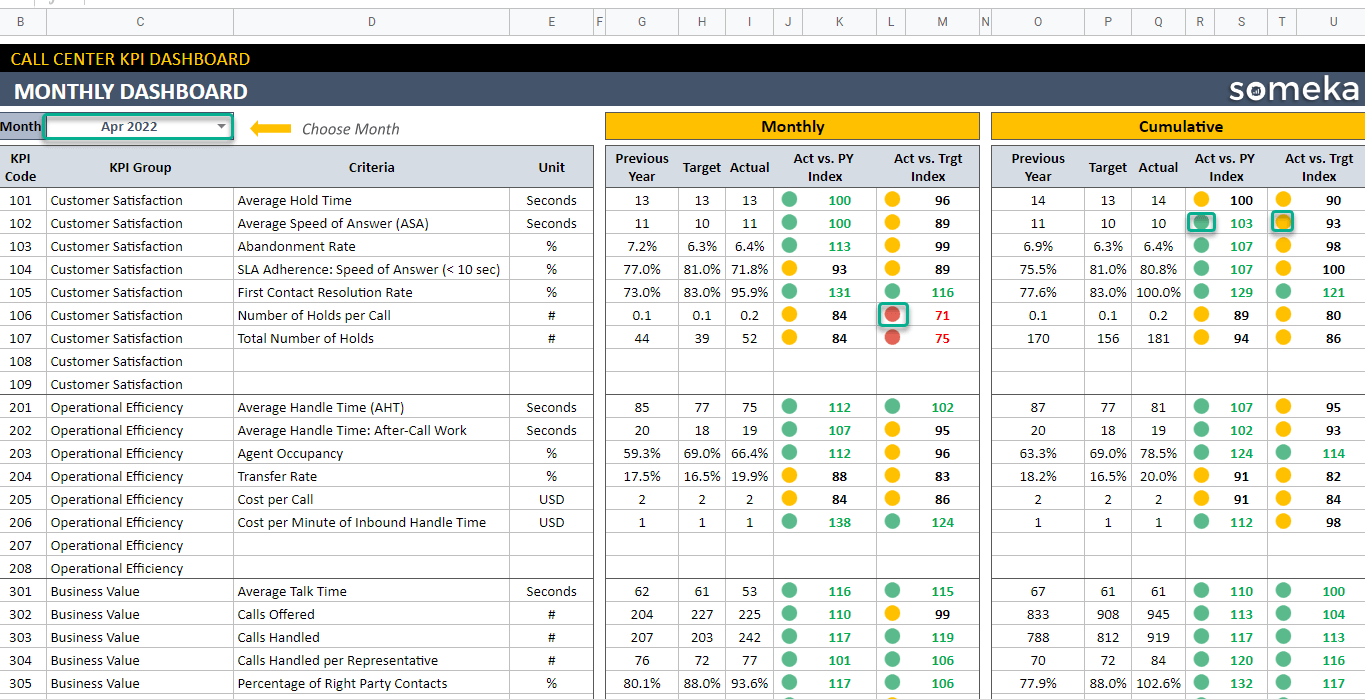
Thirdly, Cumulative calculations assist you in understanding precise statistics in order to set your goals and plan for the future of your business. KPI trends and charts compile all of the information you need for your call center business and display it on a single clear dashboard page.
4- Establish your KPI Goals and compare them with KPI Actuals
Lastly, you can examine the peak and low points of your business. Also, you can show your team clear goals by setting monthly and yearly targets. Sniper problem-solving can also help your team become more efficient.
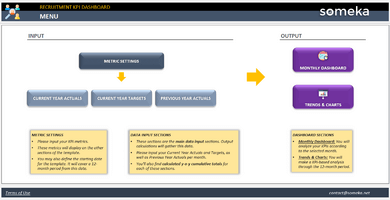
Sections of Call Center KPI Metrics Template
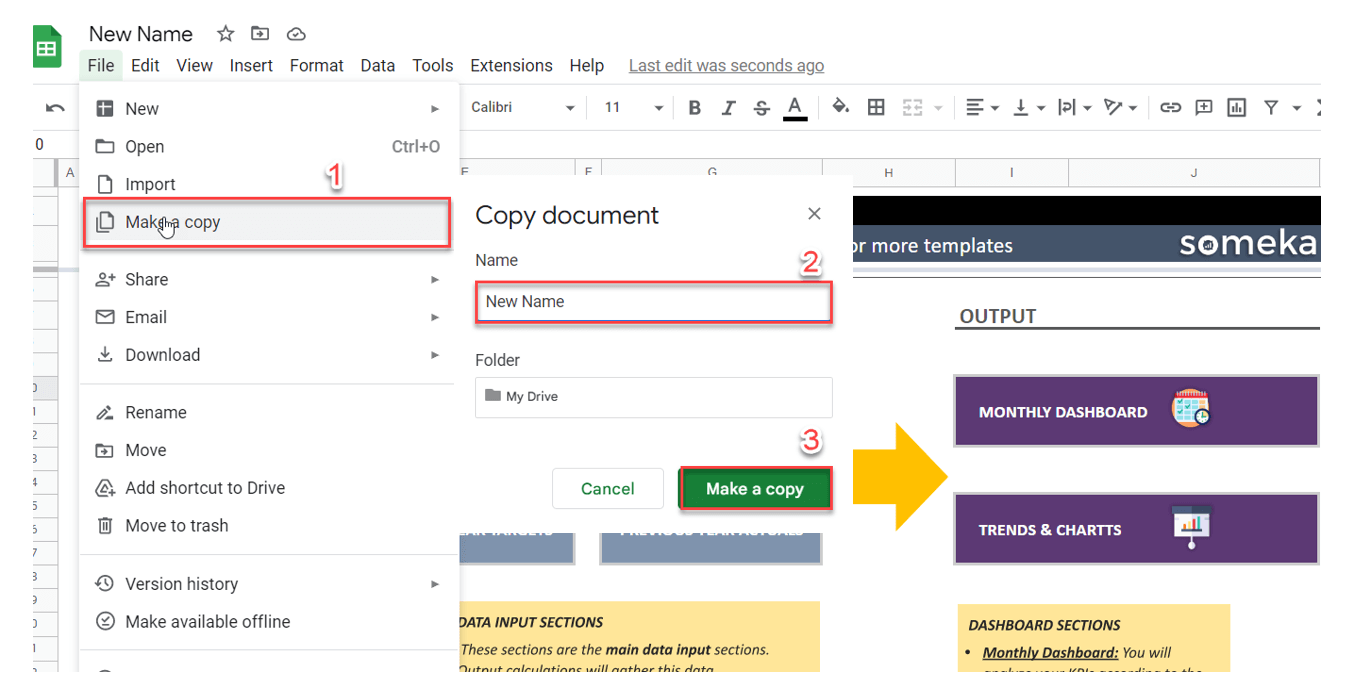
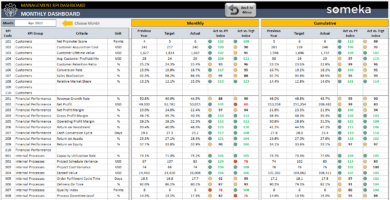
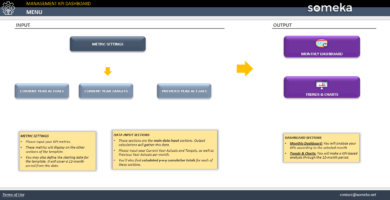
Basically, the template is divided into two sections: inputs and outputs. So, the current year actual, current year targets, and previous year actual are the inputs. The monthly dashboard and the trends and charts section are examples of outputs.
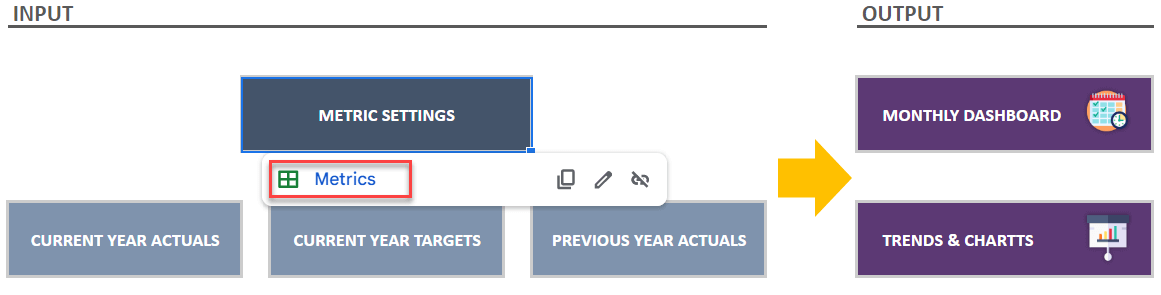
1. Navigation With a single click, the menu guides you to the sheets you require.
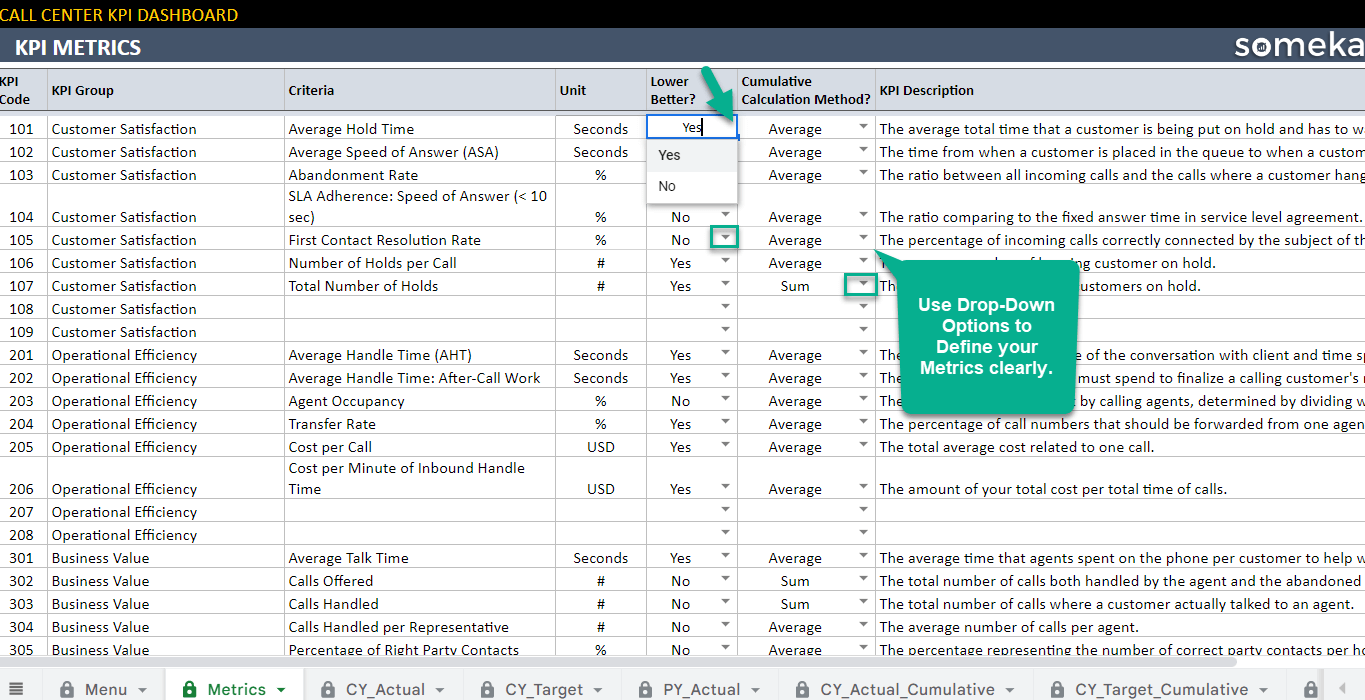
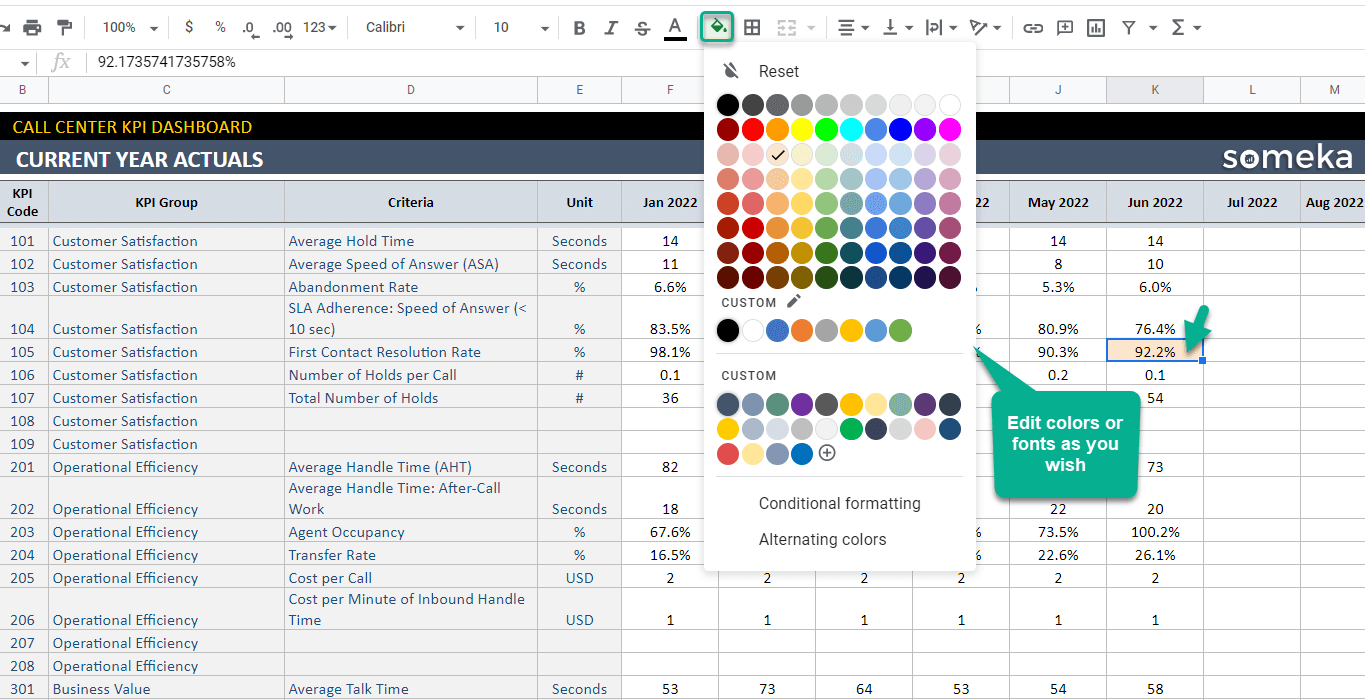
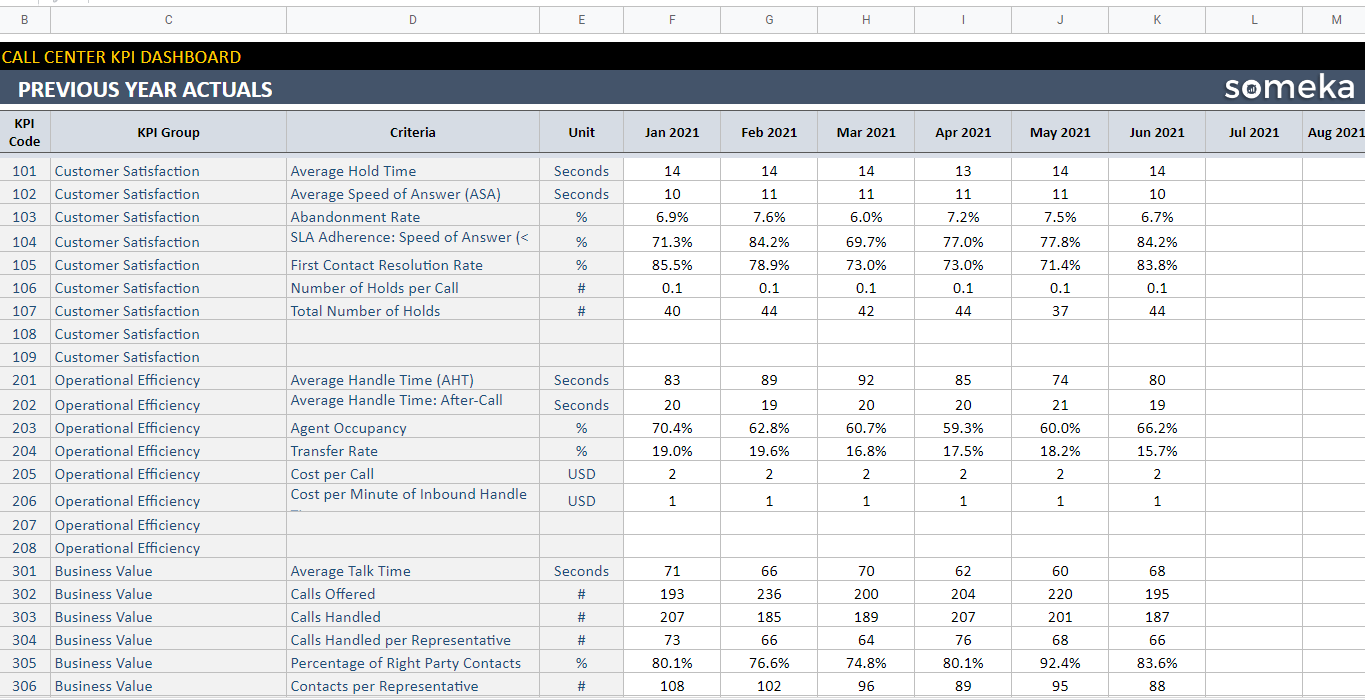
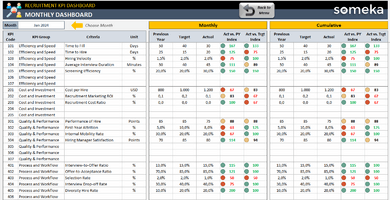
2. Metrics sheets enable you to enter criteria and information about your company and call center agent performance. Besides, you can compute them in seconds, percentages, or the currency of your choice.
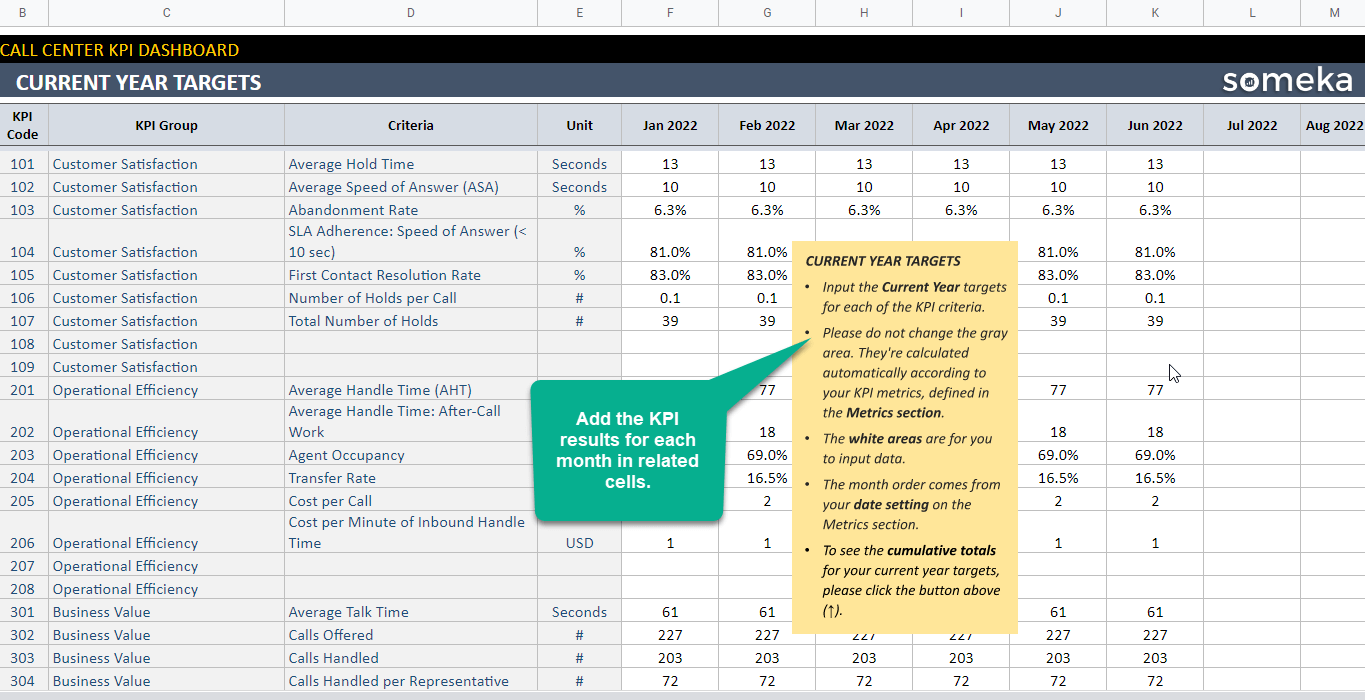
3. Current Year Actual and Target + Previous Year Actual: You add the results for each month in this sheet, and then the Call Center KPI Dashboard Google Sheets Template calculates the current year actual cumulative, current year target cumulative, and previous year actual cumulative.
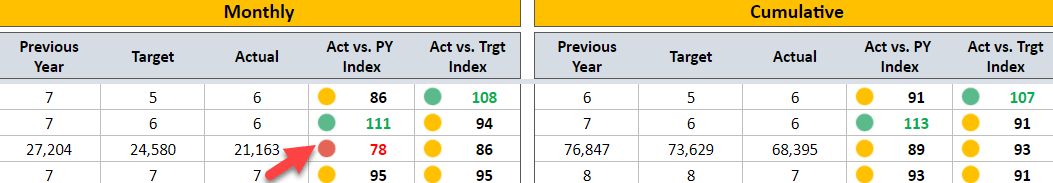
4. The Monthly Analysis sheet collects all the information you entered and displays every aspect of your business; you can also compare the months!
5. The KPI Analysis tab performs all calculations for each KPI you enter and integrates the data for the year month by month.
Meanwhile, all you need is an internet connection and a Google account to get started. And everything will be in sync!
Call Center KPI Dashboard Google Sheets Template Features Summary:
- Customer care center KPI tool in Google Sheets
- Including a specific unit for each KPI
- Monitoring the performance of each metric over time
- Ready to Print template
- Informational notes included
- No installation is needed, ready to use
- Works on any operating system
- Suitable for any device including mobile, tablet, desktop
GOOGLE SHEETS KPI DASHBOARDS COLLECTION
PRODUCT VIDEO
Watch the video below to see the template in action! Presentation also includes usage notes, explanations and tips & tricks about the template.
USER REVIEWS & COMMENTS
8 reviews for Call Center KPI Dashboard Google Sheets Template
You must be logged in to post a review.
RELATED TEMPLATES
-
 This product has multiple variants. The options may be chosen on the product page
Recruitment KPI Dashboard Excel Template
$39.95 – $79.95Recruitment KPI Template in Excel. Ready-to-use file. Track your hiring metrics with professional dashboards and trend analysis. No installation needed.
-
This product has multiple variants. The options may be chosen on the product page
Management KPI Dashboard Excel Template
$39.95 – $79.95Management KPI Dashboard in Excel. Includes most common metrics for supervisors. Editable & Printable. Ready for your presentations with dynamic charts.
-
This product has multiple variants. The options may be chosen on the product page
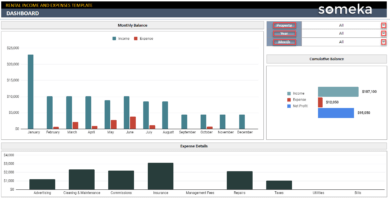
Rental Property Income and Expenses Google Sheets Template
$34.95 – $69.95A Google Sheets template for landlords. No more stress on the tax time. Simple yet powerful property management tool with access from all devices.
-
This product has multiple variants. The options may be chosen on the product page
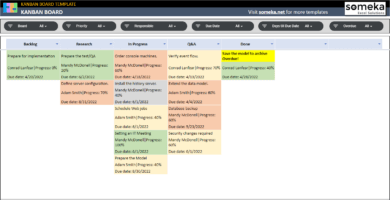
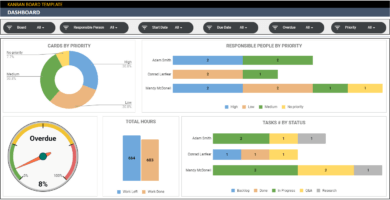
Kanban Board Google Sheets Template
$34.95 – $69.95A visual tool for managing agile and lean teams. Card-based workflow management with Kanban Board in Google Sheets. Access from all devices.
-
This product has multiple variants. The options may be chosen on the product page
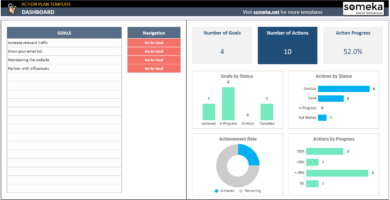
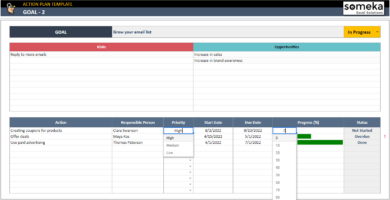
Action Plan Google Sheets Template
$29.95 – $59.95Action plan tracker in Google Sheets. List your goals, plan your actions and achieve them one by one. Ready-to-use. Access from all devices.
-
This product has multiple variants. The options may be chosen on the product page
Issue Tracker Google Sheets Template
$29.95 – $59.95Google Sheets template to track your issues. Printable dashboard to manage projects based on priority and status. Access from all devices.

Robert Valles –
Nice dashboard…Its going to save lot of effort in coming days!
EdnaW. –
As default great performance plan as I needed. Customization is complex a bit.
Aye Wright –
This is great tool, I thank you Someka
Chris Evanston –
Really nice dashboard… It will save a lot of time and work in the days ahead!
Feliza B. –
Some employees struggled to learn how to use it,then it was very handy!
Someka –
Hello Feliza

Thank you for your feedback.
Have you watched the video tutorial to learn more about the template?
You can watch it and get an overview of using the tool step by step.
If you have more questions after watching it, please get in touch with us via Livechat or Mail.
We’d be more than happy to clarify things for you.
Andre Martinez –
As the default great performance plan that I needed. Customizing is kinda challenging.
Steven Santana –
This is great tool, Thanls Someka!
Lulie Pettus –
Excellent and informative, but a little tricky to use; How can I select the kpi on charts?
Someka –
Hello Lulie,
You can easily switch between showing any KPI on the charts by clicking.
If you still have any further questions, please contact us: at contact@someka.net
I hope this helps!