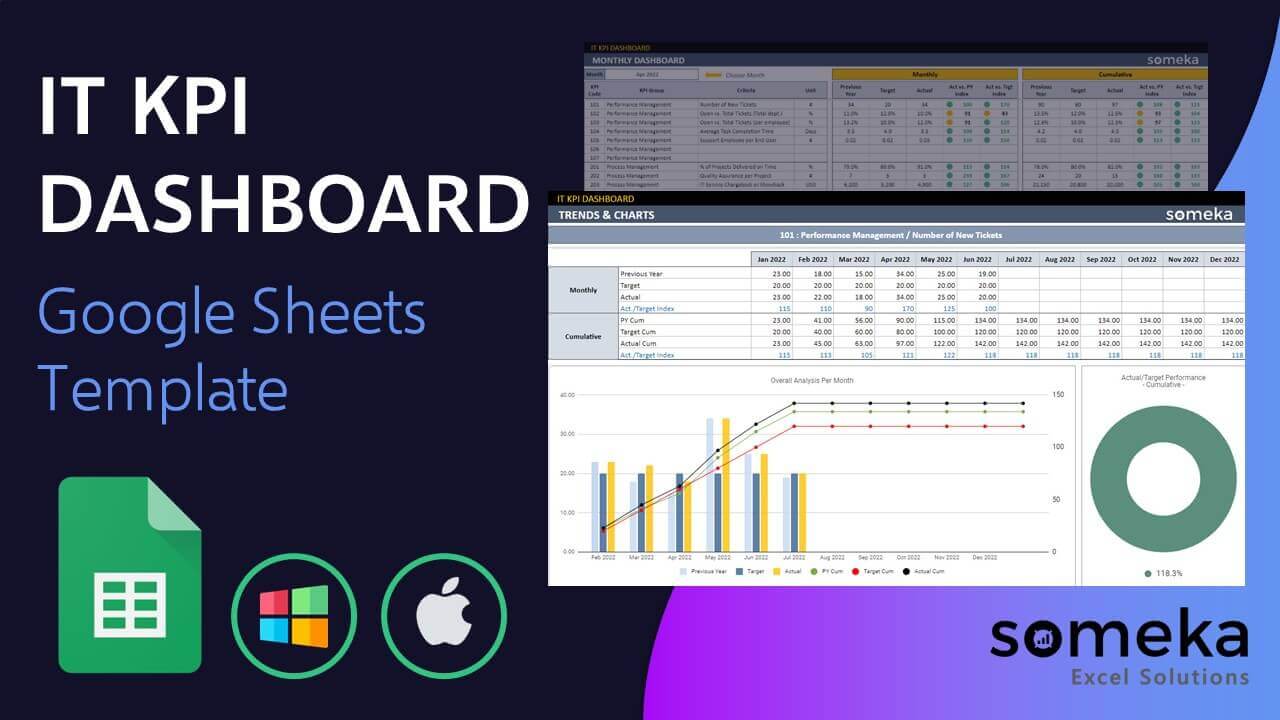
IT KPI Dashboard Google Sheets Template
IT Department KPI template in Google Sheets. Track key metrics for information technology in all-in-one tool. Printable trend charts included.

TEMPLATE DESCRIPTION
IT KPI Dashboard Google Sheets Template is an indispensable tool for any IT department. So, the layout of the sheet offers a way to track your key metrics in information technology with clear target-based and yearly comparisons.
Keeping track of your IT business will be a walk in the park with this Google Sheets. It allows IT managers, CIOs, IT departments and help desks you to track key metrics in information technology. You may also take this KPIs as a performance indicators for your OKR’s (Objectives and Key Results).

What is IT KPI dashboard?
An IT KPI dashboard is a very effective way to measure the performance of your IT in order to identify trends that may need attention. Also, KPIs are the most important metrics to measure, and they are divided into three categories:
- Quantitative metrics: These are numerical data that can be measured, such as utilization, failures, and latency.
- Qualitative metrics: These are information about the current state of your IT service, such as uptime and quality of customer service.
- Behavioral metrics: These describe how your customers behave on a day-to-day basis with respect to their interactions with the IT service.
Benefits of IT KPI Dashboard Google Sheets Template?
Above all, IT Key Performance Indicators are a powerful tool for understanding how to manage the performance of your IT initiatives. Also, it can provide you with information on the impact your projects will have on the organization as a whole.
It also provides a more unified view of all important performance indicators in one place, meaning that CIOs can keep track of their progress and understand the overall health of their organization.

Most common KPIs for IT
1- Percentage of systems that are up and running (Uptime):
Basically, IT departments are always striving to improve their performance and keep their systems running as smoothly as possible.
On the other hand, with so much on the line, it can be hard to track all of your key metrics in one place. That’s where an IT KPI Dashboard Google Sheets Template, comes in handy.
2- Mean time to resolution (MTTR):
You can keep track of how long it takes your team to resolve issues. As well as make yearly comparisons and trend charts.
3- Satisfaction Rates:
IT departments are responsible for ensuring that end users have a positive experience with the organization’s systems. So, by tracking changes in satisfaction ratings, you can identify areas of improvement and take steps to address them.
4- Percentage of tickets closed within target time frames:
It’s important for IT departments to close tickets in a timely manner in order to keep their system running smoothly. This metric lets you see how many tickets were closed within the target timeframe set by the organization.
Sections of IT KPI Dashboard Google Sheets Template
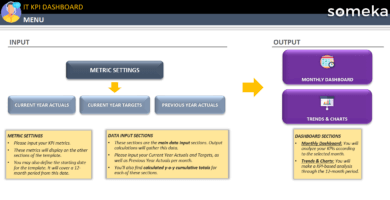
Basically, this template is split into two parts, input and output. In the first sheet, you can see the Navigation Menu, which is useful for transferring between sheets and getting an overall view of the template’s foundation. Let’s check other sheets in details:
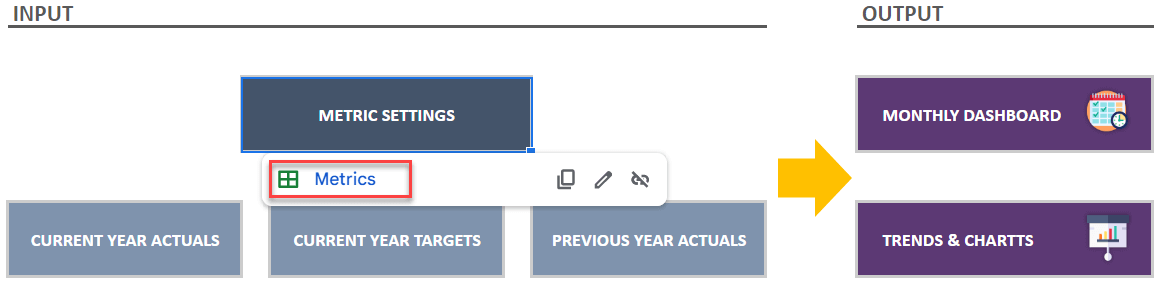
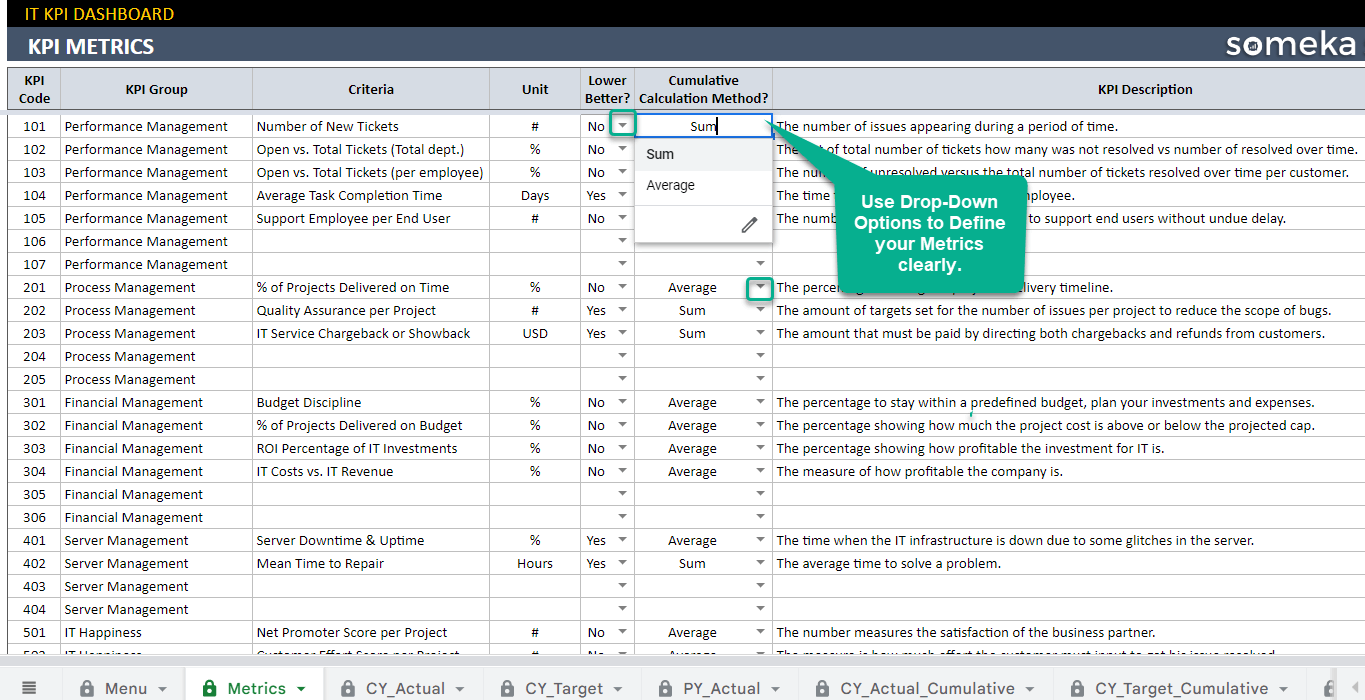
Defining Metrics:
Firstly, you can add your metrics here along with their category, unit, and even a brief description of each metric. This serves as the template’s basis. As a result, to more clearly define your objectives, always consult with your team, find out their opinions, and strive for extreme detail in this section.
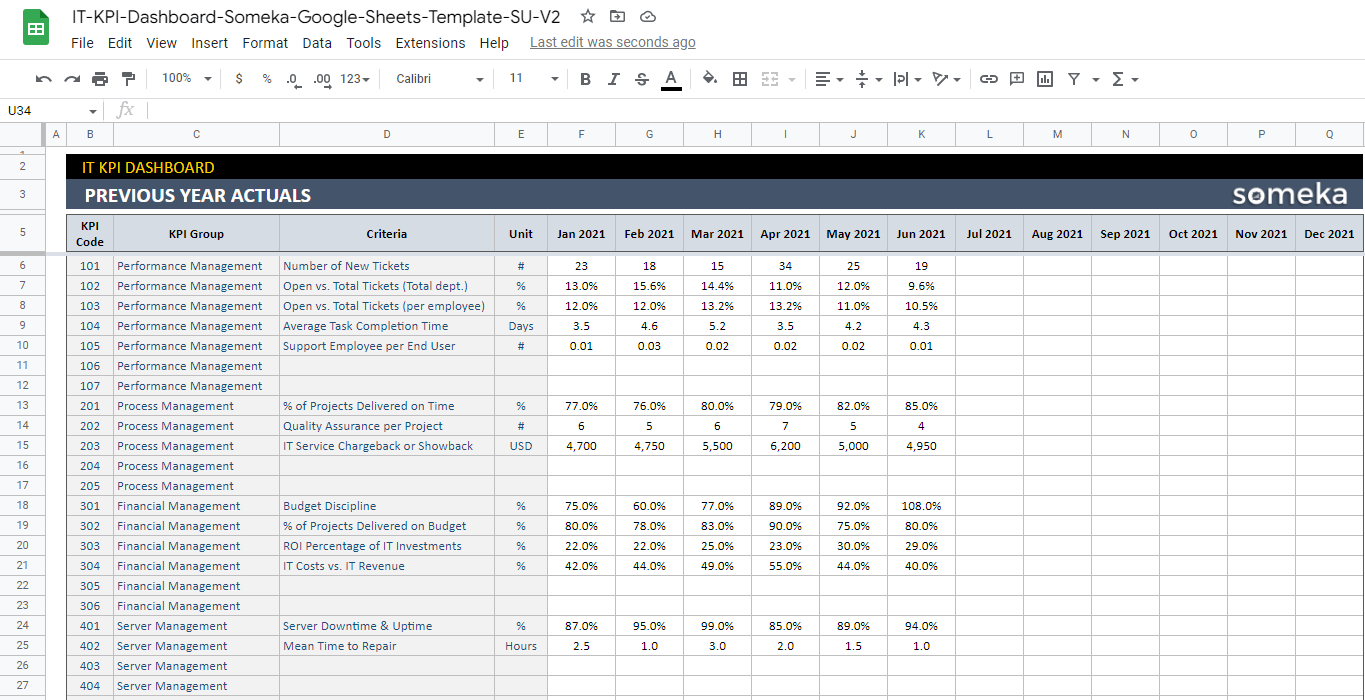
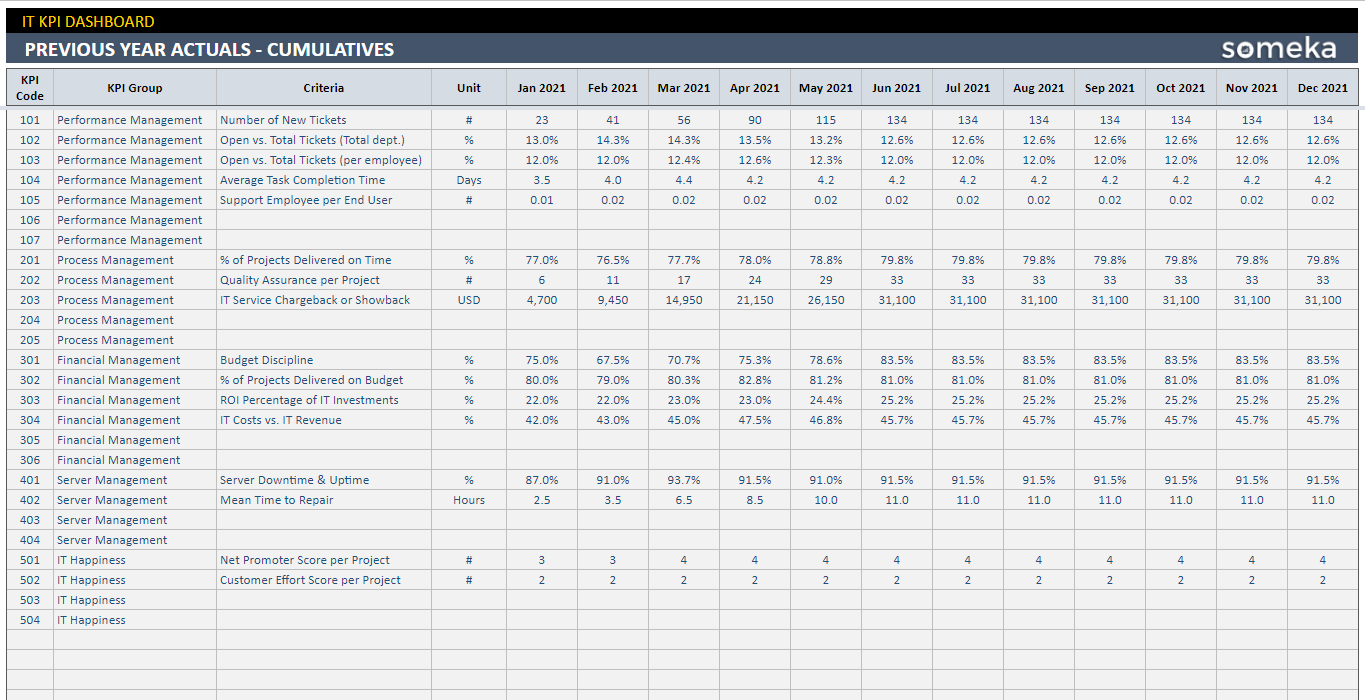
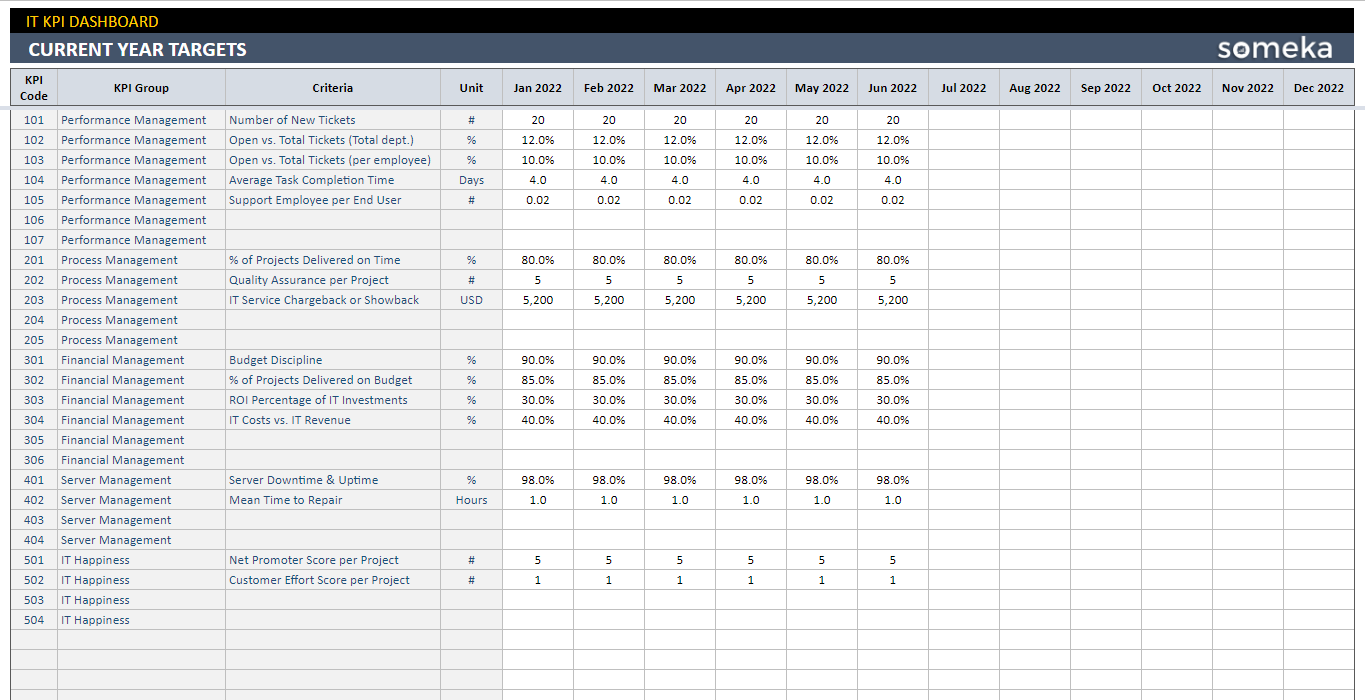
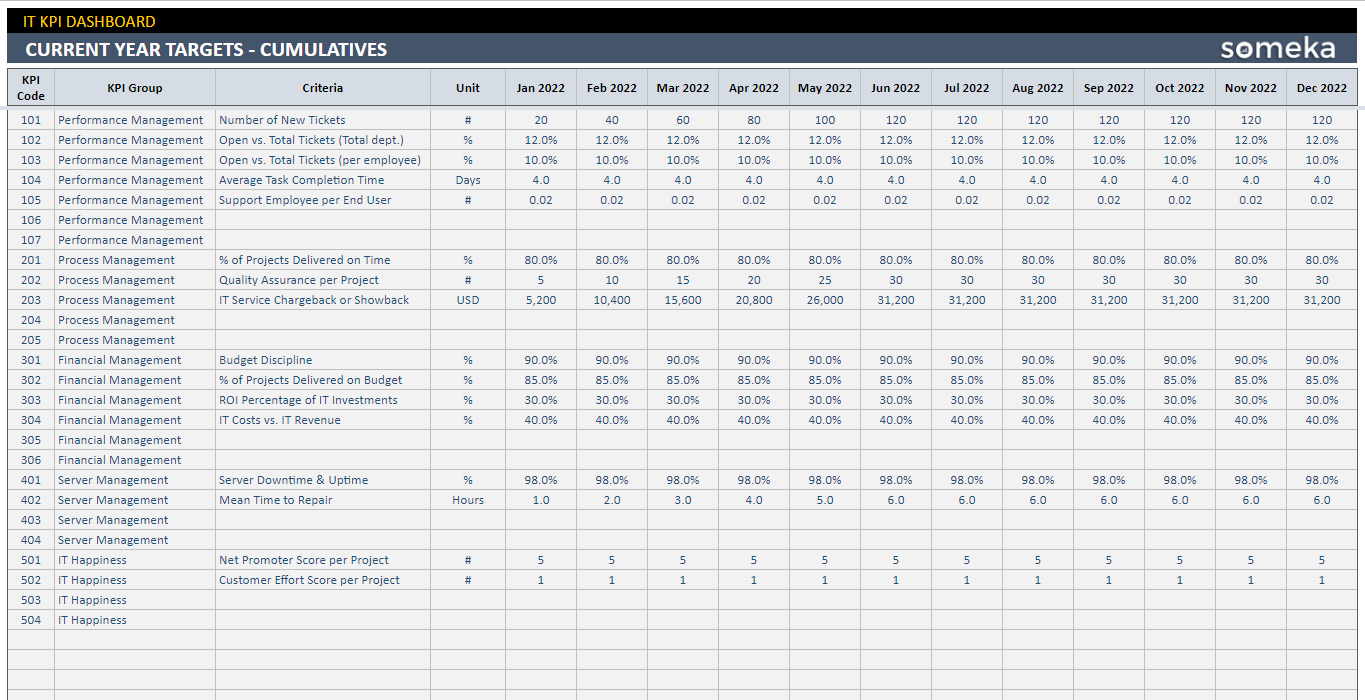
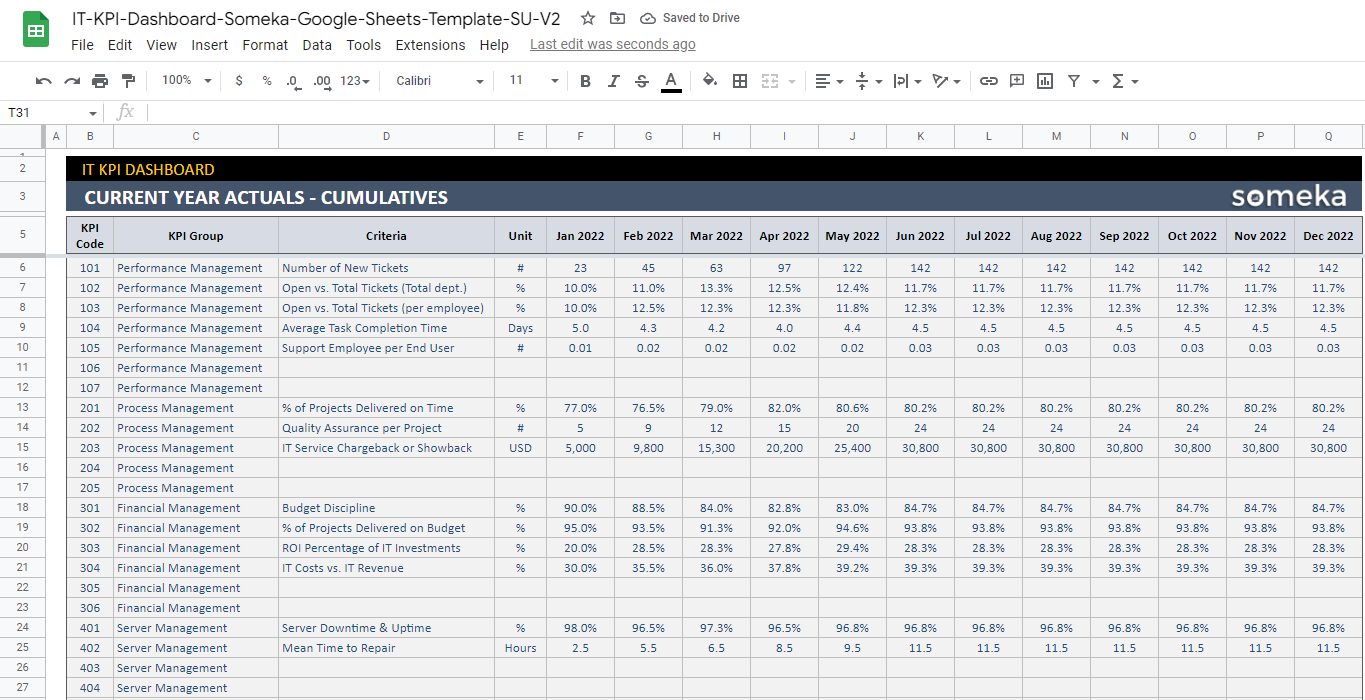
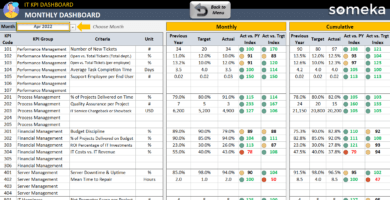
Actual and Target Values from the Current and Previous Years Actual:
Secondly, the KPI Dashboard Google Sheets Template calculates the current year actual cumulative, current year target cumulative, and previous year actual cumulative after you add the results for each month to the sheet.
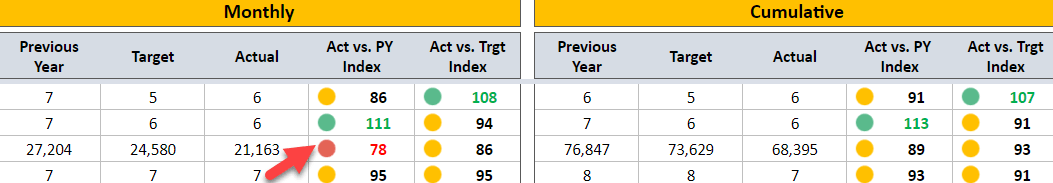
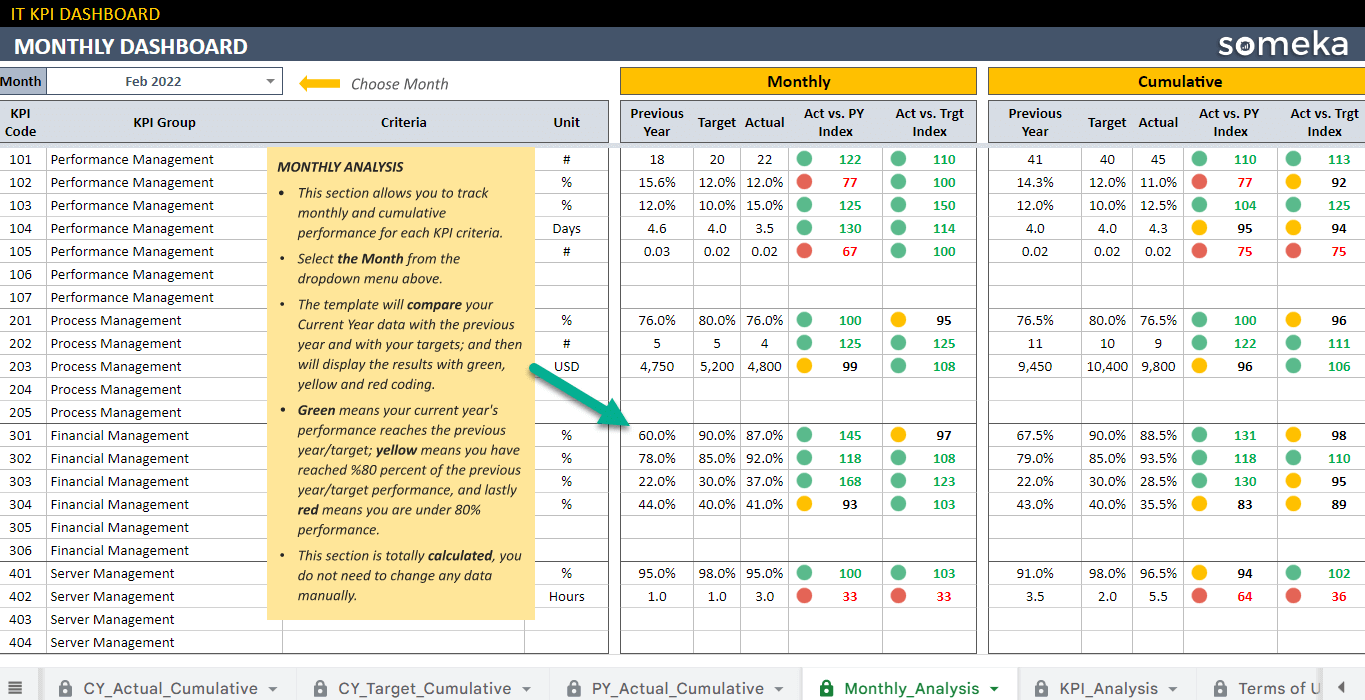
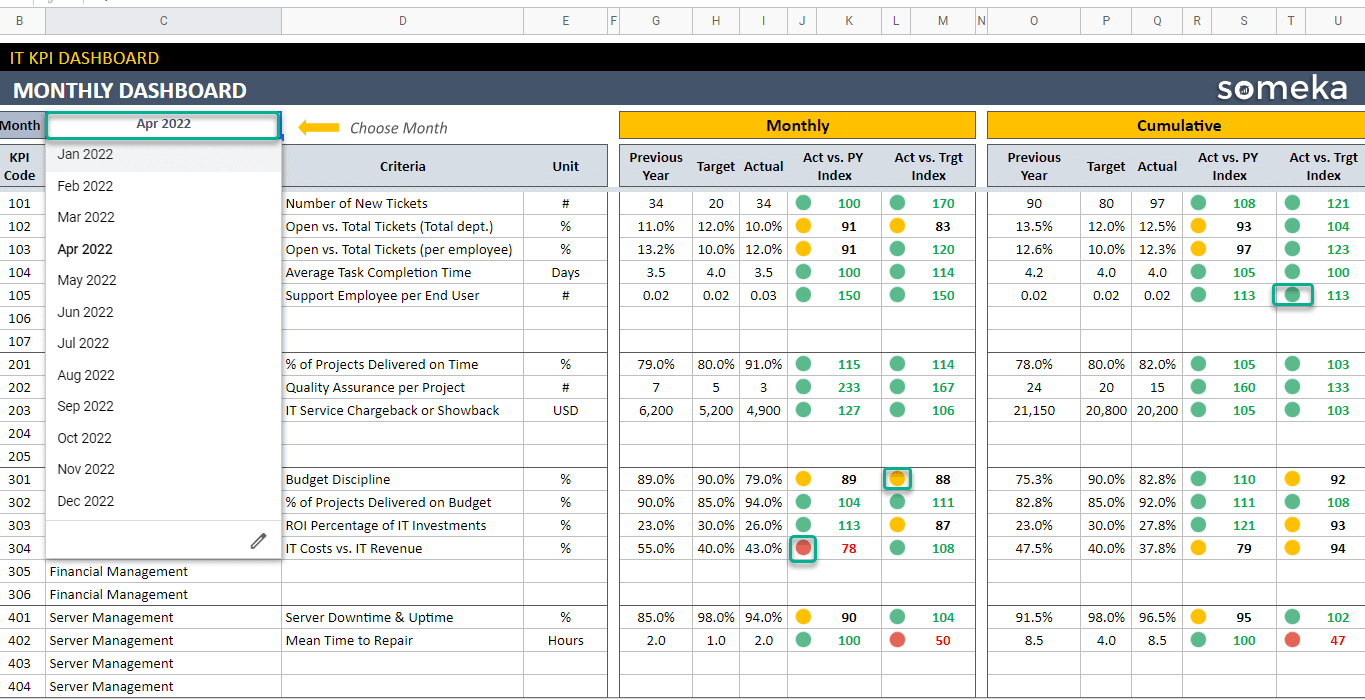
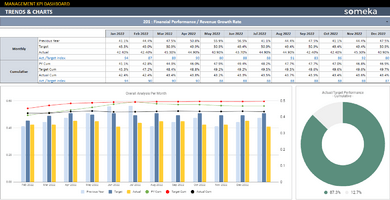
Monthly and Cumulative Analysis:
Select Month in this section to compare monthly and cumulative results. Make sure to pay attention to the red and yellow lights that indicate that your goals have not been reached.
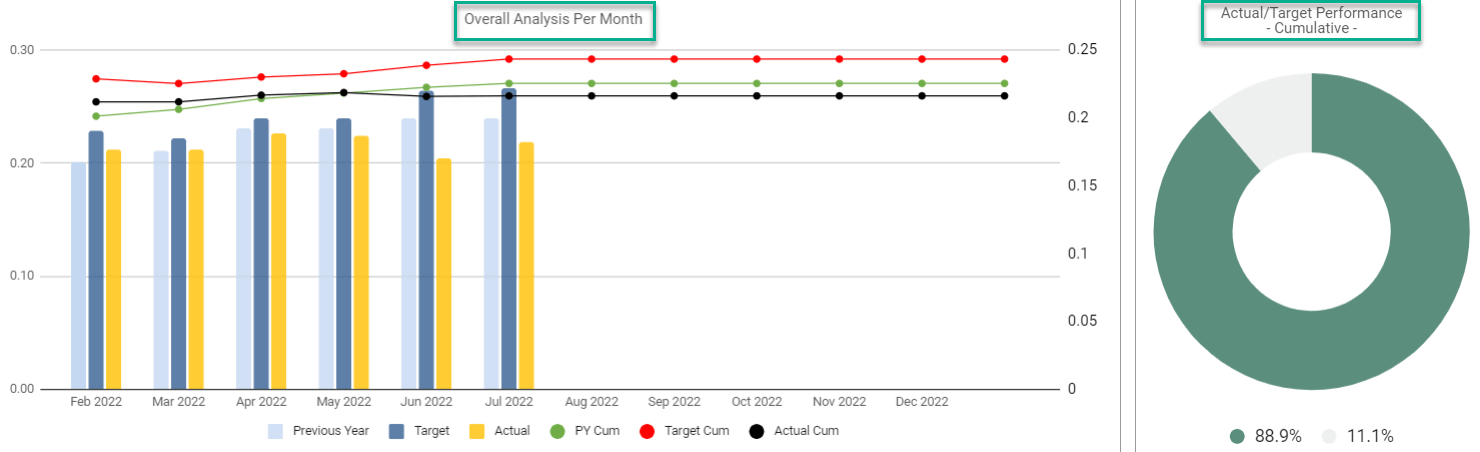
Trends and Charts:
Finally, here is an all-inclusive tool for managers who wish to display KPI and metrics results over time. Simply choose your KPI to gain access to 3 different types of charts.
Meanwhile, all you need is an internet connection and a Google account to get started. And everything will be in sync!
IT KPI Dashboard Google Sheets Template Features Summary:
- KPI Dashboard Google Sheets Template for IT teams
- Close more tickets on your backlog with this online tool
- Ready to Print template
- Informational notes included
- Ready to use template
- Works on any operating system
- Suitable for any device including mobile, tablet, desktop
GOOGLE SHEETS KPI DASHBOARDS COLLECTION
PRODUCT VIDEO
Watch the video below to see the template in action! Presentation also includes usage notes, explanations and tips & tricks about the template.
USER REVIEWS & COMMENTS
6 reviews for IT KPI Dashboard Google Sheets Template
You must be logged in to post a review.
RELATED TEMPLATES
-
 This product has multiple variants. The options may be chosen on the product page
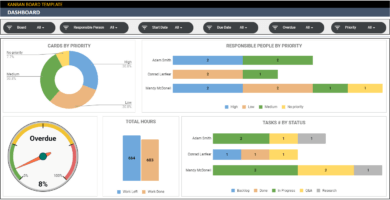
Kanban Board Google Sheets Template
$34.95 – $69.95A visual tool for managing agile and lean teams. Card-based workflow management with Kanban Board in Google Sheets. Access from all devices.
-
This product has multiple variants. The options may be chosen on the product page
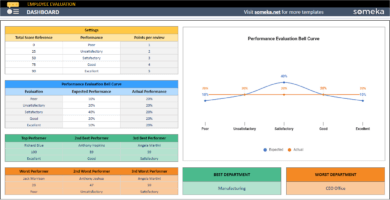
Employee Evaluation Google Sheets Template
$34.95 – $69.95Performance review tool in Google Sheets. Track employee progress with individual review forms. Printable HR dashboard. Access from all devices.
-
This product has multiple variants. The options may be chosen on the product page
Issue Tracker Google Sheets Template
$29.95 – $59.95Google Sheets template to track your issues. Printable dashboard to manage projects based on priority and status. Access from all devices.
-
This product has multiple variants. The options may be chosen on the product page
IT KPI Dashboard Excel Template
$39.95 – $79.95Excel spreadsheet for IT departments. Track your key metrics in information technology with target-based and yearly comparisons. Printable trend charts.
-
This product has multiple variants. The options may be chosen on the product page
Management KPI Dashboard Google Sheets Template
$39.95 – $79.95Online dashboard for Management KPIs. Summarize your key business metrics with trend charts. All in Google Sheets with access from all devices.
-
This product has multiple variants. The options may be chosen on the product page
Gap Analysis Google Sheets Template
$29.95 – $59.95Professional gap priority dashboard. Measure time, money, and labor to reach your goals. No installation needed. Access from all devices.


Charles Jonne –
Very clear information about the process. Really worthy!!
Harry Kochland –
I like having a real-time preview of the metrics I’m creating or updating.
Roxy –
Which kpis selected for this templte? How?! More details??
Someka –
Hello Roxy!
Thanks for the feedback! The KPI metrics we placed in the template are the most used ones in the industry. But you can change them according to your business. The automatic calculations will adapt themselves to the metrics you input.
Still, if you need more customization, please contact us: contact@someka.net
Lonnasi –
Superb additional tool1
Celeste Chamberly –
Enhance the quality of life for business presentations! Thnks someka
Zachery E. –
Hello there! This Dashboard seems to be useful and simple to use. Thx. Do you have some training?
Someka –
Hello Zachery,
Thank you very much for your nice comments and insightful feedback! In fact, we don’t currently have a training kit, but we can discuss it. Thank you for the suggestion!
For the time being, we have a product video that shows how to use the template and all of its features.