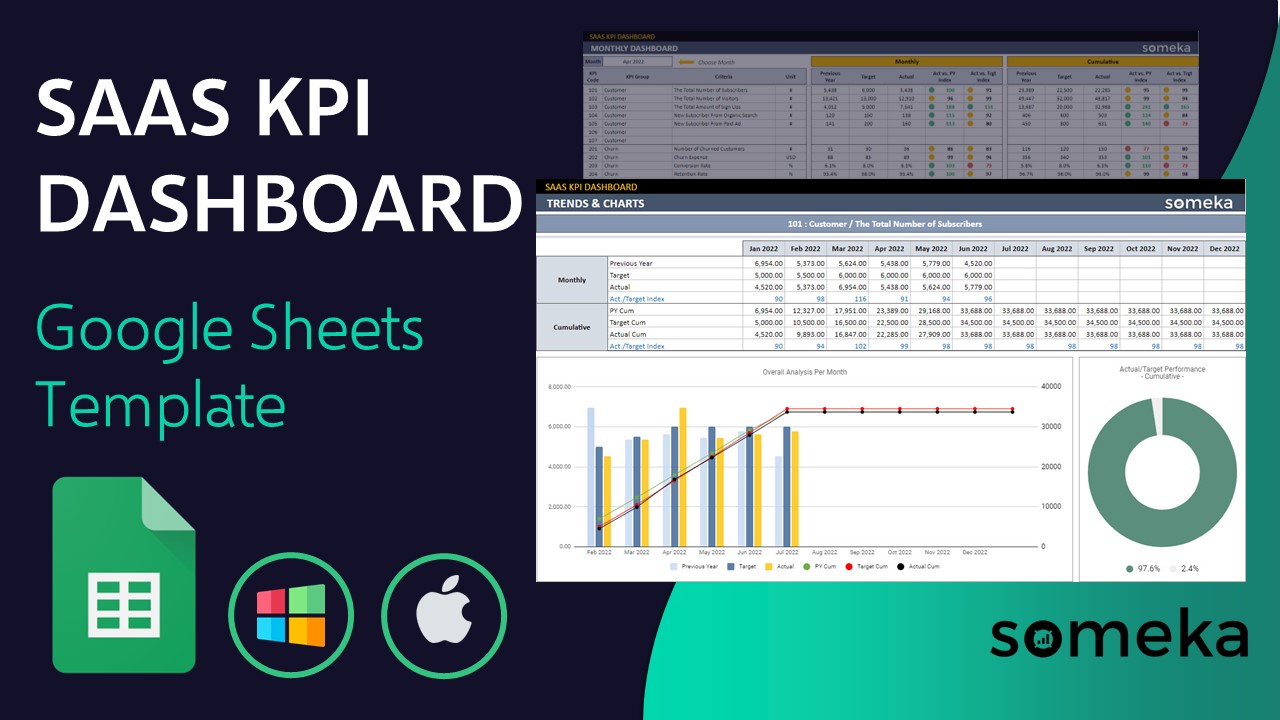
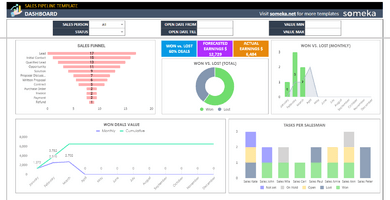
SaaS KPI Dashboard Google Sheets Template
KPI Dashboard for SaaS business. Track your key metrics with monthly comparisons. Ready-to-use Google Sheets template. Access from any device.
TEMPLATE DESCRIPTION
Starting a Software as a Service (SaaS) company is difficult. You must juggle different challenges that appear frequently while launching the service. So, here is SaaS KPI Dashboard Google Sheets Template for help! Track your SaaS KPIs in an all-in-one template.
Moreover, with so many roadblocks in the way, running a SaaS firm smoothly is a tall order. To clarify, the most difficult problem for SaaS companies is maintaining year-over-year growth. That’s why SaaS businesses should always track of KPI and also OKR (Objectives and Key Results) metrics for a sustainable business.

Also, because they are focused on staying on top of the current trends, sustaining SaaS growth is a difficult decision to make. But don’t worry; with the Someka Software as a Service KPI, you can include whatever measure you choose on your dashboard and constantly communicate your goals with your team.
Key performance indicators for SaaS business

Here are some very common metrics for your SaaS business:
- Conversion Rate: The purchasing rate of the item or service is known as a conversion rate. It is a crucial KPI for a digital company that wants to monitor orders and enhance them using user data.
- Client Lifetime Value (CLV): How much does a client cost during their lifetime? One of the most crucial SaaS business metrics to pay attention to is this one.
- Lead Velocity Rate (LVR): The potential for future income is something that SaaS business executives need to consider in their Saas KPI Dashboard Google Sheets Template. LVR is a statistic that measures the increase of quality leads for your company.
Furthermore, this Google Sheets Template for Saas KPIs allows you to add new metrics based on your specific requirements.
Sections of Saas KPI Dashboard Google Sheets Template
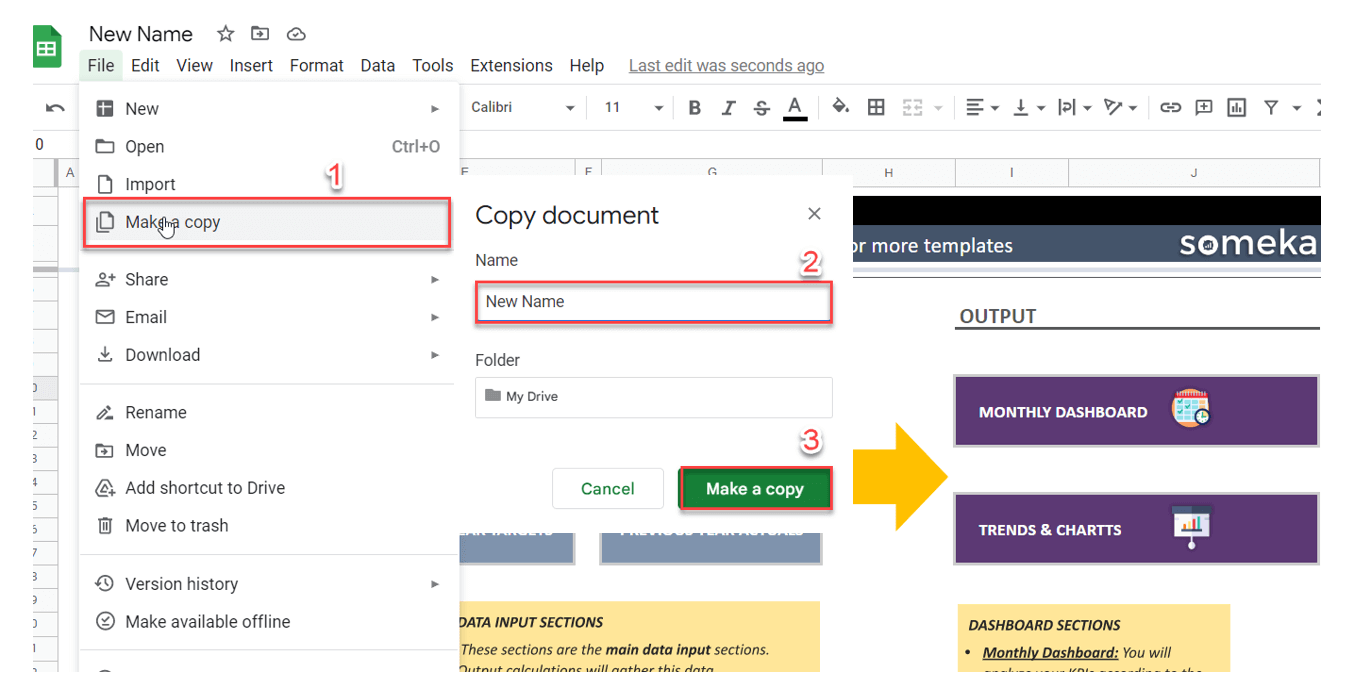
Basically, this template is split into two parts, input and output. In the first sheet, you can see the Navigation Menu, which is useful for transferring between sheets and getting an overall view of the template’s foundation. Let’s check other sheets in details:
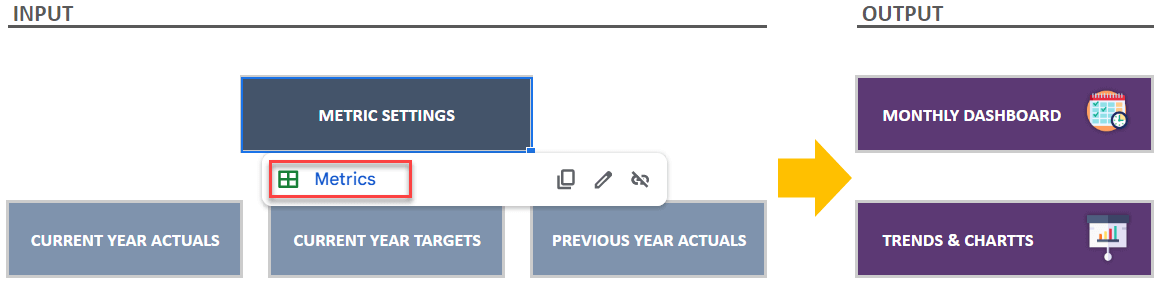
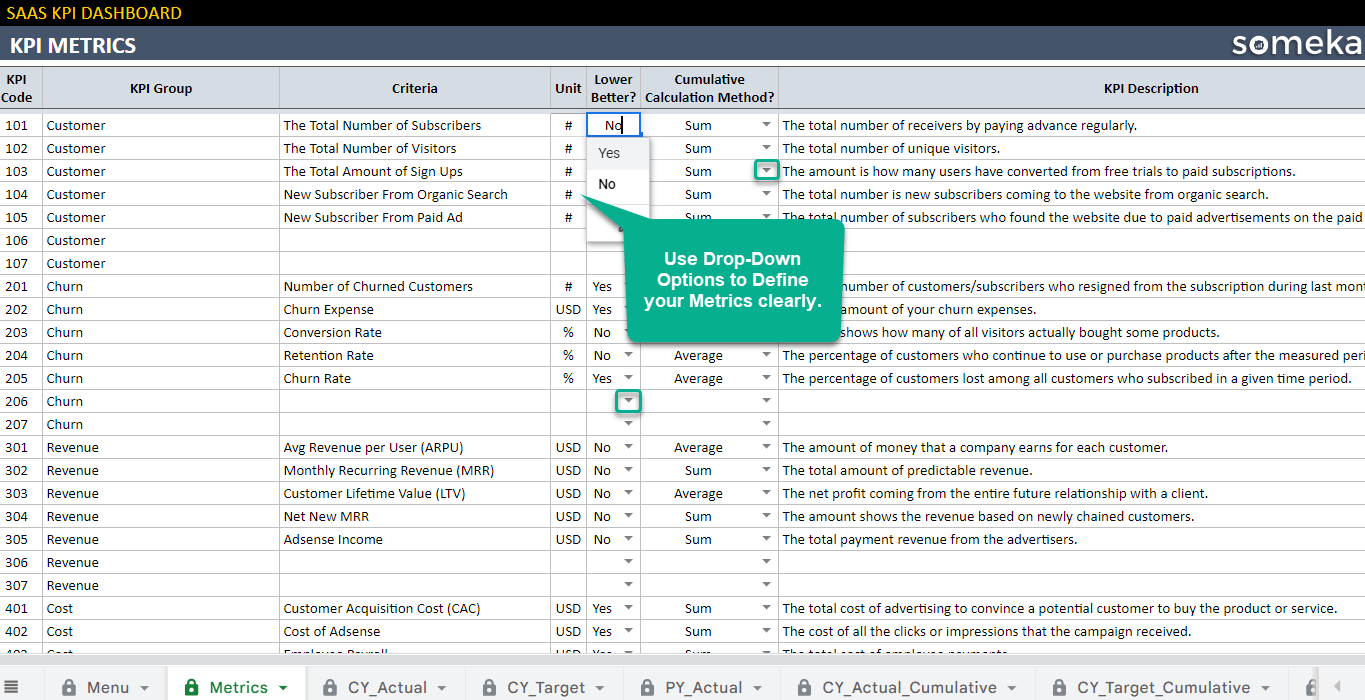
1-Defining Metrics:
Firstly, you can add your metrics here along with their category, unit, and even a brief description of each metric. This serves as the template’s basis. As a result, to more clearly define your objectives, always consult with your team, find out their opinions, and strive for extreme detail in this section.
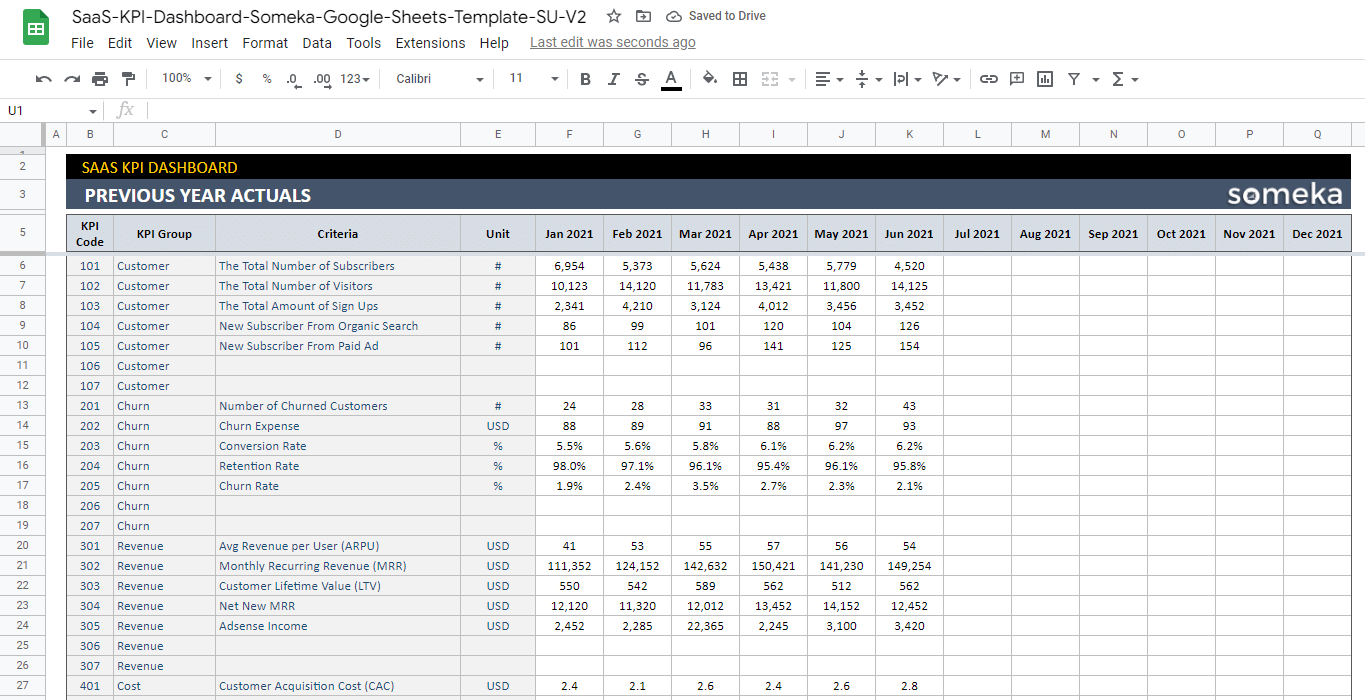
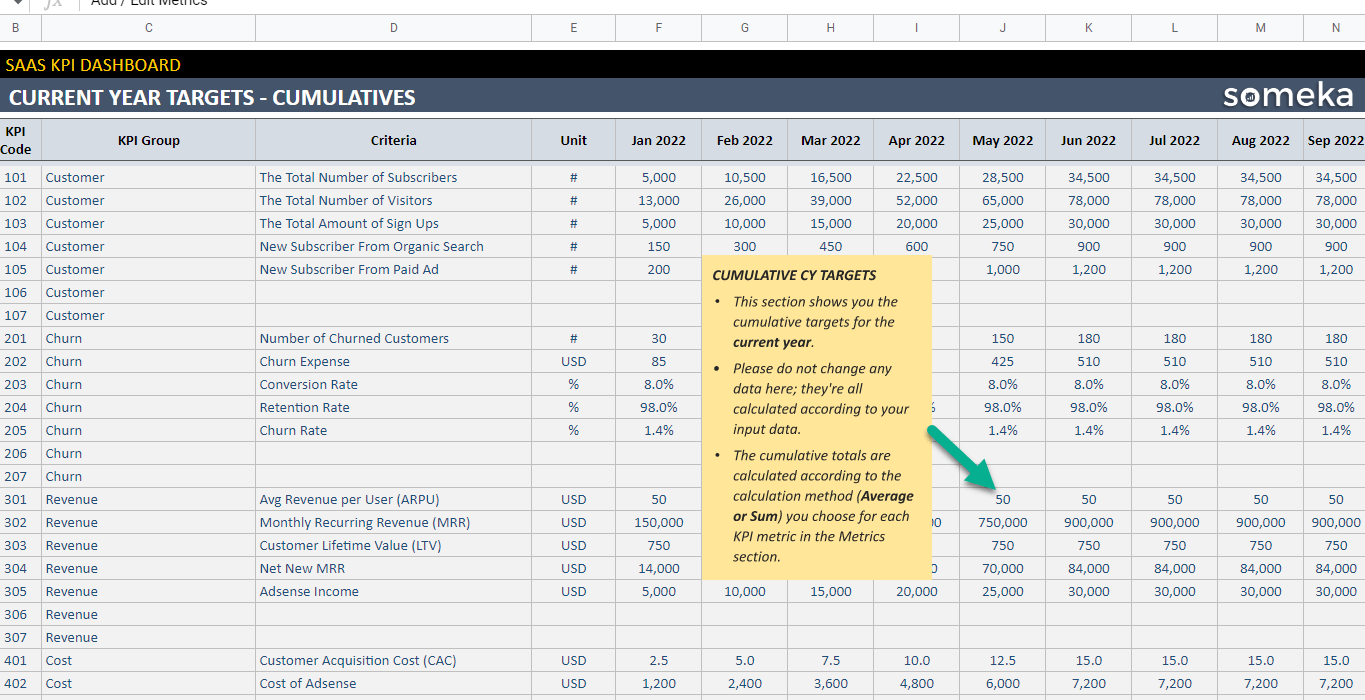
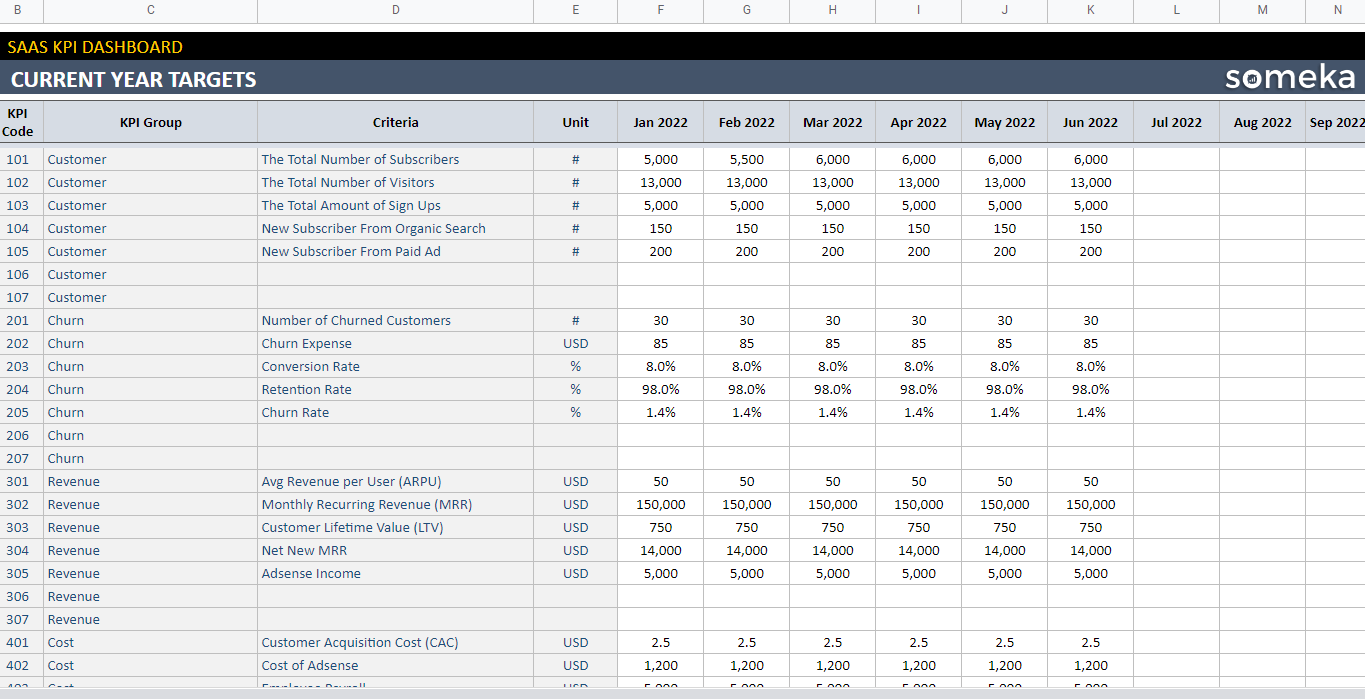
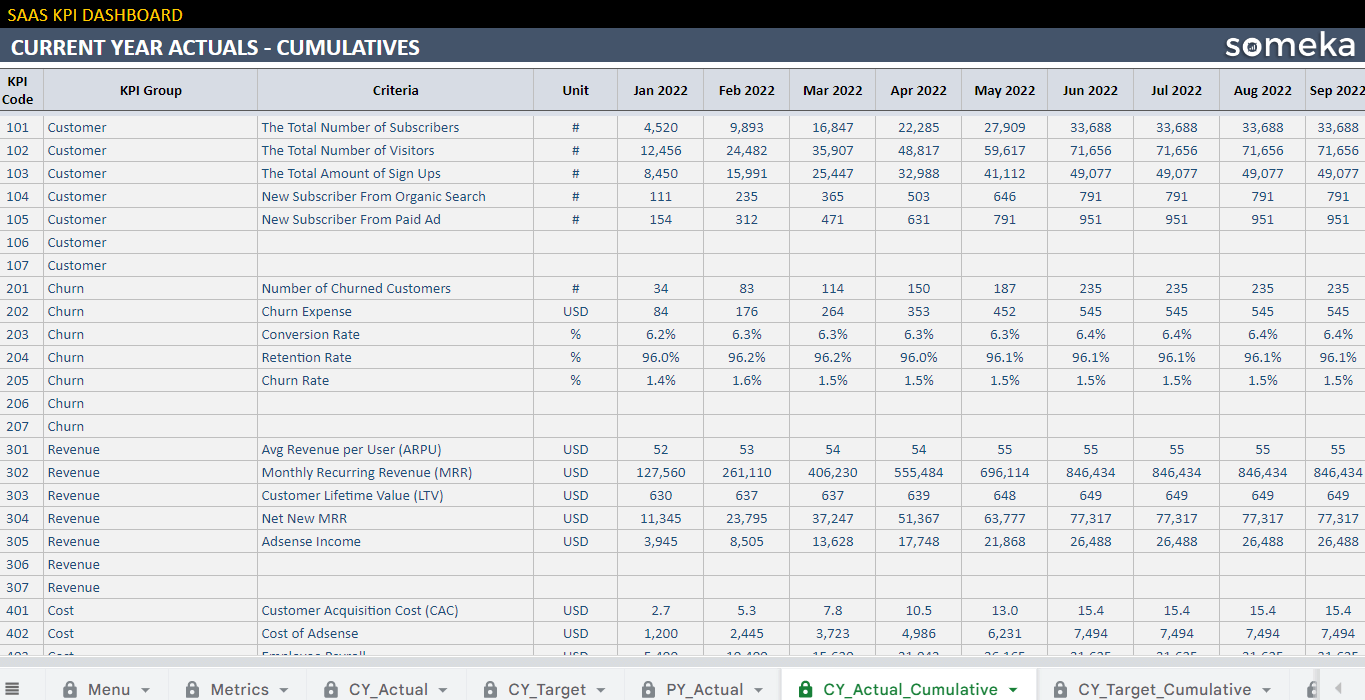
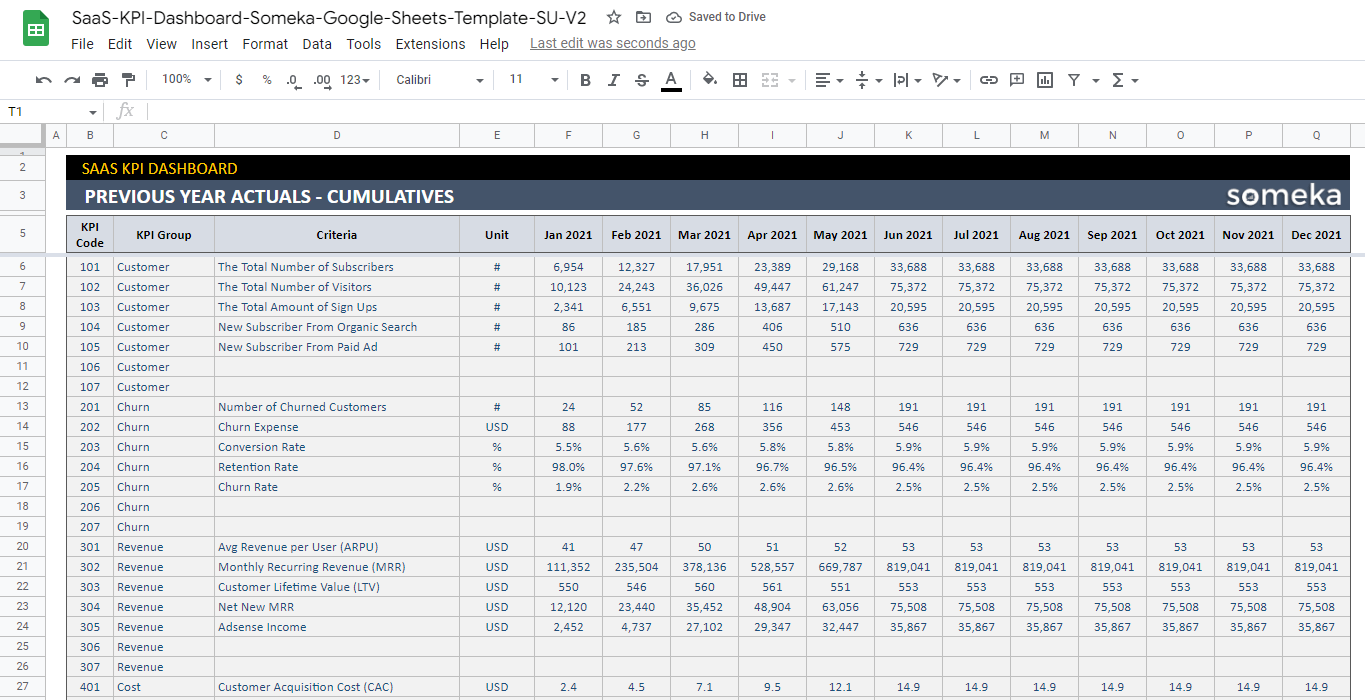
2- Actual and Target Values from the Current and Previous Years Actual:
Secondly, the SaaS KPI Dashboard Google Sheets Template calculates the current year actual cumulative, current year target cumulative, and previous year actual cumulative after you add the results for each month to the sheet.
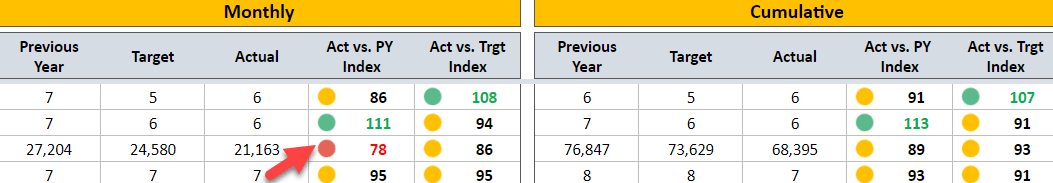
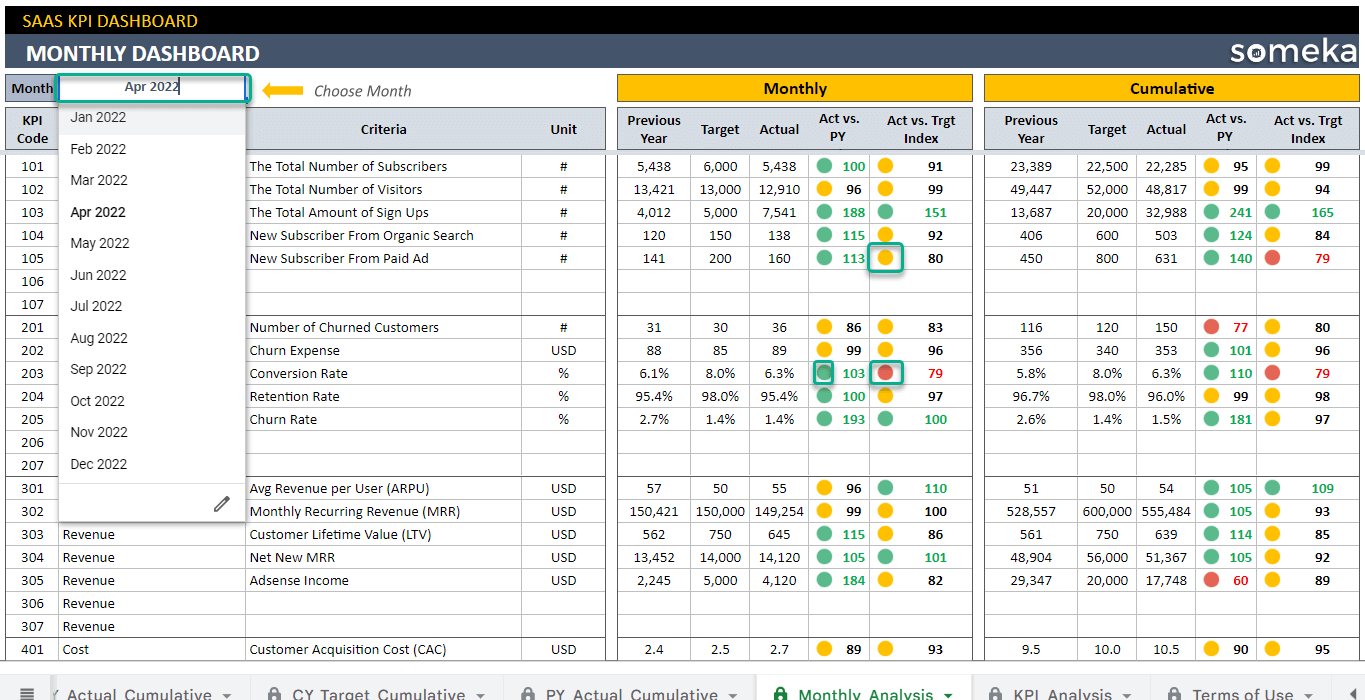
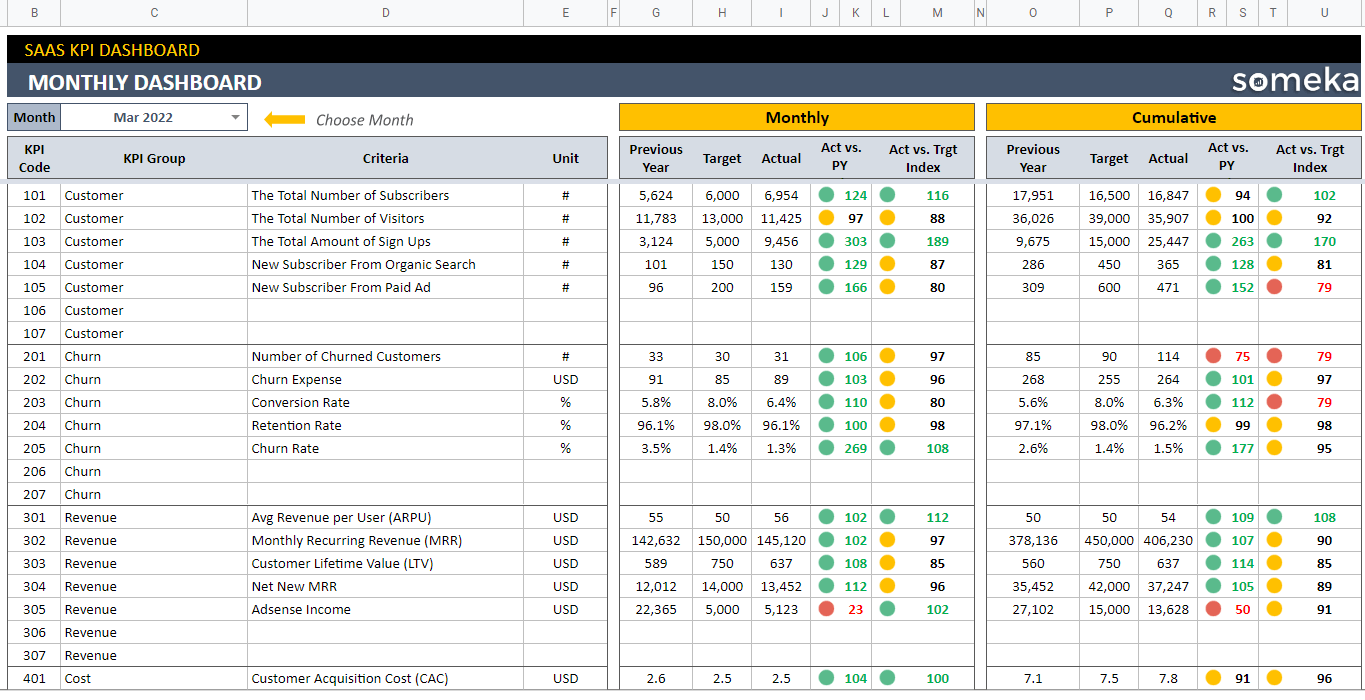
3- Monthly Analysis:
Select Month in this section to compare monthly and cumulative results. So, make sure to pay attention to the red and yellow lights because they indicate you were not performing well in those metrics.
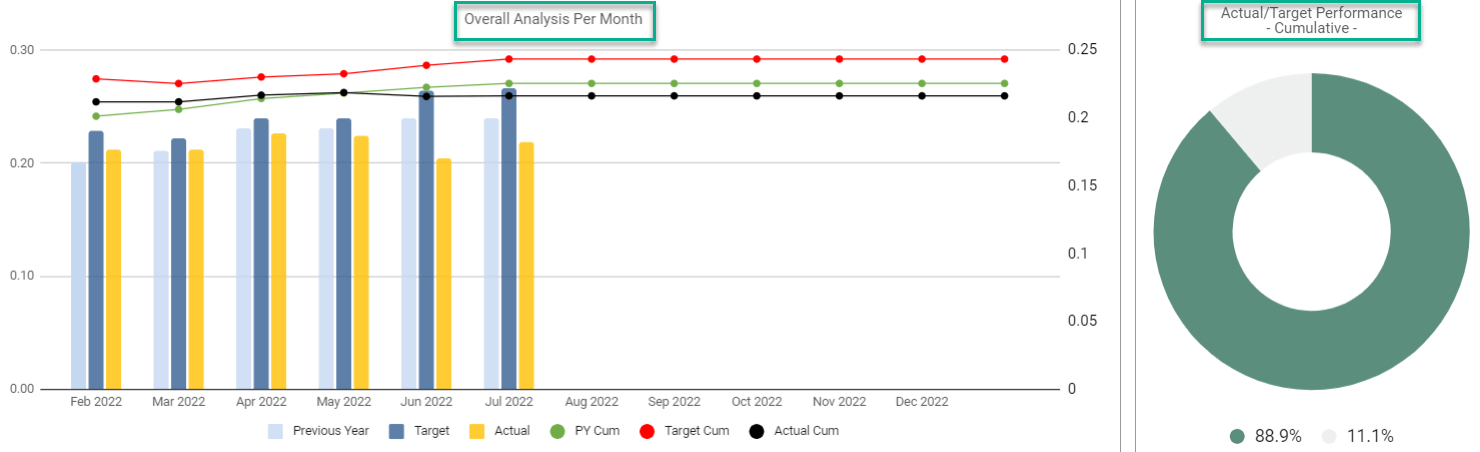
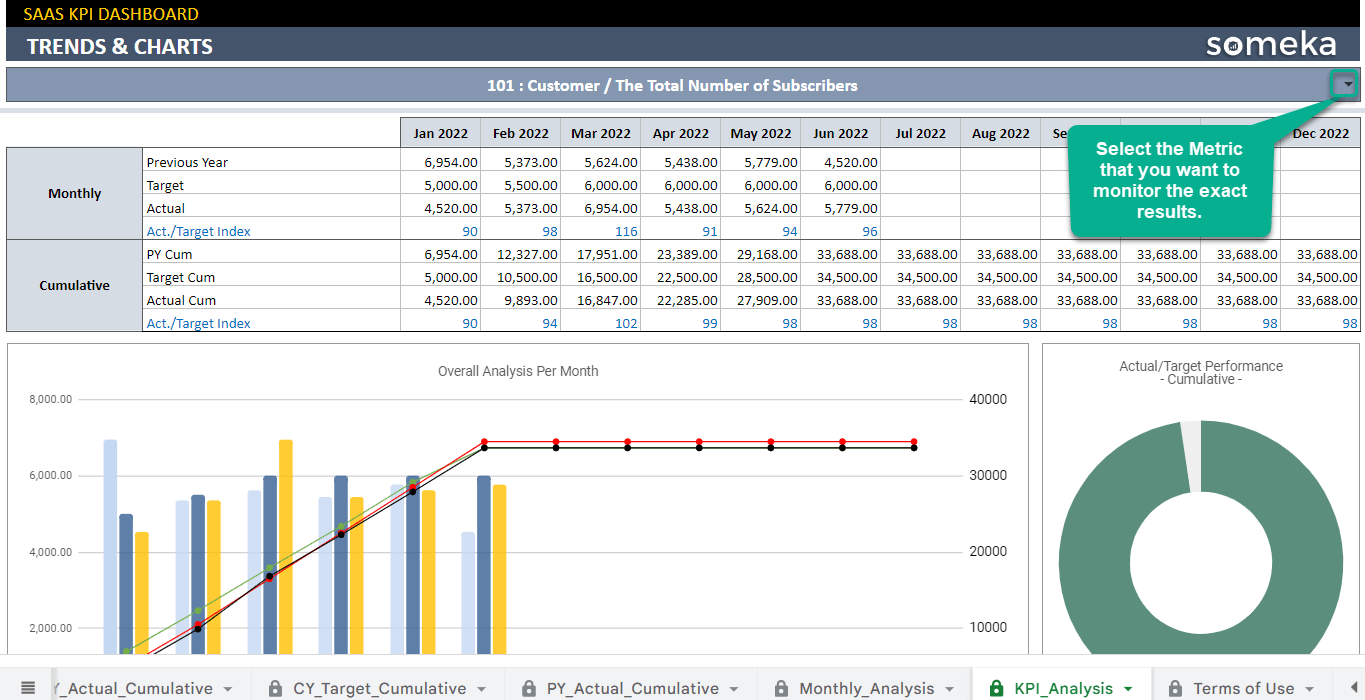
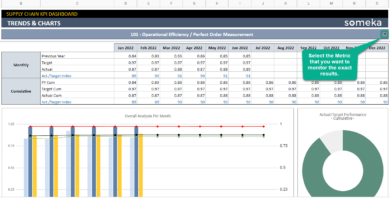
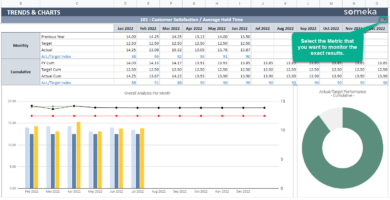
4- KPI Analysis in SaaS Google Sheets Template:
Finally, here is an all-inclusive tool for managers who wish to display KPI and metrics results over time. Simply choose your KPI to gain access to 3 different types of charts.
Meanwhile, all you need is an internet connection and a Google account to get started. And everything will be in sync!
SaaS KPI Dashboard Google Sheets Template Features Summary:
- KPI tool in Google Sheets for Software as a Service companies
- Measuring success metrics of a software company
- Monitor each measure on a monthly basis to be more goal-oriented
- Ready to Print template
- Informational notes included
- Ready to use template
- Works on any operating system
- Suitable for any device including mobile, tablet, desktop
GOOGLE SHEETS KPI DASHBOARDS COLLECTION
PRODUCT VIDEO
Watch the video below to see the template in action! Presentation also includes usage notes, explanations and tips & tricks about the template.
USER REVIEWS & COMMENTS
6 reviews for SaaS KPI Dashboard Google Sheets Template
You must be logged in to post a review.
RELATED TEMPLATES
-
 This product has multiple variants. The options may be chosen on the product page
Sales Google Sheets Templates Bundle
$199.95 – $399.95Sales Google Sheets Templates Bundle. Boost efficient in your sales team with our premium online templates. No installation, no setup. All ready to use.
-
This product has multiple variants. The options may be chosen on the product page
Task Management Google Sheets Templates Bundle
$199.95 – $399.95Task Management Google Sheets Templates Bundle. Organize, prioritize, and manage your tasks. Access from all devices. Ready-to-use online files.
-
This product has multiple variants. The options may be chosen on the product page
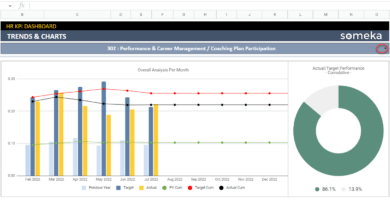
HR KPI Dashboard Google Sheets Template
$39.95 – $79.95Google Sheets dashboard for HR key metrics. A visual presentation of employee data. Printable file with preset and custom KPIs. All ready-to-use.
-
This product has multiple variants. The options may be chosen on the product page
Supply Chain KPI Dashboard Google Sheets Template
$39.95 – $79.95Google Sheets KPI Dashboard for logistics. Track and analyze monthly performance metrics of your supply chain operations. Comparison charts included.
-
This product has multiple variants. The options may be chosen on the product page
Employee Training Tracker Google Sheets Template
$39.95 – $79.95HR training scheduler in Google Sheets. Organize and track employee training program in one place. Dynamic dashboard and calendar included.
-
This product has multiple variants. The options may be chosen on the product page
Call Center KPI Dashboard Google Sheets Template
$39.95 – $79.95Customer service KPI dashboard. Ready-to-use performance tracker for your call center team. Google Sheets template with access from all devices.


Richard –
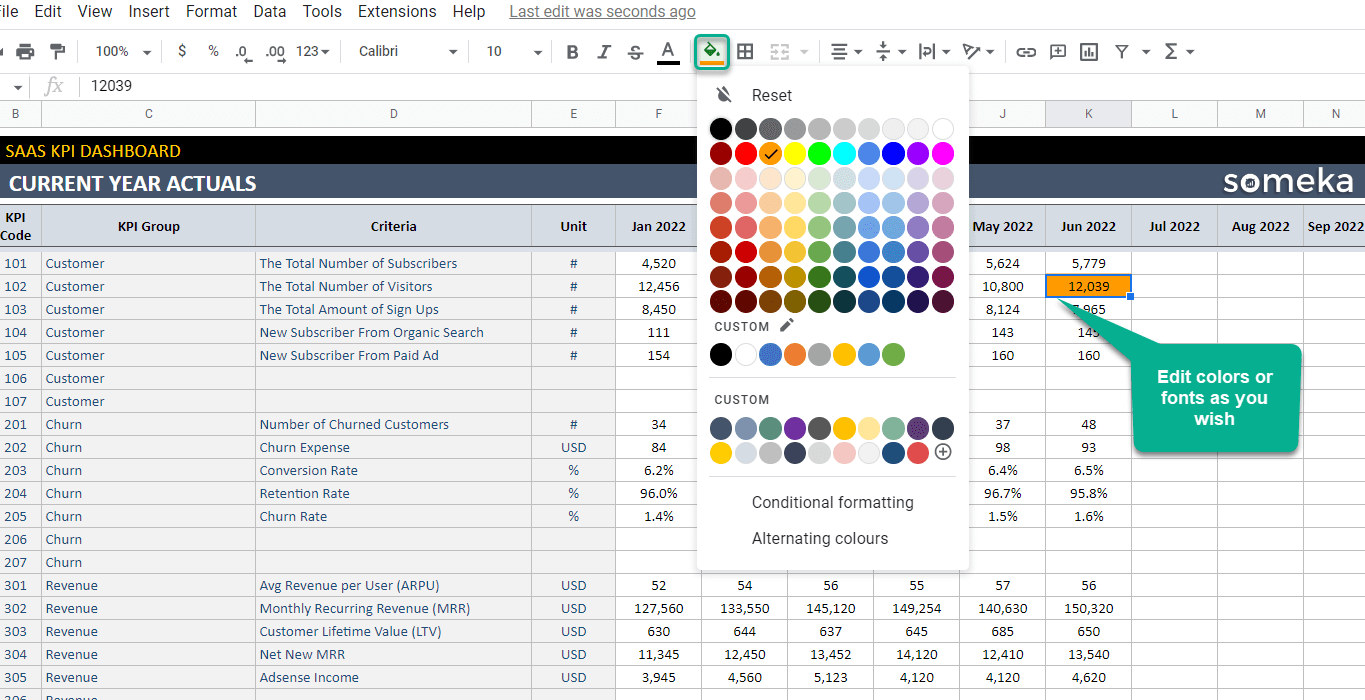
Change needed! I want t change some colors or sth. How?? Help!!
Someka –
Hello Richard,

You can quickly change your cells as a color of KPI while on any tab.
If you require further assistance, please contact us at contact@someka.net and a member of our team will assist you.
Sophie S. –
Make me to use googlesheets day by day!
Ferris Sandoval –
I wasn’t expected to have sth like this. Simple and cool!
CLIFFE –
Its great to show to Previous and Currently year data together!!
Marshall –
Great tool to make diference on construction evaluation.
George A. –
Can I change cumulative calculation method? Or it must be only average?
Someka –
Hello George
You absolutely can! You can define the cumulative calculation method based on the KPI.
If you have additional questions, please email us at contact@someka.net and one of our consultants will assist you.