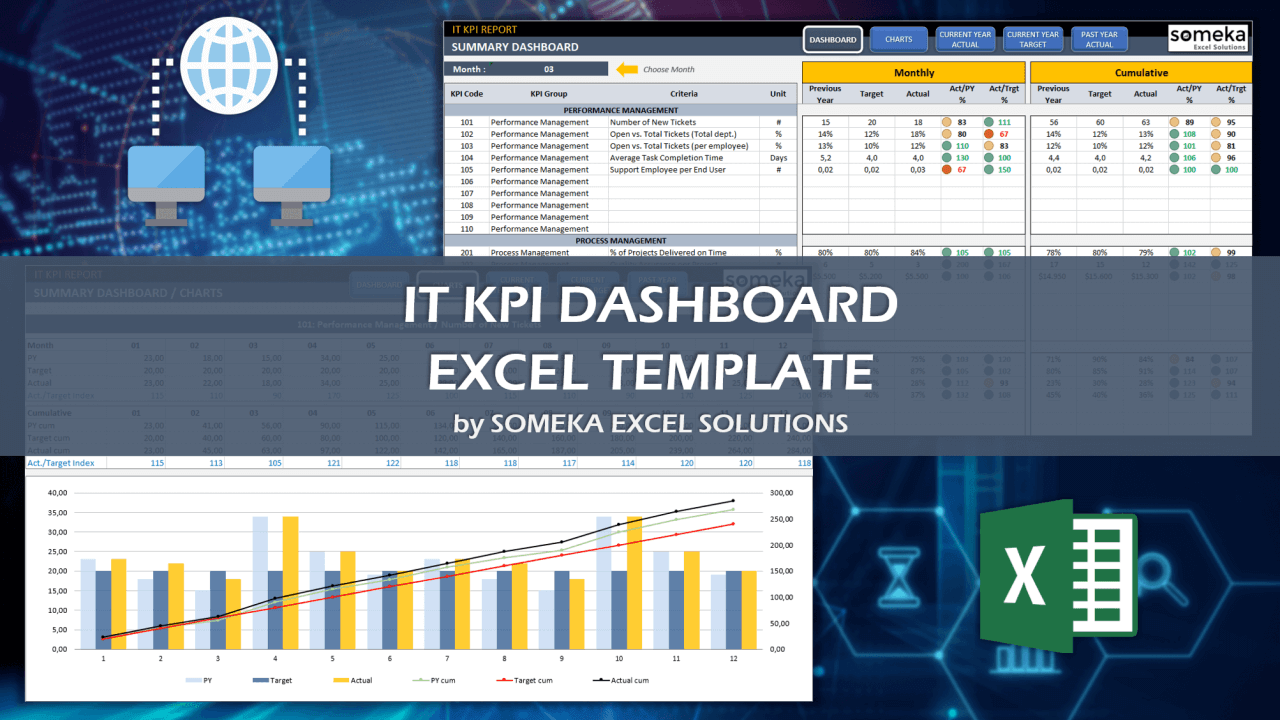
IT KPI Dashboard Excel Template
Excel spreadsheet for IT departments. Track your key metrics in information technology with target-based and yearly comparisons. Printable trend charts.

TEMPLATE DESCRIPTION
As the businesses become more complicated, the pressure on the IT team is increasing enormously. However, you can demonstrate your contribution to the company through measurable and precise KPI metrics. Also, thanks to this IT KPI Dashboard Excel Template, you will be able to see how well your IT department is performing and take necessary action for weak areas.
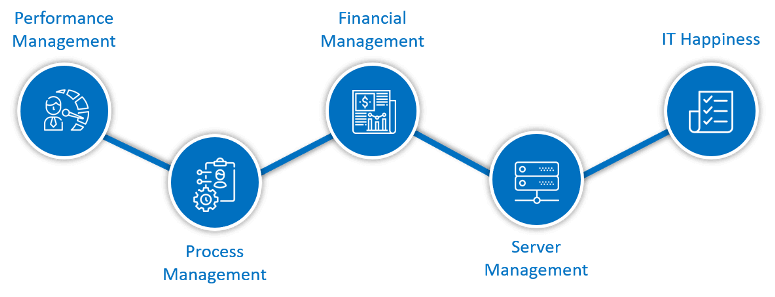
We have accumulated the most frequently used 16 KPIs in the IT department and grouped them into five main groups consisting of the following:
Now, let’s see the details of the IT KPI Dashboard Excel Template.
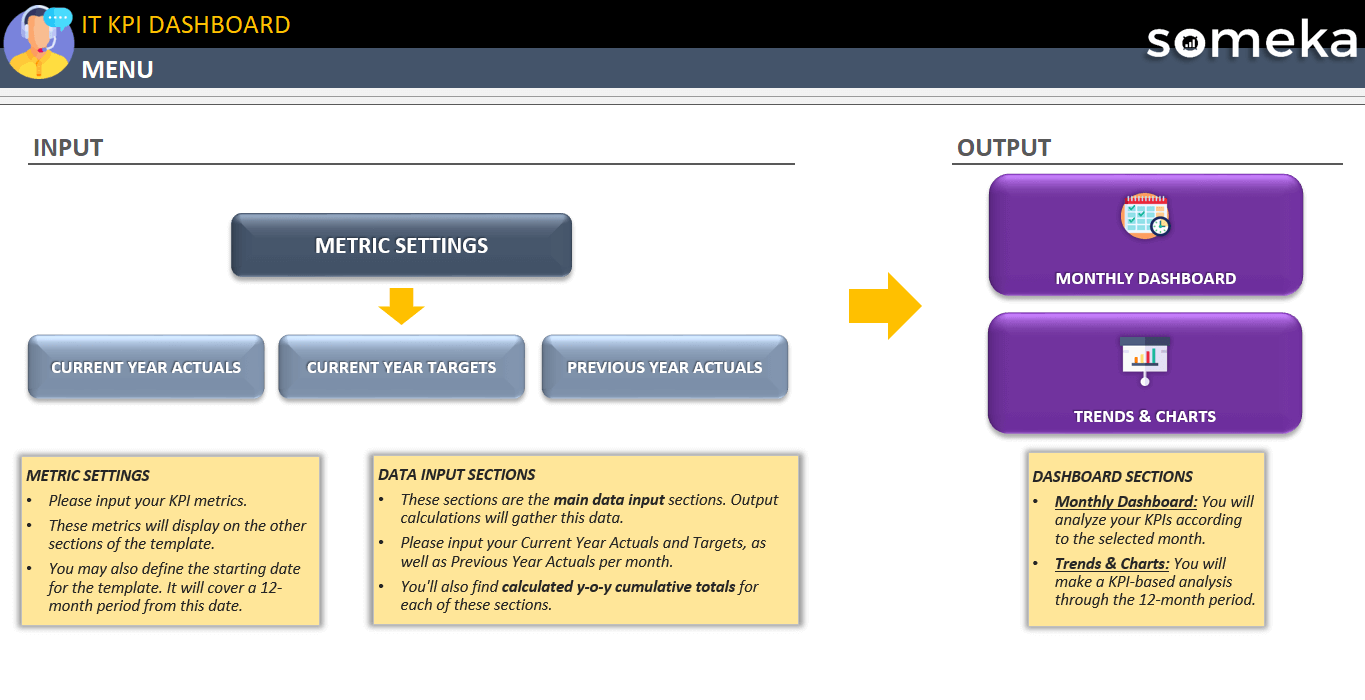
IT KPI Dashboard Excel Template Features:
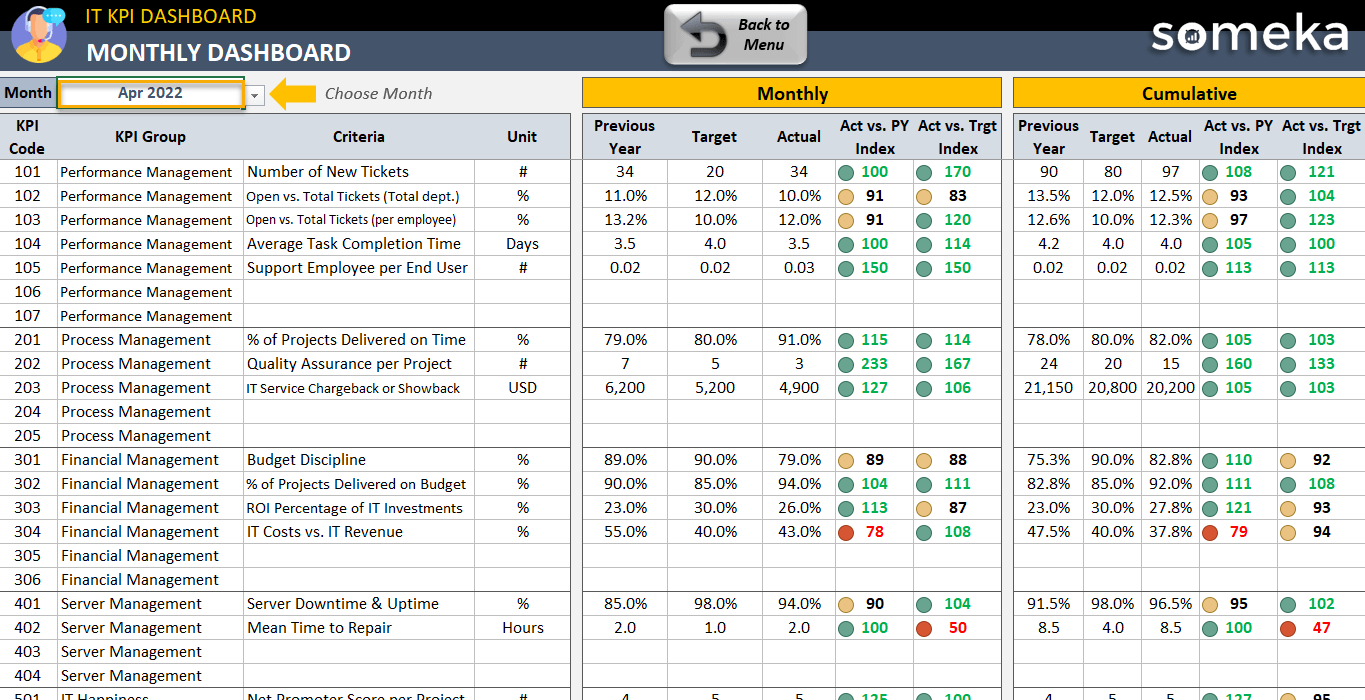
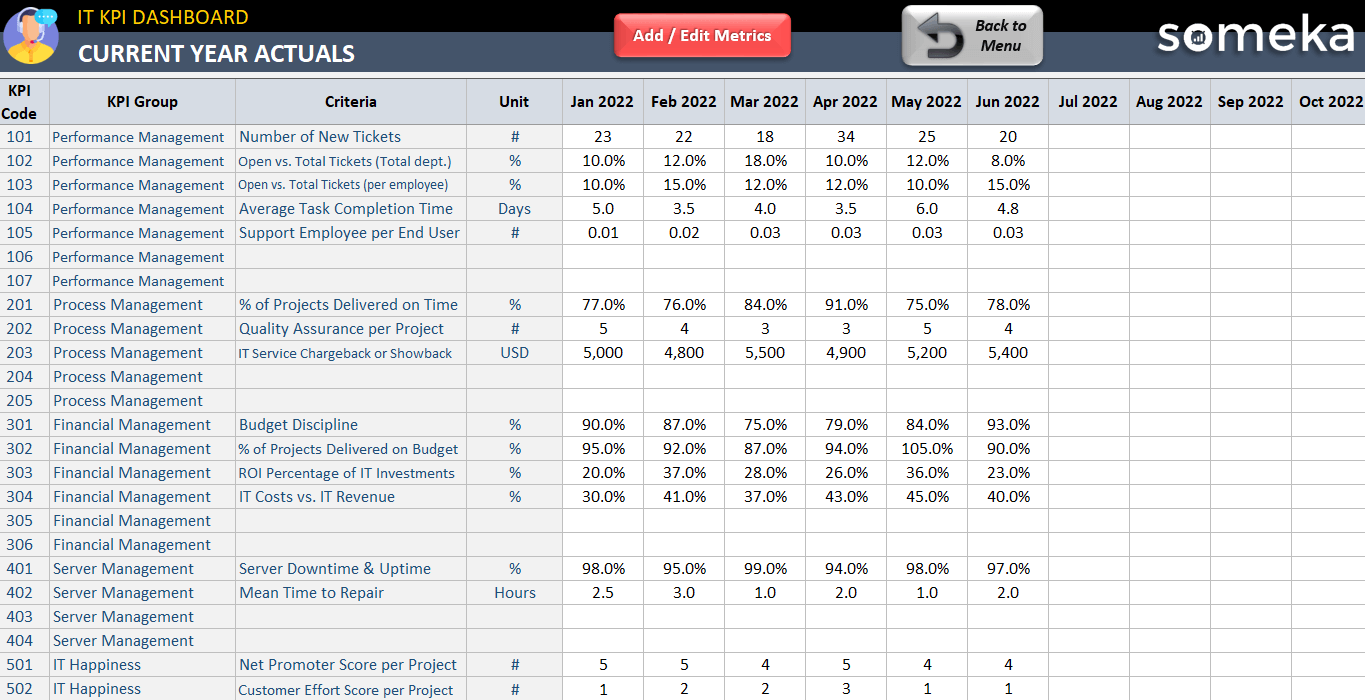
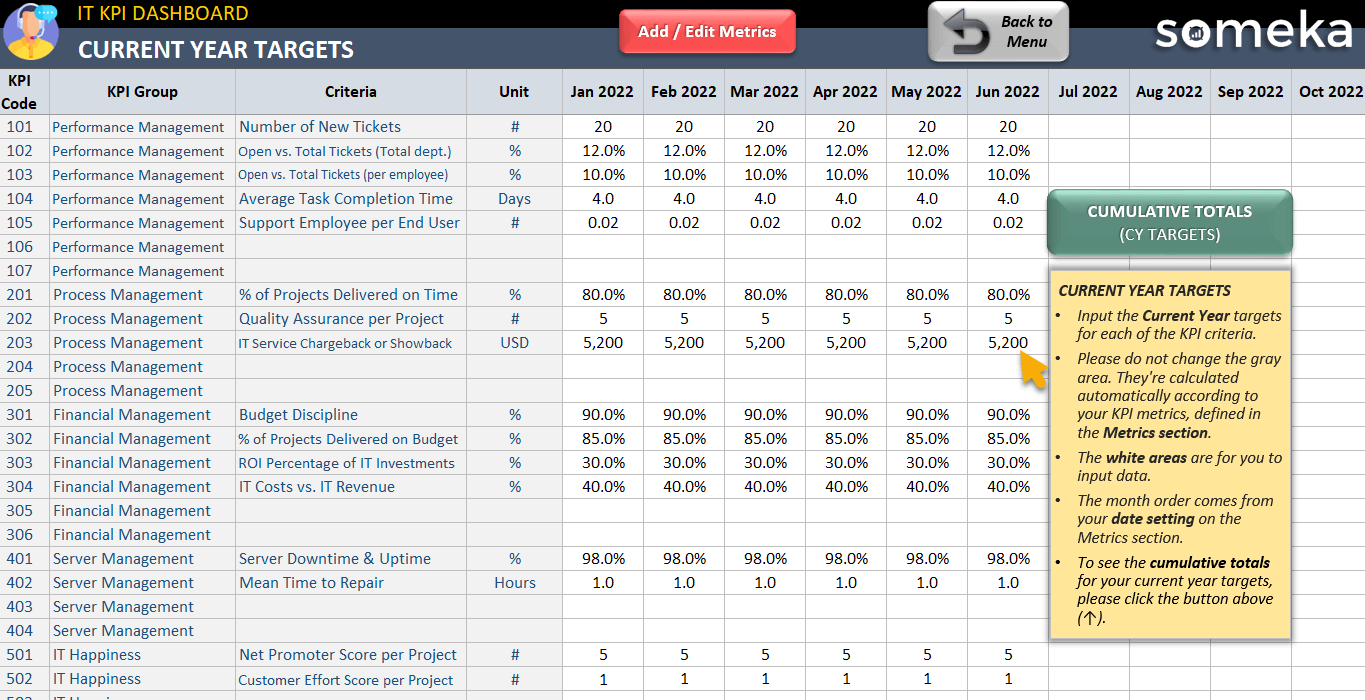
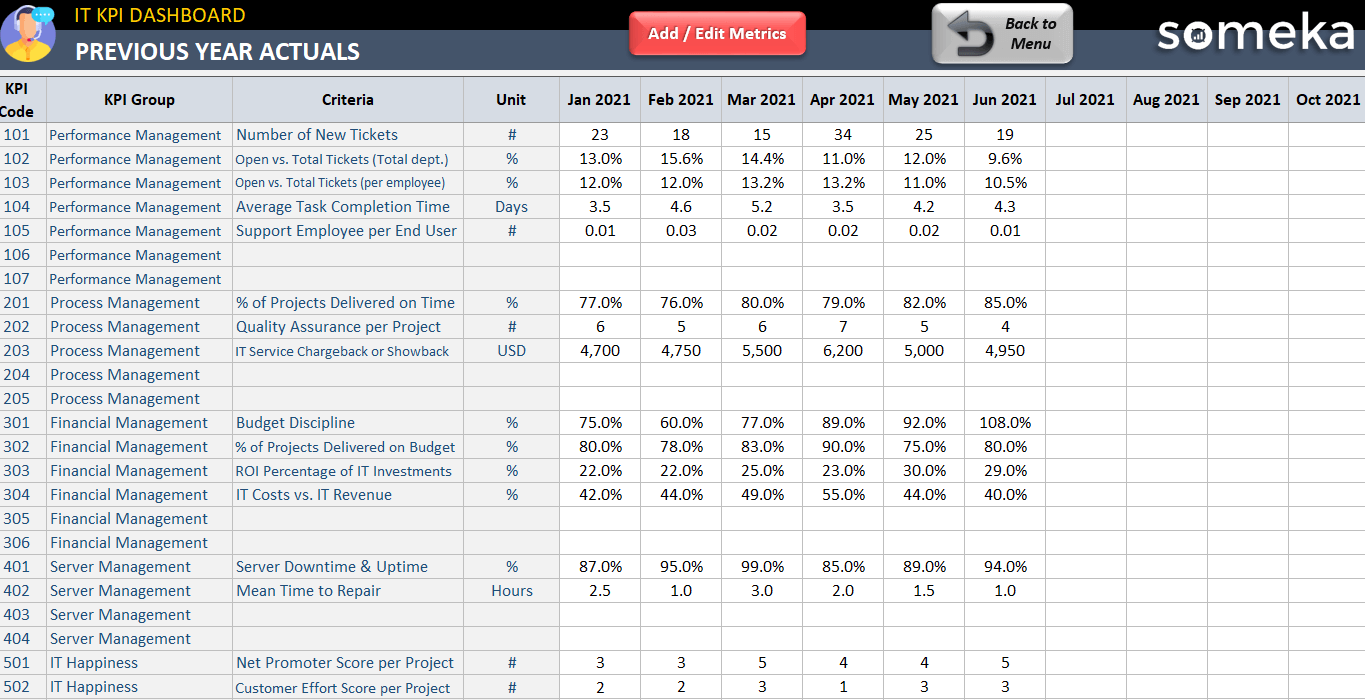
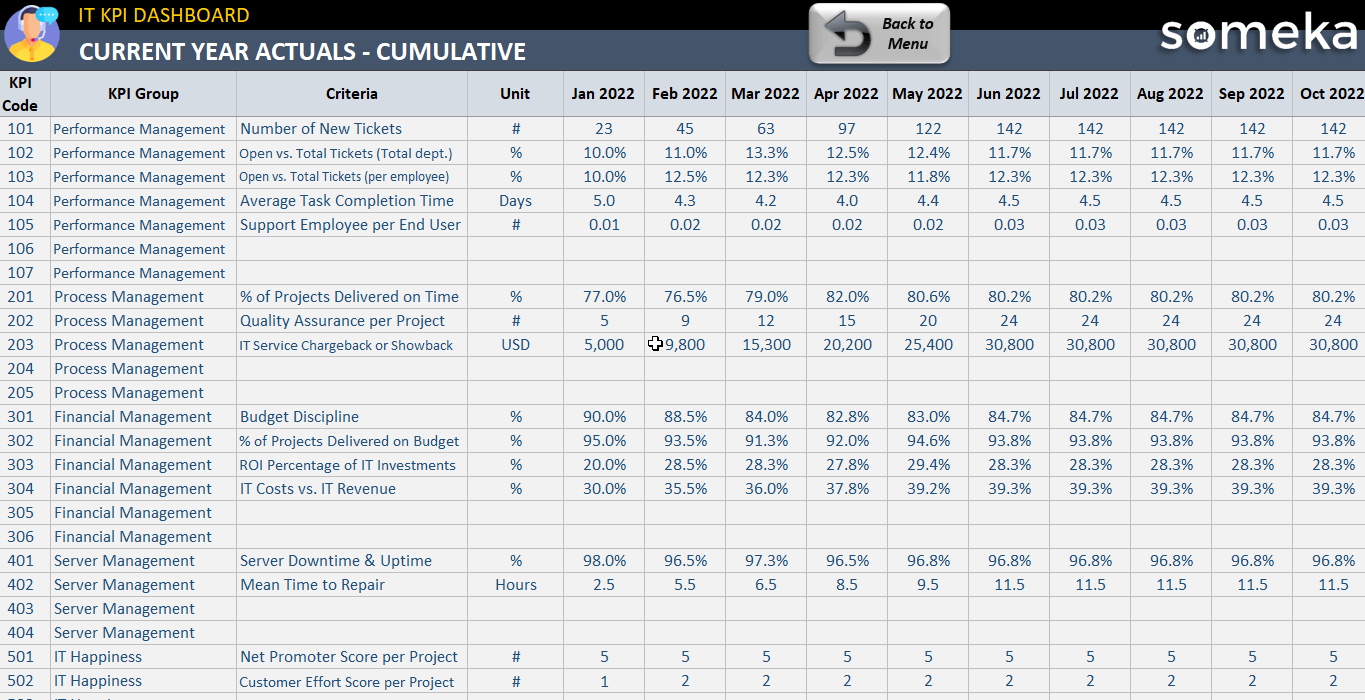
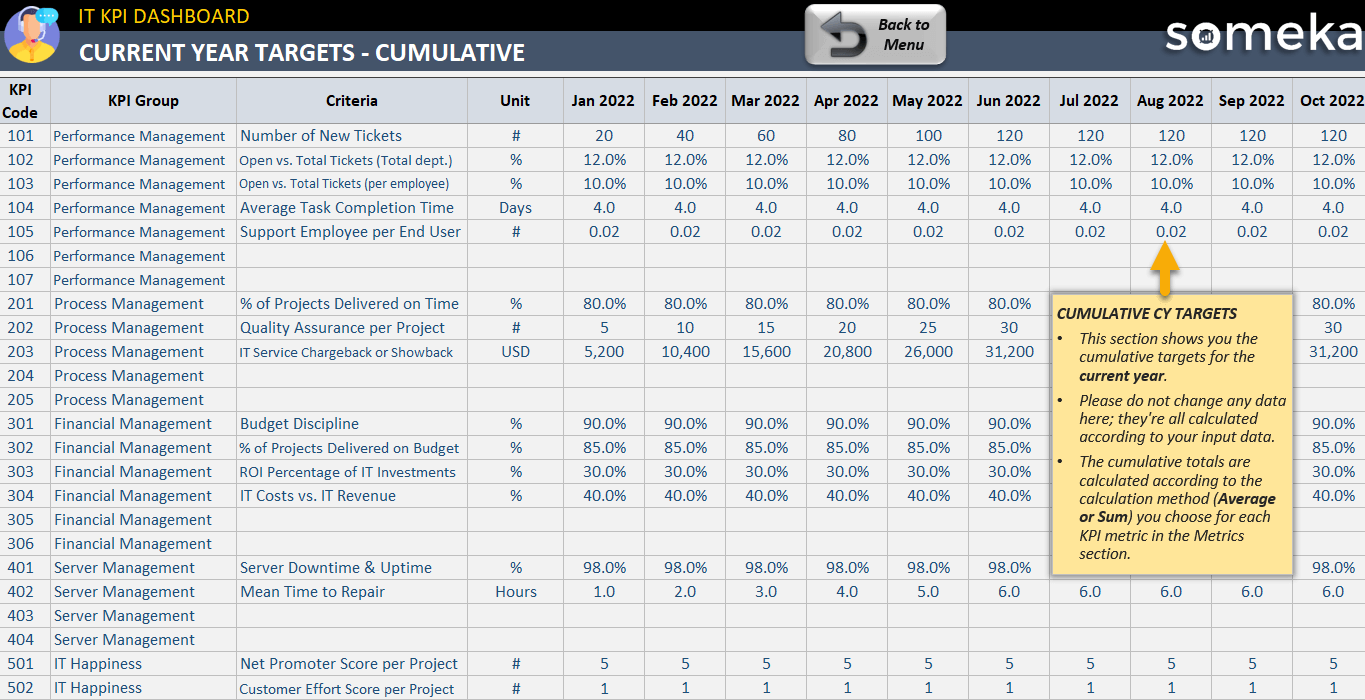
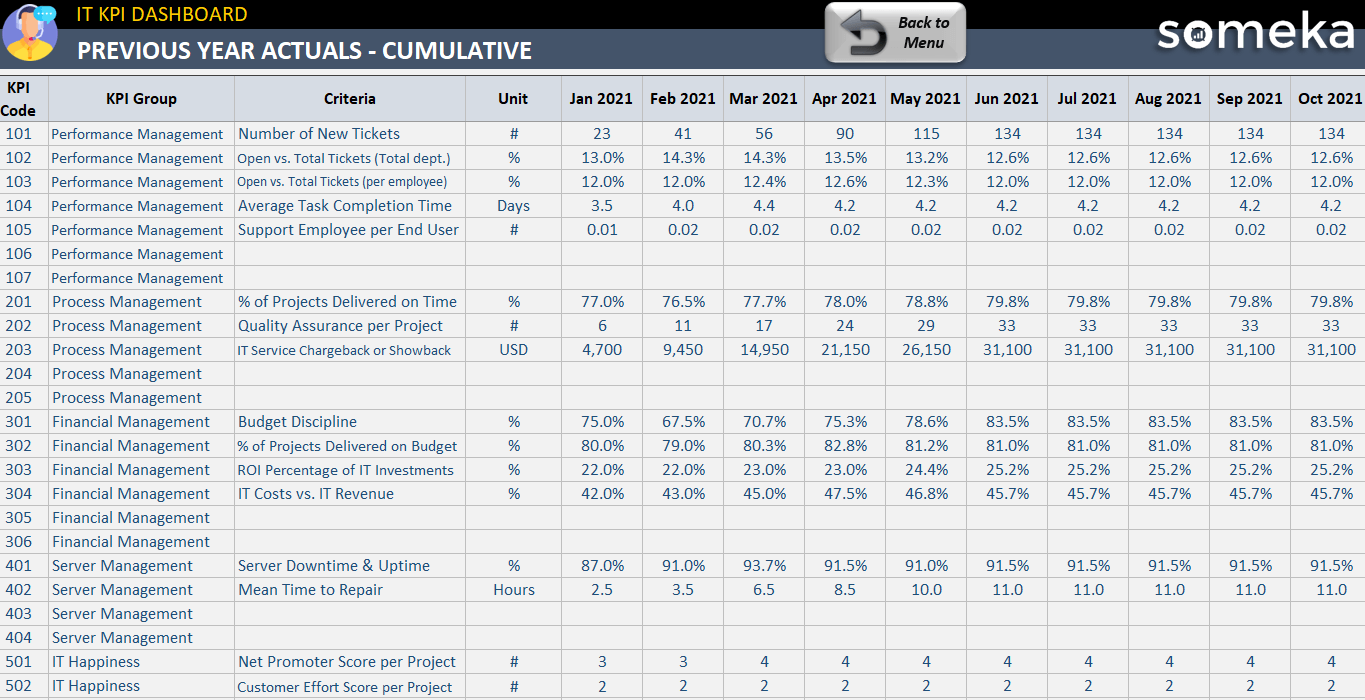
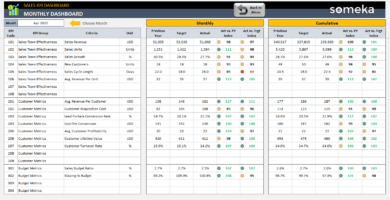
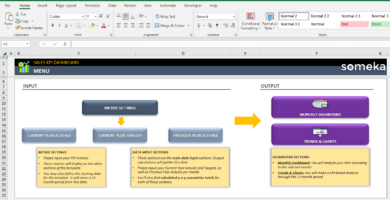
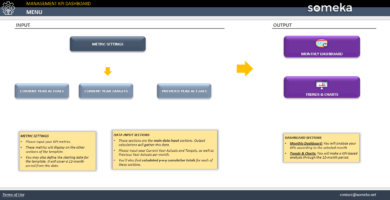
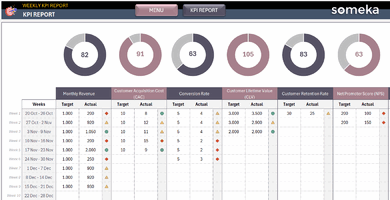
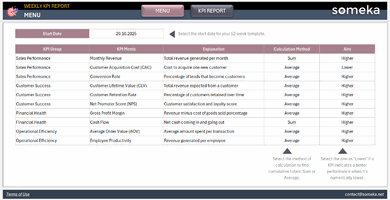
In the Dashboard, you can use the navigation buttons to switch between other sections. So here, the first section that which you are going to input your own values is Current Year Actual, Current Year Target, and Past Year Actual.
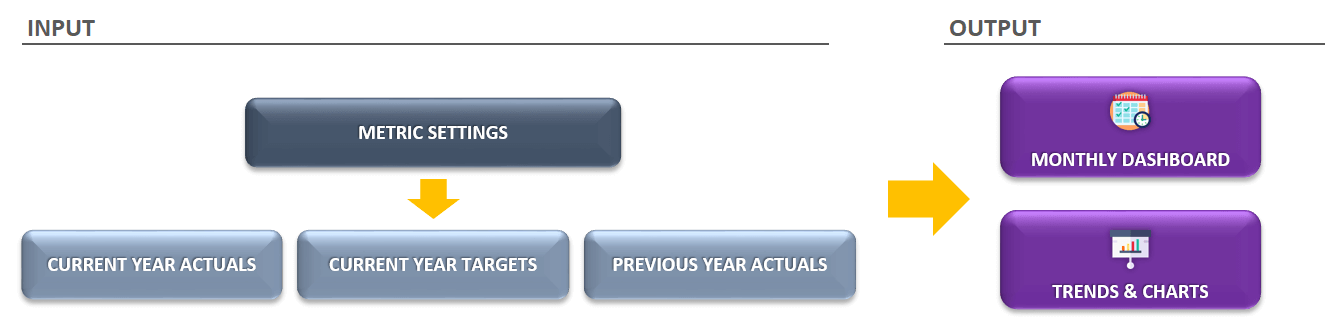
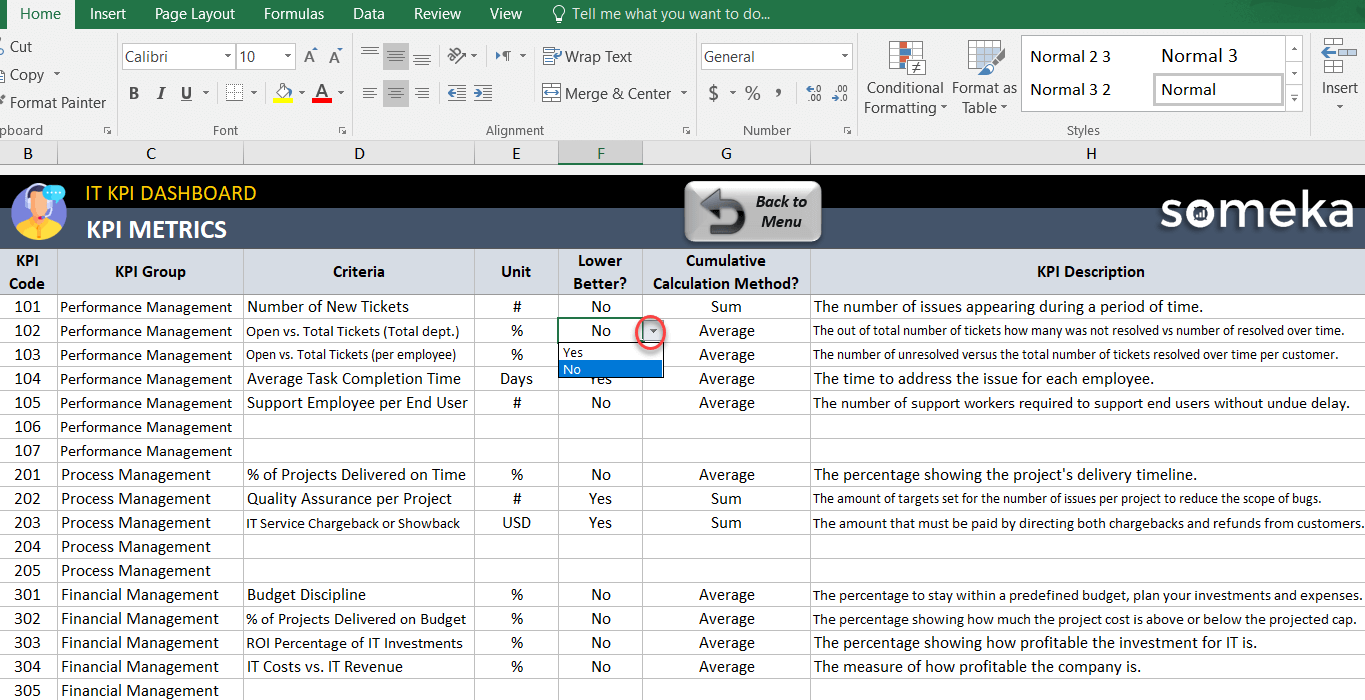
You will find a sample data, but you can also put your own data or add new IT KPI codes.
Warning!: Please note that when you add/remove a KPI code, you should change it in other sections as well. For example, if you add a new KPI to CY Actual section, don’t forget to change it in CY Target, PY Actual, and Cumulative.
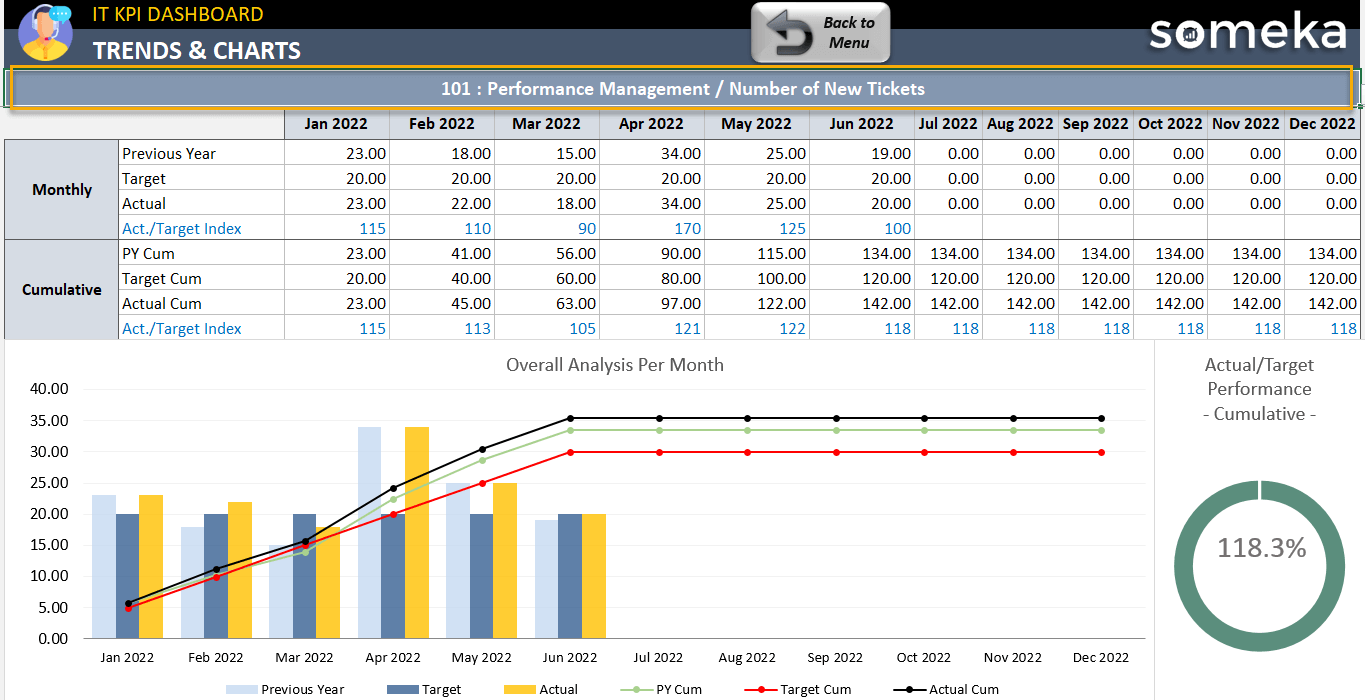
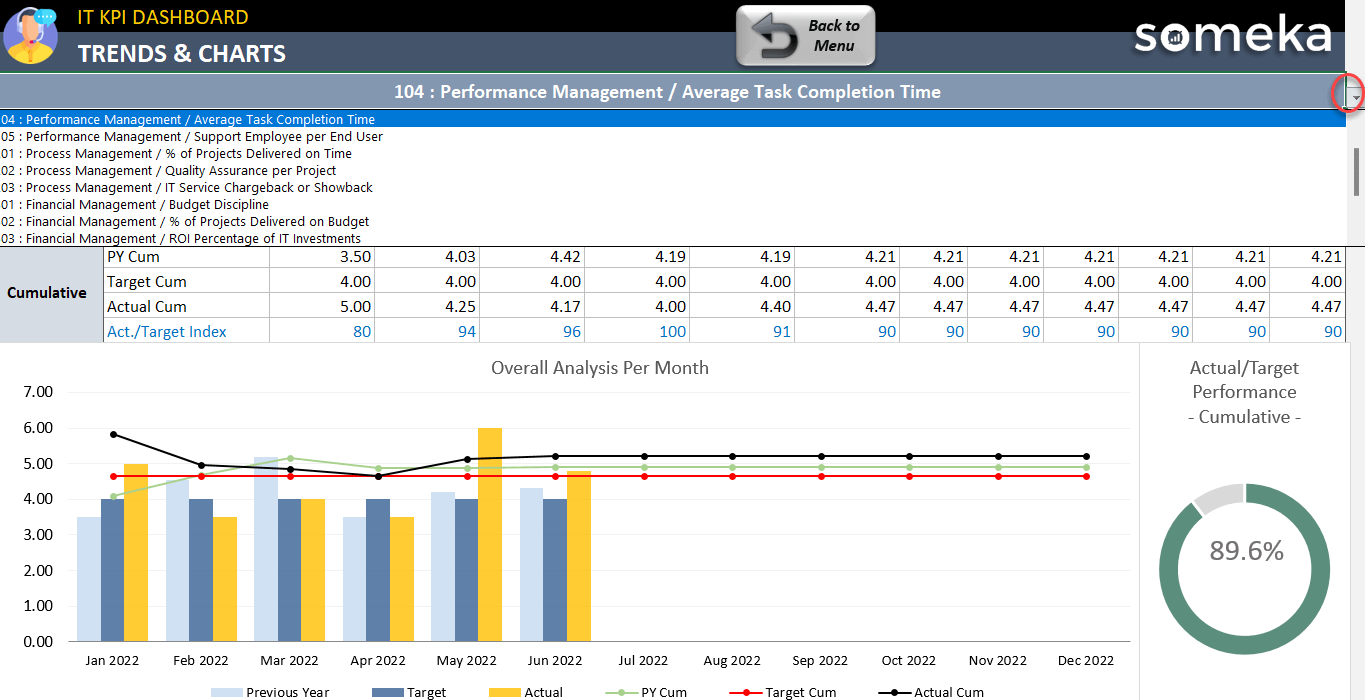
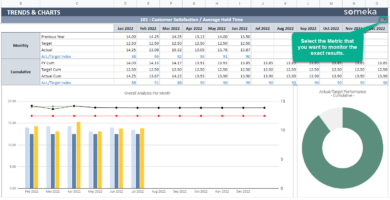
Besides that, the template will allow you to see trends with the charts according to the selected KPI.
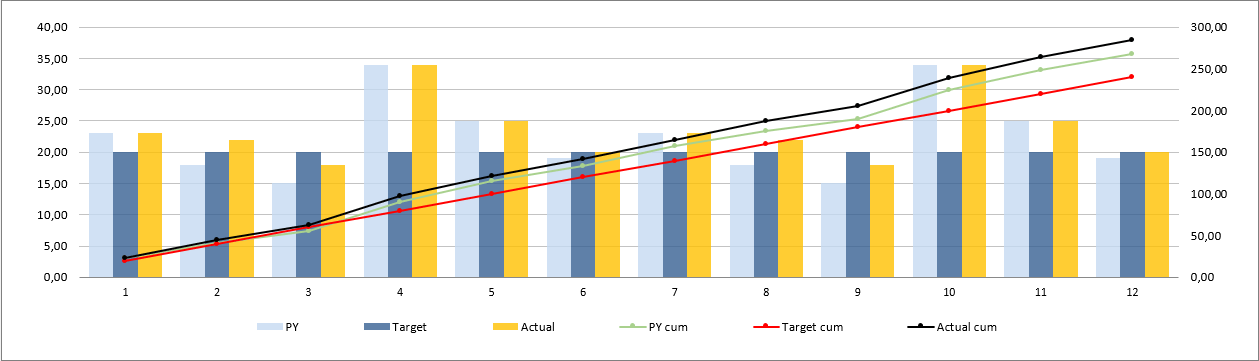
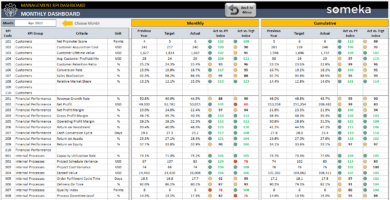
Finally, the dashboard shows monthly and cumulative results separately. In this way, you can see the comparison with last year’s figures and company targets. This is an efficient way to keep track of your critical metrics, make comparisons and take relevant actions.
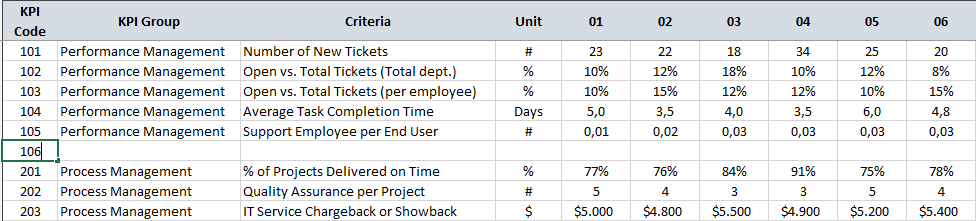
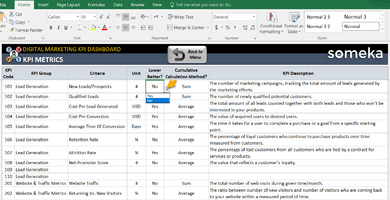
Detailed Description of IT KPI Metrics in Excel Template:
Performance Management KPI Dashboard
 – Number of New Tickets: How many issues appear in a specific period of time. All incoming problems or requests need to convert into a ticket. This KPI metric will enlighten and ease your way in telling how much value you bring to the organization.
– Open vs. Total Tickets (Total dept.): How many of the total tickets are resolved over time. A low ratio of resolved to open tickets might indicate a systematic problem such as wrong deadlines, the workload of the staff, resource allocation, and so on.
– Open vs. Total Tickets (per employee): This metric will give an opinion about each of your employee’s performance. You may look into if there is a specific issue for the employee who has dropped behind others.
– Average Task Completion Time: This metric will help you to keep your issue handling time under control for every employee.
– Support Employee per End User: An increasing ratio of support employees to end users show that you need to hire more support people in order to maintain your high-quality work without being so under pressure
 Process Management KPI Dashboard
 Process Management KPI Dashboard
– % of Projects Delivered on Time: An insight into the delivery timeline for your project. it’s very easy to set clear targets for this metric and measure it if you manage your projects with timelines
– Quality Assurance per Project: In order to lower defect containment, you should set a target for the number of issues, bugs, or problems per project and start to track it.
– IT Service Chargeback or Showback: A chargeback system means applying the costs of IT hardware, software, cloud services, or shared services to the business unit in which they are used. Showback is similar to chargeback but the prices are for informational purposes only and no one is billed.
Financial Management KPI Dashboard
 Financial Management KPI Dashboard
– Budget Discipline: Staying on a predefined budget is crucial in order to plan your investments and expenses. The main rule for this metric is ensuring that you break down your budget into different expenditure items in detail.
– % of Projects Delivered on Budget: This metric estimates if the cost of your project will be above or below your projected upper limit.
– ROI Percentage of IT Investments: ROI of an IT investment will answer the question, “How profitable is your investment?”. The most basic way to calculate ROI is the benefit (or return) of an investment divided by the cost of the investment.
– IT Costs vs. IT Revenue: This is one of the most important metrics to maintain steady and healthy growth. This comparison will put teams in a position to stay on target or address anomalies. If the percentage is steady and it is within your target range it shows that you drive safe.
Server Management KPI Dashboard
 Server Management KPI Dashboard
– Server Downtime & Uptime: This KPI metric refers to the period of time during which your IT infrastructure becomes non-functional because of some glitches with the server.
– Mean Time to Repair: Mean time to repair represents the time between the start of a system problem. The moment it gets resolved.
IT Happiness KPI Dashboard
 IT Happiness KPI Dashboard
– Net Promoter Score per Project: Net Promoter Score measures the satisfaction of your business partner. Once you have completed a project, you should ask them to rate it and get feedback. Usually measured on a scale from 1 to 5 representing the amount of the satisfaction of your business partner.
– Customer Effort Score per Project: Customer Effort Score measures the effort that your customer puts in personally to have the request handled. It is usually measured on a scale from 1 to 5 representing the amount of your customer’s effort.
This template will be a reference for your OKR (Objectives and Key Results) tracking for your IT departments. Define your OKRs for your business, then track IT KPIs with this template.
IT KPI Dashboard Excel Template Features Summary:
- Monthly and Cumulative Analysis of KPI for IT Department
- Comparison with Past Year and Target values
- Summary dashboard supported with interactive charts
- Easy to use and nice design for presentations
- Clear on-sheet instructions
- Compatible with Excel 2010 and later versions
- Works both on Windows and Mac
- No installation needed. Ready to use
- Full Print ready
- White Label
- Does not include any VBA macros
EXCEL KPI DASHBOARDS COLLECTION
PRODUCT VIDEO
Watch the video below to see the template in action! Presentation also includes usage notes, explanations and tips & tricks about the template.
USER REVIEWS & COMMENTS
13 reviews for IT KPI Dashboard Excel Template
You must be logged in to post a review.
RELATED TEMPLATES
-
 This product has multiple variants. The options may be chosen on the product page
Call Center KPI Dashboard Google Sheets Template
$39.95 – $79.95Customer service KPI dashboard. Ready-to-use performance tracker for your call center team. Google Sheets template with access from all devices.
-
This product has multiple variants. The options may be chosen on the product page
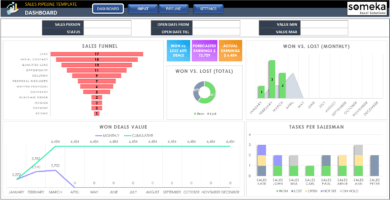
Sales KPI Dashboard Excel Template
$39.95 – $79.95Sales KPI Spreadsheet. Track your key metrics on sales team. Dynamic dashboard with trend charts and comparison analysis. All in Excel.
-
This product has multiple variants. The options may be chosen on the product page
Management KPI Dashboard Excel Template
$39.95 – $79.95Management KPI Dashboard in Excel. Includes most common metrics for supervisors. Editable & Printable. Ready for your presentations with dynamic charts.
-
This product has multiple variants. The options may be chosen on the product page
Sales Excel Templates Bundle
$199.95 – $399.95Bundle pack for Sales Templates in Excel. All uniquely designed, printable, professional spreadsheets for sales departments. Ready for use.
-
This product has multiple variants. The options may be chosen on the product page
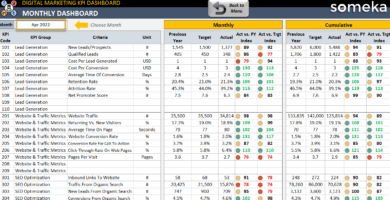
Digital Marketing KPI Dashboard Excel Template
$39.95 – $79.95Excel KPI spreadsheet for digital marketers. Track your key metrics on social media, SEO, PPC and leads. Printable dashboard with trend charts.
-
This product has multiple variants. The options may be chosen on the product page
Weekly KPI Report in Excel
$29.95 – $59.95Download Weekly KPI Report Excel Template. Compare Actuals vs Targets on weekly basis. Ready spreadsheet. Cumulative charts included. Editable and printable.

Raymond Scott –
It is incredibly conveniente for me to monitor our advancemeant through the IT KPI regular and accumulated analysis of key performance indicators.
Mursalin Ph.D –
I am unable to access the IT KPI Dashboard Excel Template, as it appears to be locked. What can I do to solve this issue?
Someka –
We apologize for any inconvenience. To be able to customize our template, you need to unlock it using the password included in the zip file. We must lock our templates so customers don’t make any unintended changes. If you require more help, please don’t hesitate to contact us right away.
contact@someka.net
Geof Merlos –
Can I add a new KPI code to the IT KPI Dashboard Excel Template?
Someka –
Hello! Thanks for your inquiry. It is possible to add metrics from the Metrics sheet to this KPI dashboard. If you require more assistance, please do not hesitate to contact us at contact@someka.net.
Rita M. –
Buying the multi-user version of this template has made it so simple for me to monitor our progress. invest on in 100%
Megan Kast –
the IT KPI Dashboard Excel Template has interactive charts which are extremeliy useful in seeing the patterns of the IT department’s kpi.
Manuela E –
HELLO ,
This Dashboard looks useful and easy to use. Thanks.
Do you give training to use?
Someka –
Hi Manuela,
Thank you for your kind words and valuable comment! In fact, we currently don’t have a training kit, but we can consider bringing this up.
Thank you for giving us an idea!
For now, we have a product video to show how you can use the template and all the features. Please click the video section above to watch!
Pru Darby –
useful design for company presentations! thanks team
Vibhas –
Great support
Ahmed –
please I want tray this program
Someka –
Hello Ahmed!
At this moment, we are not providing the free trials of our premium templates but you can watch the video tutorial and get an overview on how to use the tool step by step.
If you have more questions after you watch it, please contact us via Livechat or Mail. We’d be more than happy to clarify things up for you.
roxy dohm –
Not as per my need. I need to have some more better metrics for my IT department.
Someka –
Hello Roxy! Thanks for the feedback! The KPI metrics we placed in the template is the most used ones in the industry. But you can change them according to your business. The automatic calculations will adapt themselves to the metrics you input.
Bries –
they don’t have an Spanish version of the product and my bosses are bilingual, all my reports should be presented in English and Spanish. I can modify lines to add the Spanish description but wish you have
harriet –
I love to be able to have a real time preview of the metrics I am creating or updating
Charles Clarke –
Clear information throughout the process. Worth the money.