Sales Pipeline Excel Template
Track your sales pipeline in Excel! Divide your sales process into stages, find the bottlenecks and visualize them in a summary dashboard.


TEMPLATE DESCRIPTION
Having an efficient sales process requires additional efforts to achieve success. At the end of the day, competent management of each step in the process is what brings the greatest return. In this context, using a sales pipeline template in Excel is an effective method of turning your prospects into customers. You can divide your sales process into stages to get a better understanding and greater success of each step.
As a strategic channel for growth and revenue optimization tool, this Sales Pipeline will help you track all your leads and channels. Also if incentives, bonuses, and negotiation play a key role in your team, this tool will be also a reference for your incentive calculations.
This Sales Pipeline template will help you to better manage your sales process, track the success of each stage and increase the conversation rate of your potential customers.
With a focus on marketing, prospecting, and brand performance, this CRM helper streamlines lead segmentation and follow-up strategies. Optimize closure rates and lead-to-customer, lead-to-sale or opportunity-to-deal conversion with our customizable pipelines.
Sales Pipeline Template Features:
There are four sections on the template which are Dashboard, Input, Pipeline, and Settings.
We recommend you start with the settings section to use the template effectively.
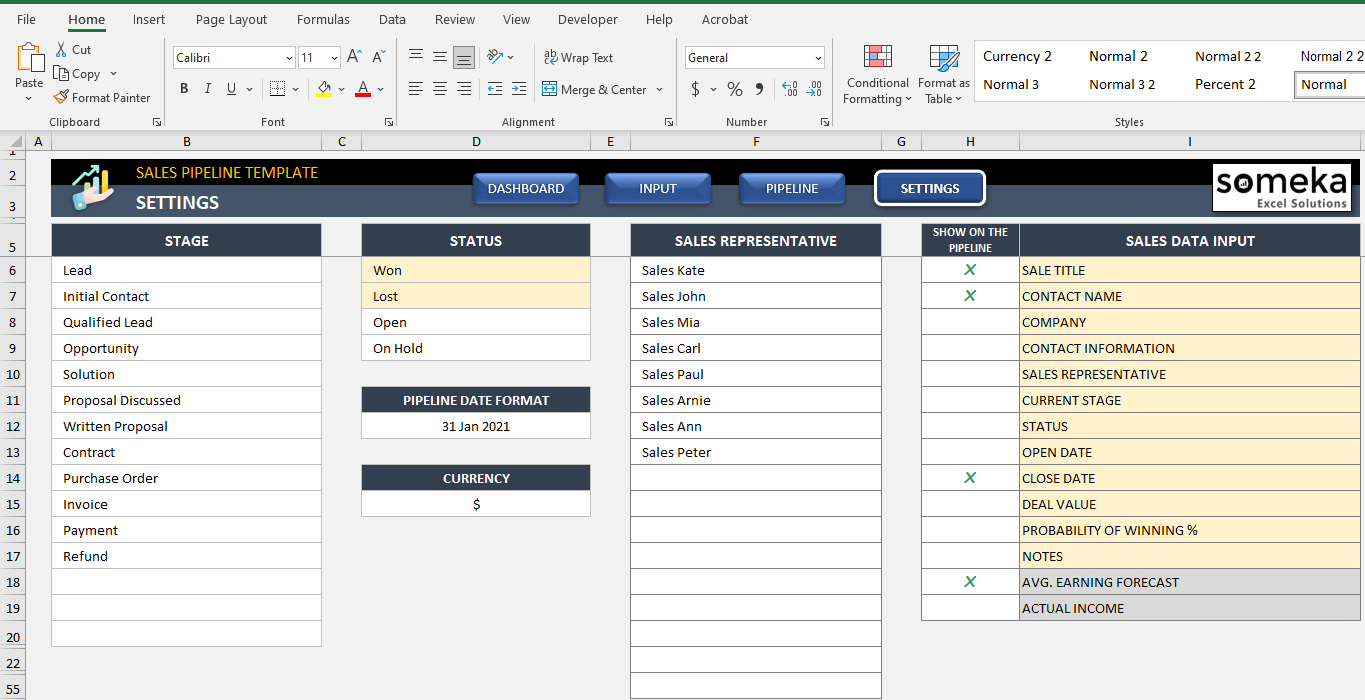
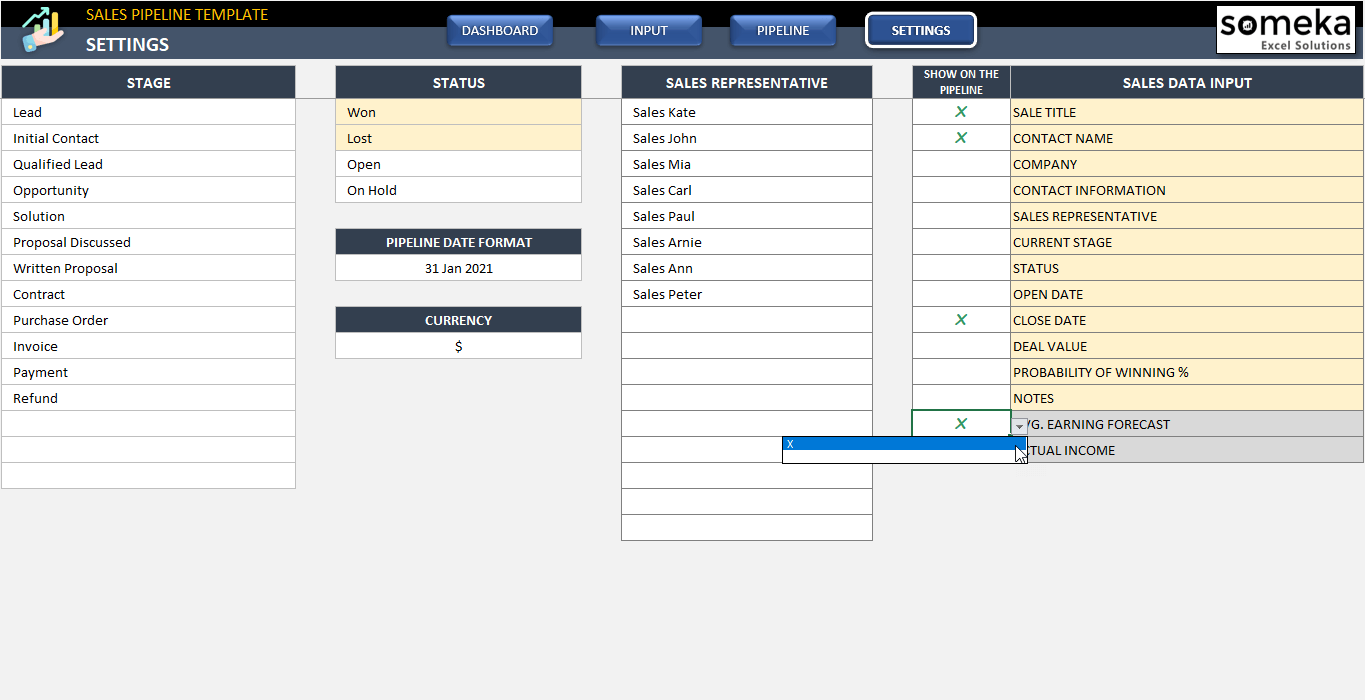
Settings:
In this section, you can determine the stages of your sales process, define sales status, list sales representatives, choose a date format, and select the categories that will show up on the sales funnel template.
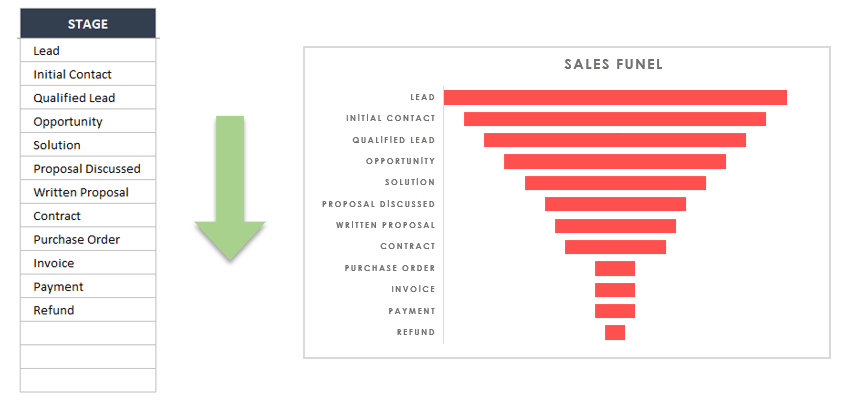
It is important to define stages in the sequence of occurrence in your sales process. Because you will see the same order in the sales funnel graph of the dashboard section.
Besides that, you can specify the status you will use on the input sheet. Date format selection is also included in this template so that you can easily change the date style shown on the sales pipeline.
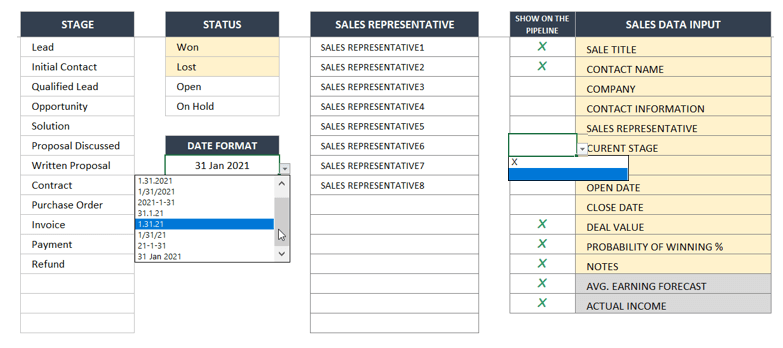
Lastly, you can also select the sales data input categories you wish to be included in the pipeline section. Just select the “X” sign for the categories you would like to see on the pipeline. You can easily play around with the X sign selection and update the pipeline section according to your needs.
The pipeline section is similar to a kanban board. So, the marked details will be visible in the pipeline section as kanban visualization.
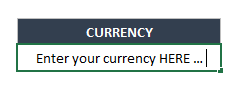
In addition, you may also define your desired currency option in the Settings section. Remember that this selection of currency will be used throughout the sales pipeline template.
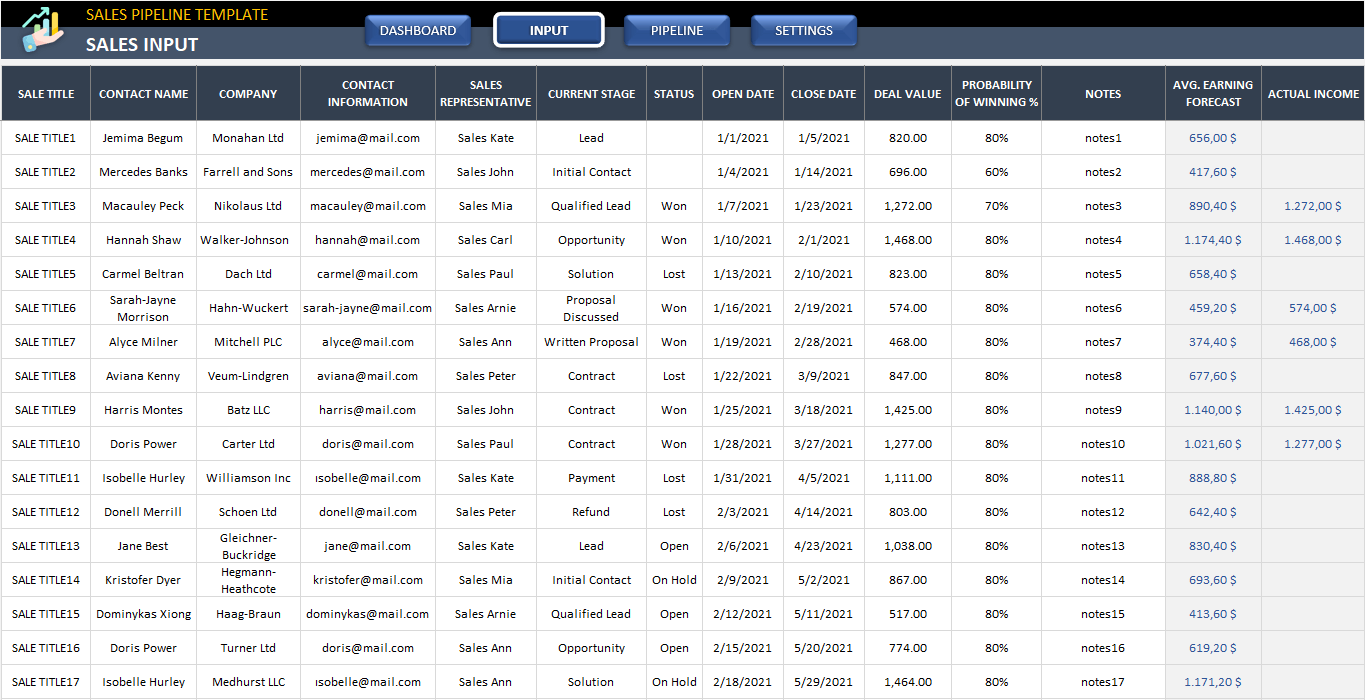
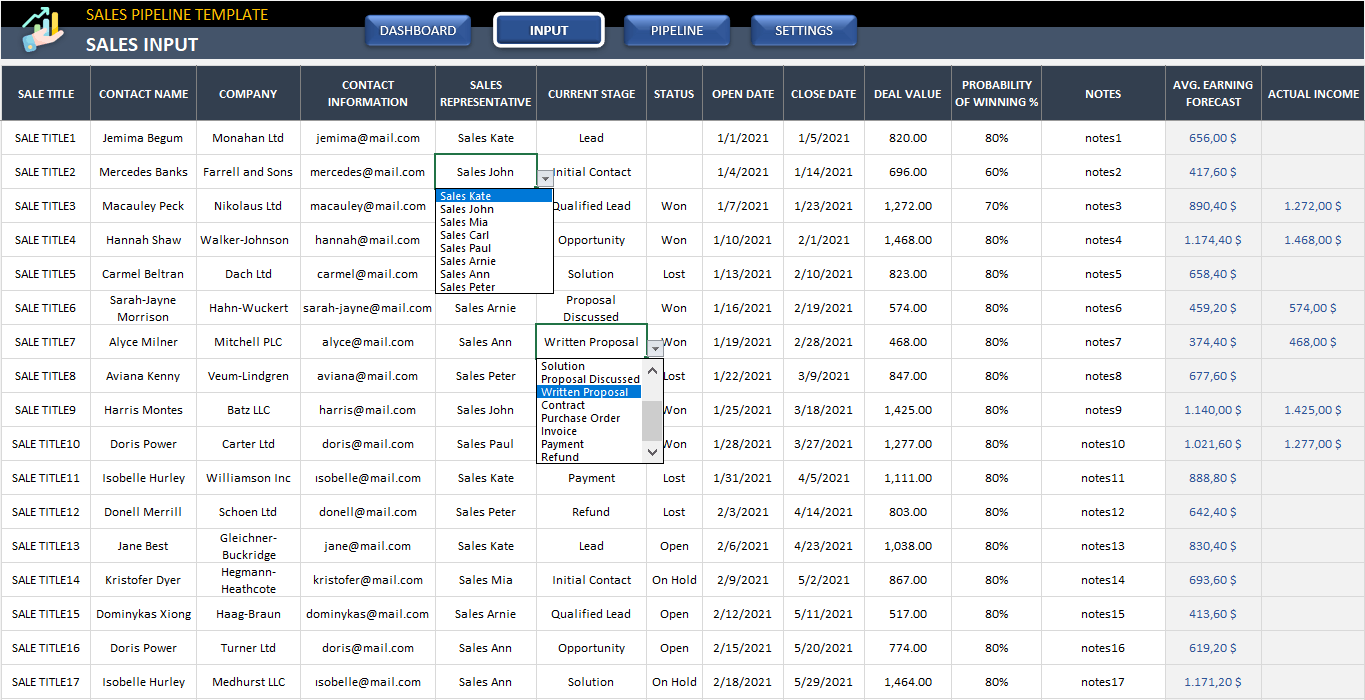
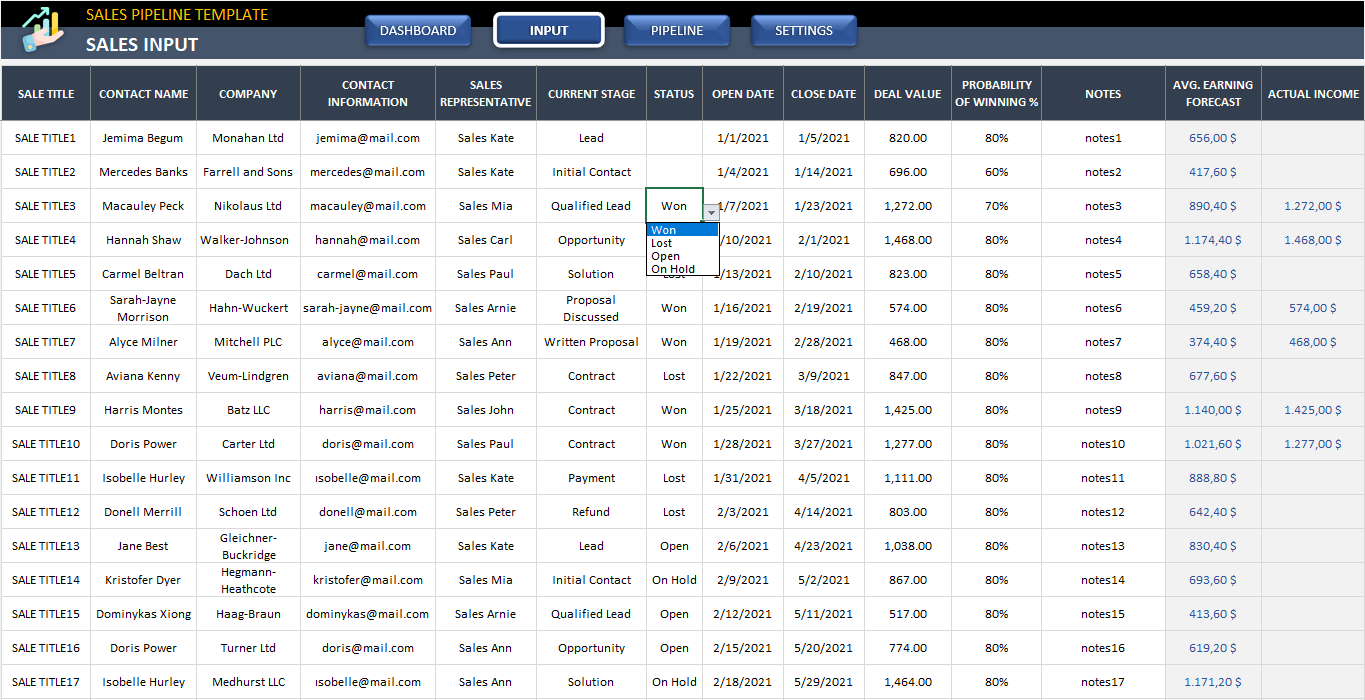
Input:
This area is for your data input. The titles in this sheet are based on the category titles you set in the settings section (Sales Data Input).
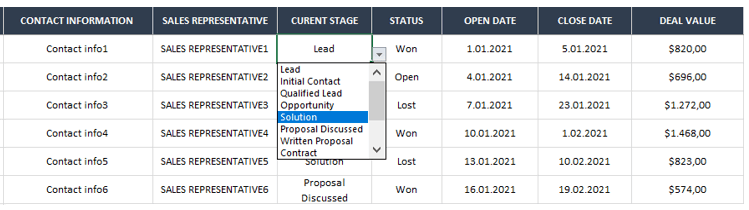
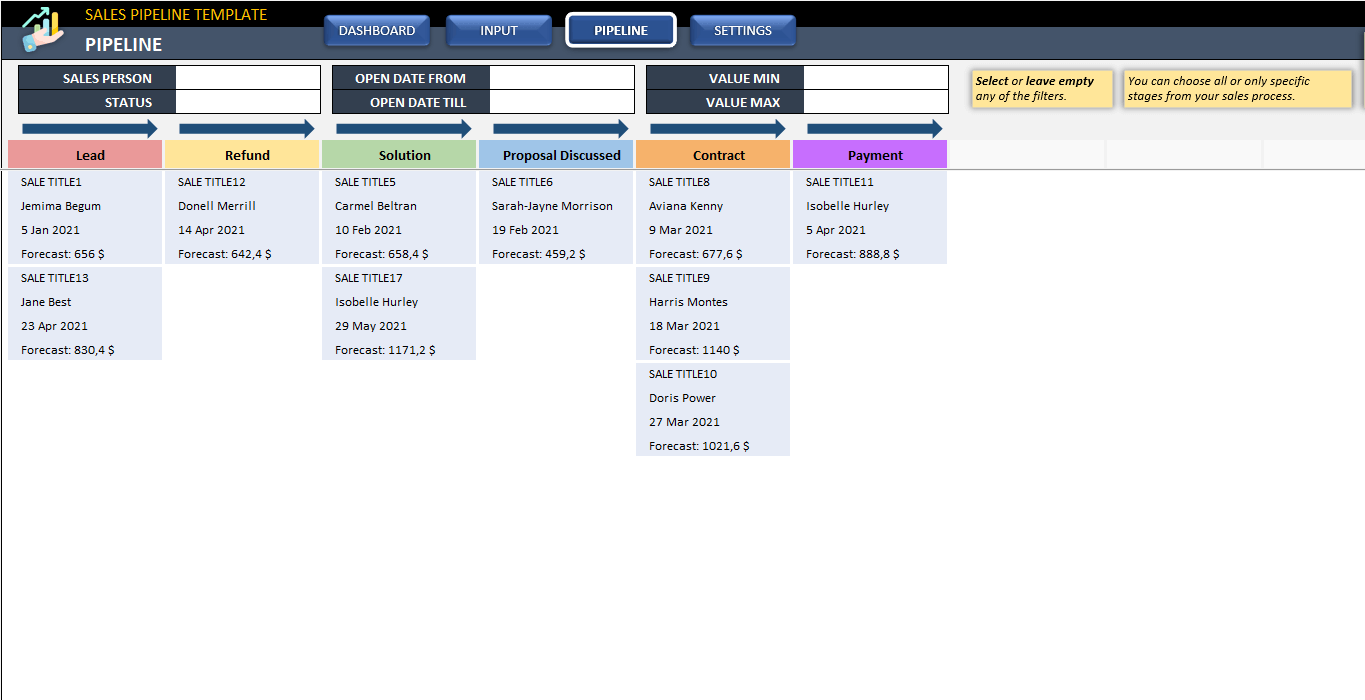
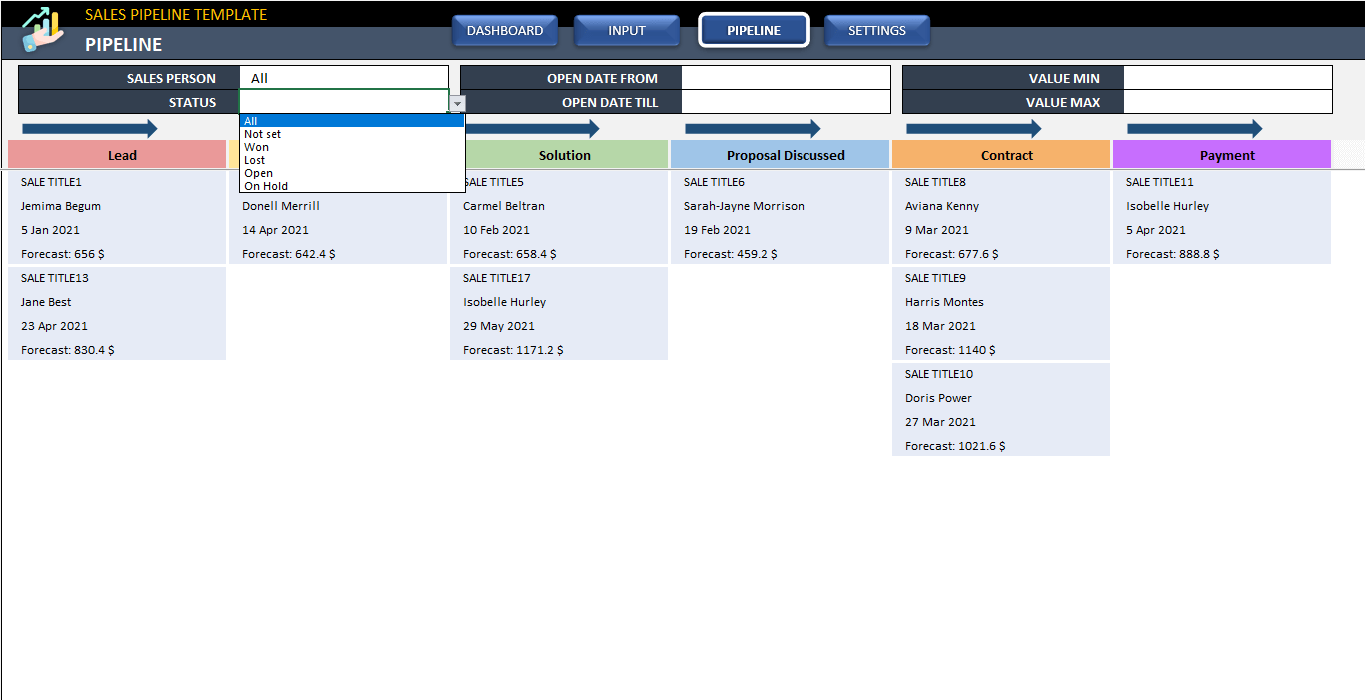
Pipeline:
This section provides a visual representation of each chosen stage. You can select the stages from the dropdown button. In addition, you can adjust the order of the columns. Again, you will be warned when the same stage is selected more than once.
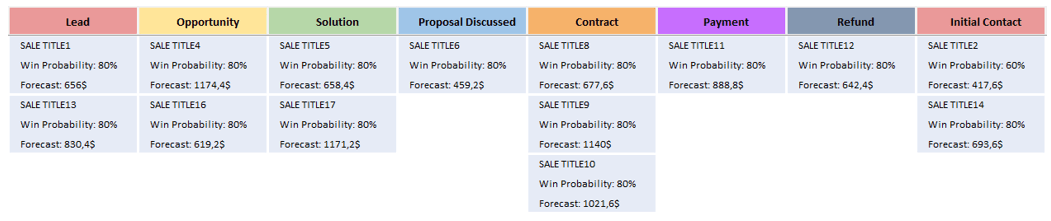
Besides that, you can add new stages by using empty columns. These additional columns are ready in advance, so you can easily add new stages by selecting the stage name from the drop-down menu.
Similar to the titles in the Input section, you can select the information shown on each card from the Settings section (Show on the pipeline). The sales data inputs marked with “X” on the Settings sheet will show up in the pipeline. Thus, you only see the information you need.
In addition, there are filtering options on top of the pipeline. So, you can filter the pipeline by salesperson, status, open date from/till, and min/max value.
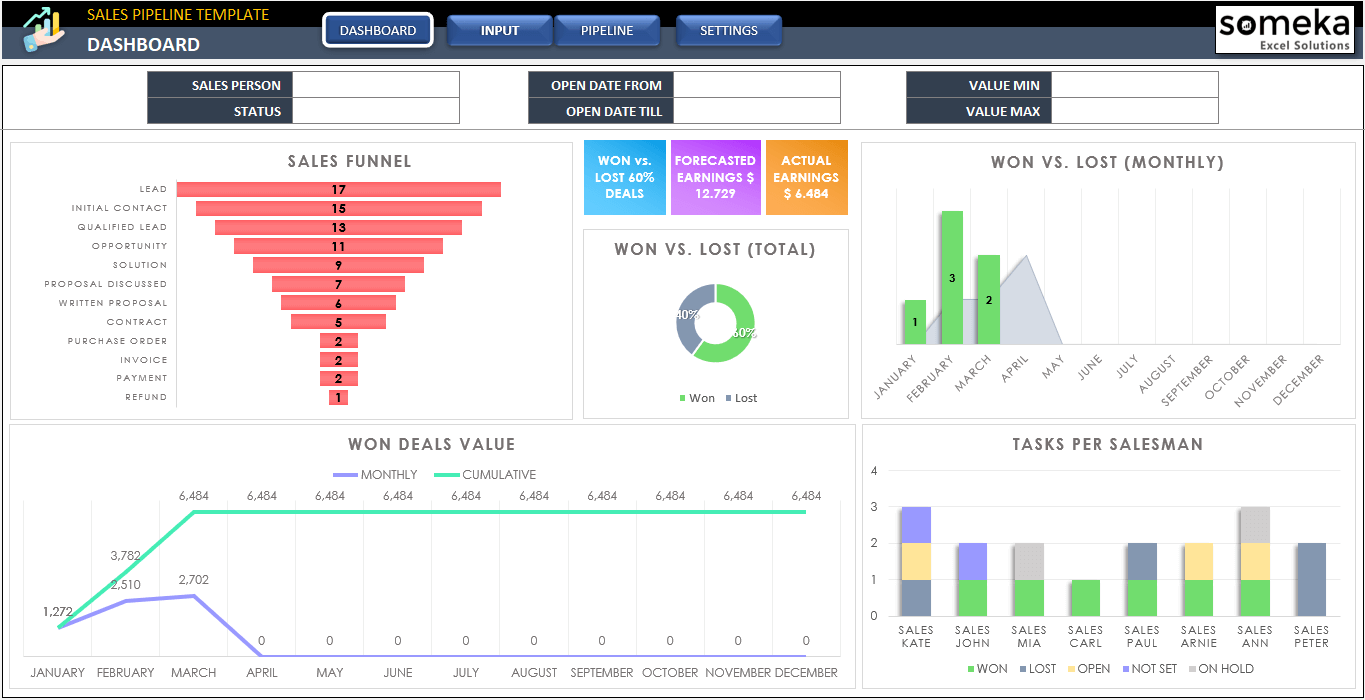
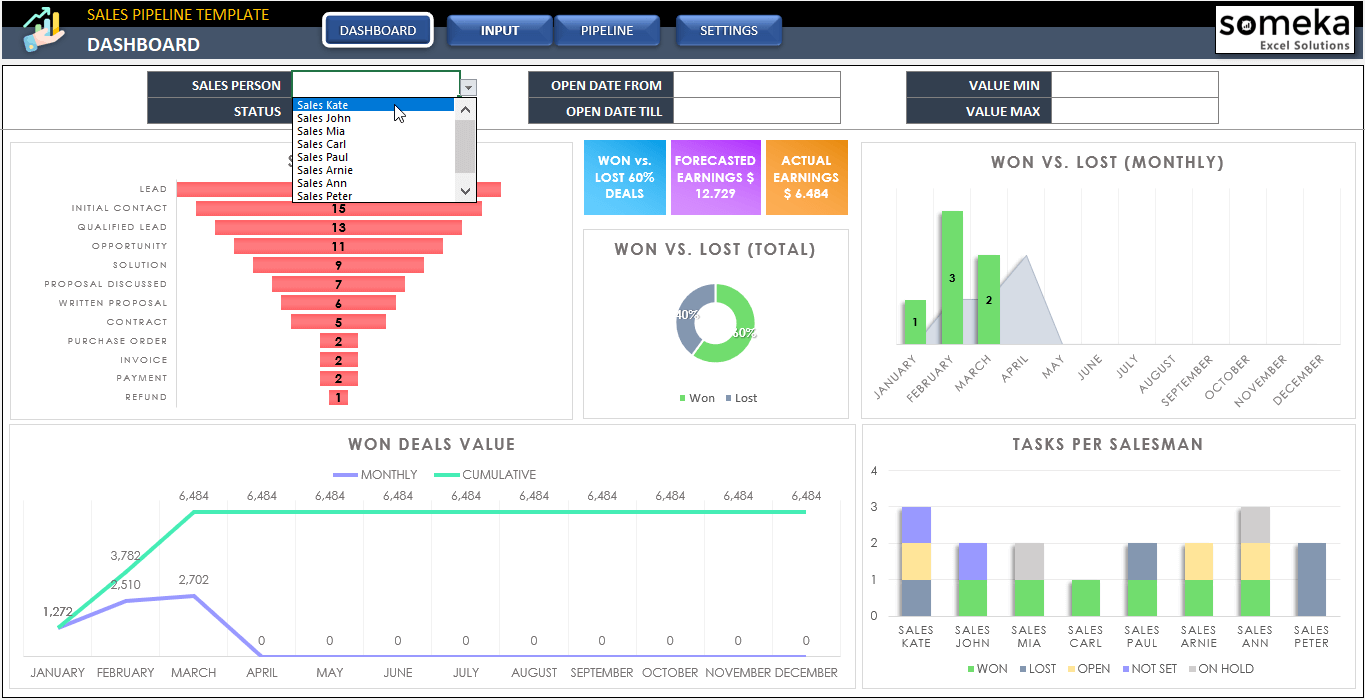
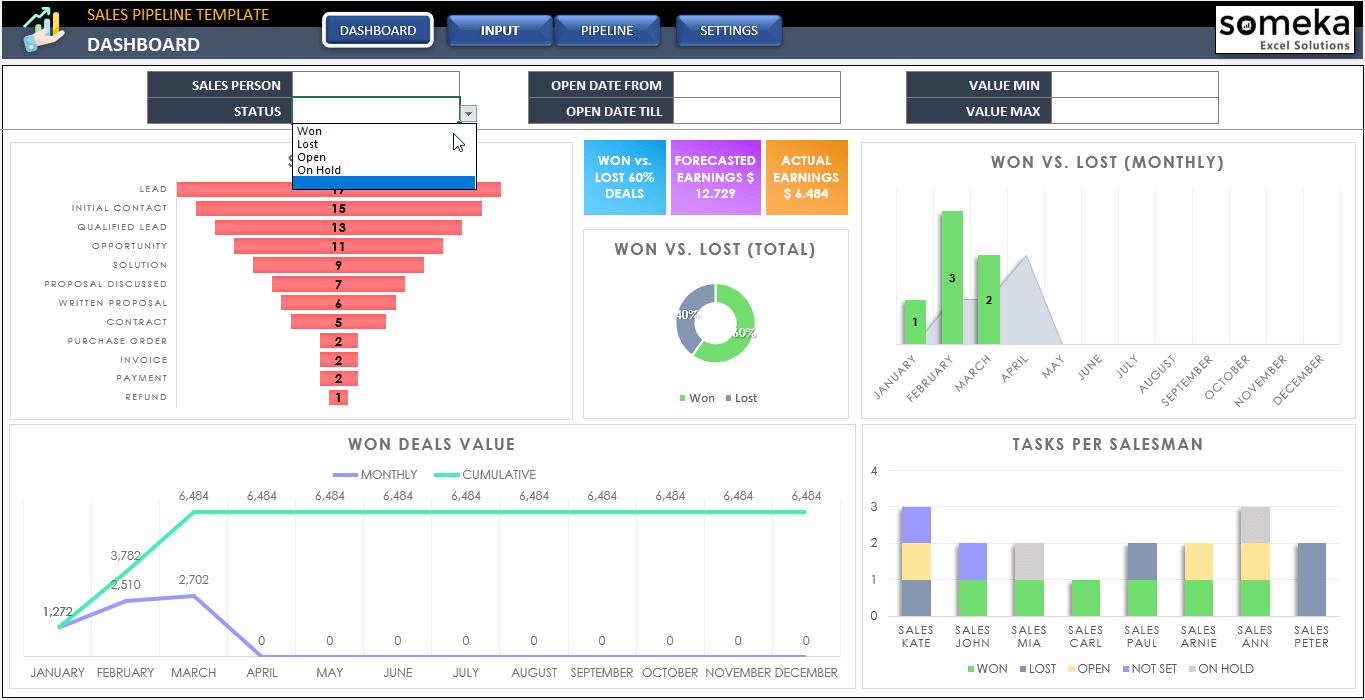
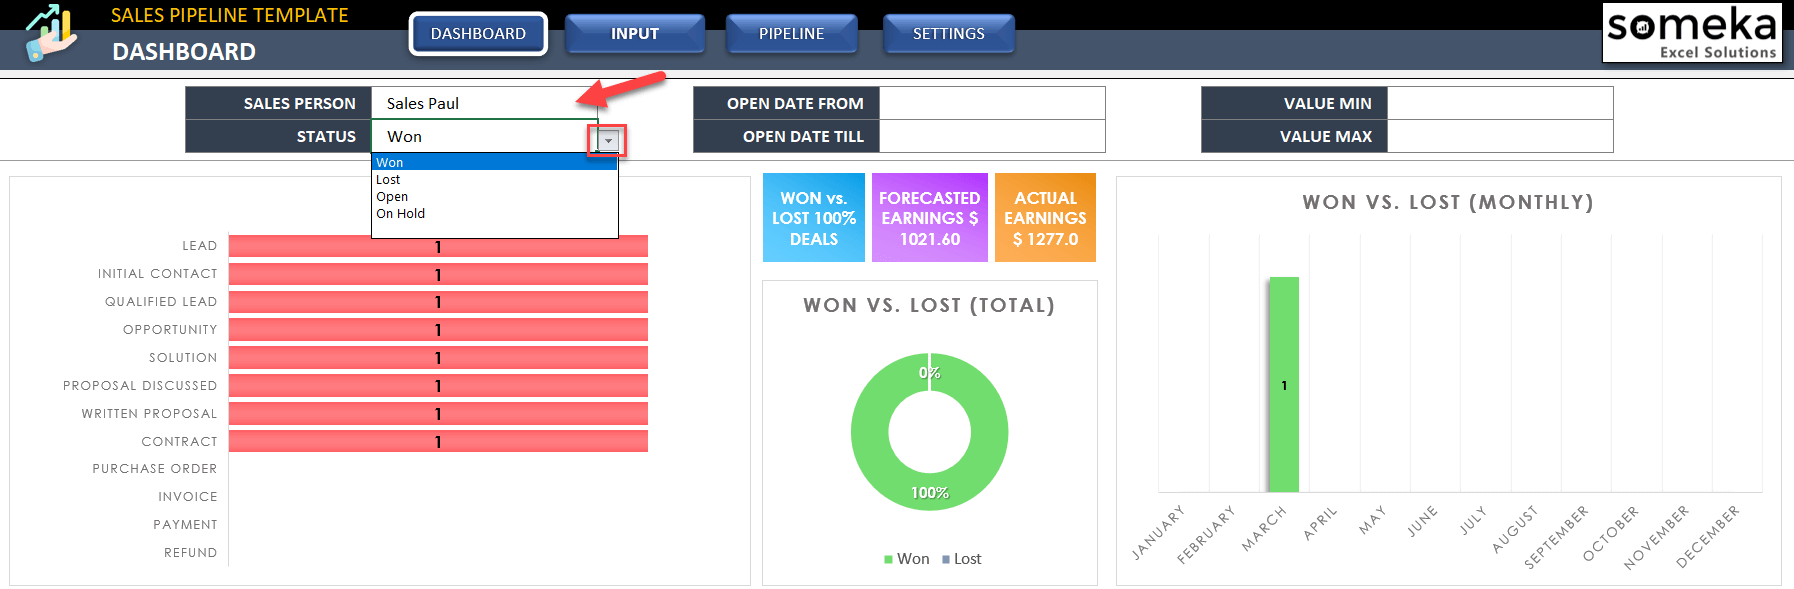
Dashboard:
The dashboard section serves as a visual summary of the whole sales pipeline sheet. In addition to won vs. lost percentage, forecasted earnings, and actual earnings information, you may also find charts and graphs for sales funnel, won vs. lost (total and monthly), won deals value, and tasks per salesman.
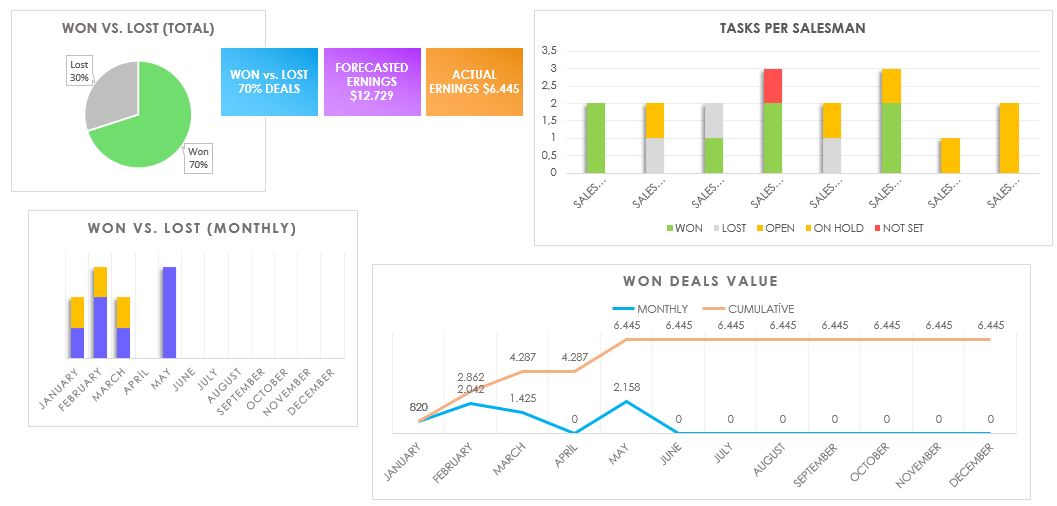
Finally, you can filter the outputs for the same categories as we mentioned above in the pipeline section.
Track performance, manage budgets, and seize every client opportunity with our lead-to-deal quotation system. Boost your sales performance today!
Sales Pipeline Excel Template Features Summary:
- Create sales pipeline in Excel
- Track your sales in all stages
- Informational notes included
- No installation needed. Ready to use.
- Works both on Mac and Windows
- Compatible with Excel 2010 and later versions
- Does not include VBA code and macros
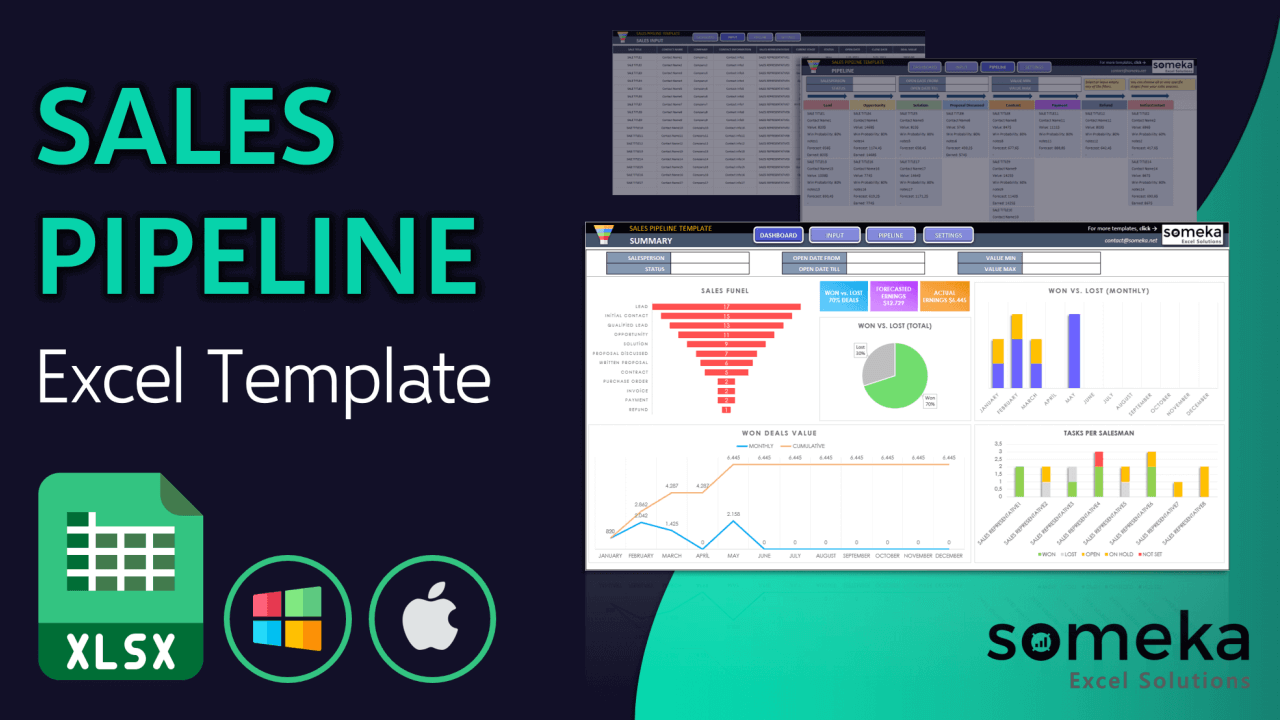
PRODUCT VIDEO
Watch the video below to see the template in action! Presentation also includes usage notes, explanations and tips & tricks about the template.
FREQUENTLY ASKED QUESTIONS
Sales Pipeline FAQ
Monitoring the sales pipeline gives you a visual indication of where all of your prospects stand in the process. This makes it easier to calculate potential revenue and measure the success of your business. Seeing a snapshot of your business health enables you to manage what you measure, helping you track your progress.
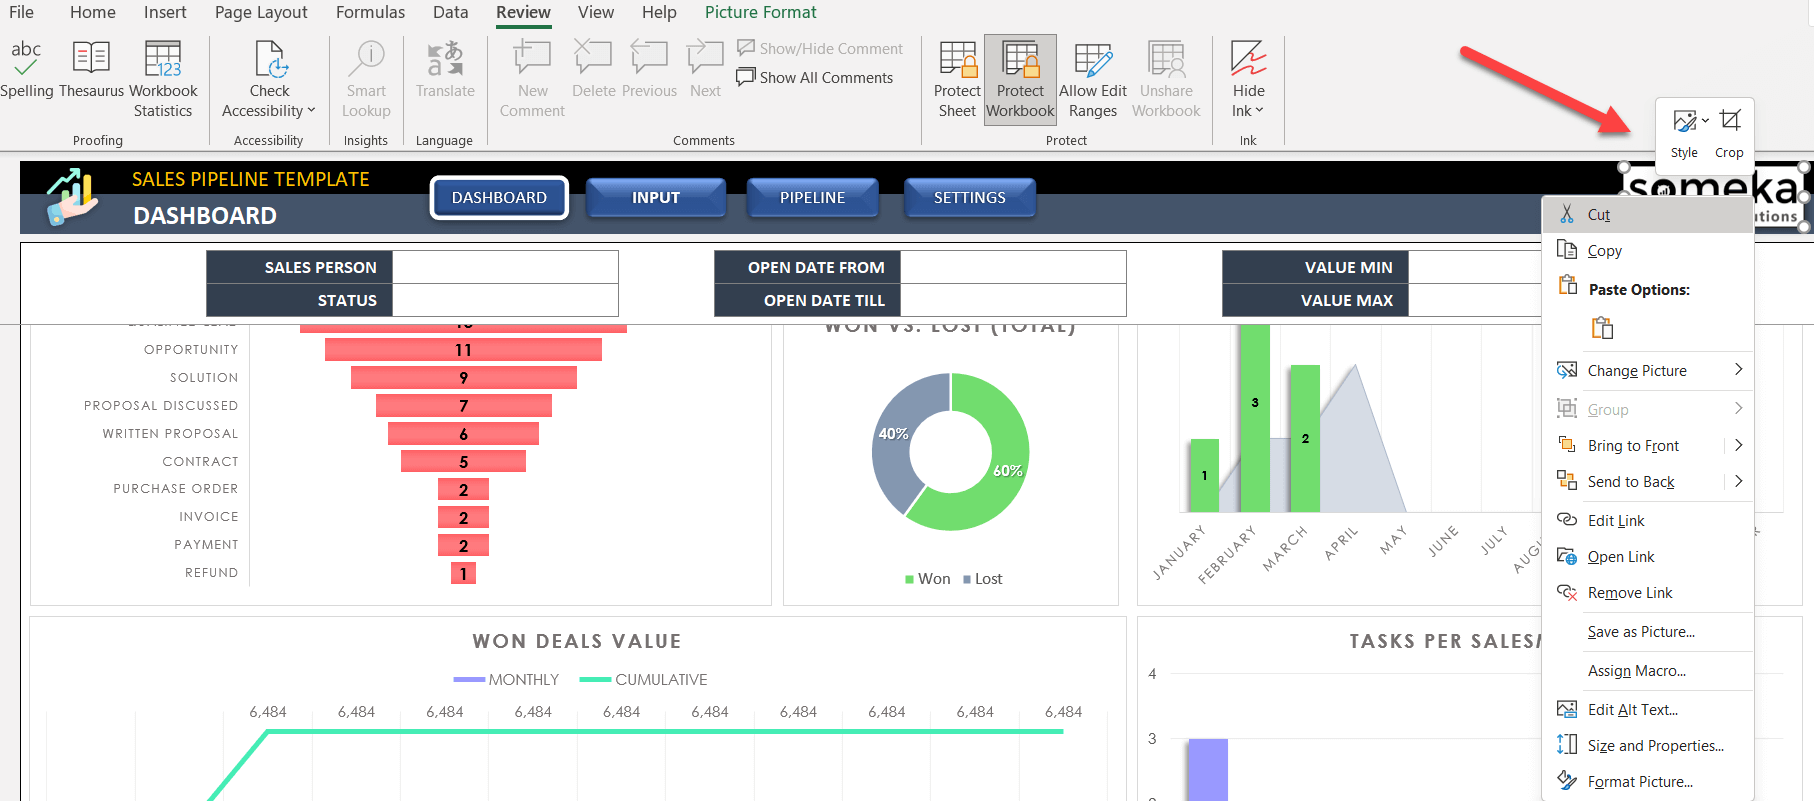
After purchasing a full version, you will have access to the password that unlocks the sheet and enables you to make changes to the logo. To begin, right-click the logo and select “Cut” as demonstrated below.
To utilize the template optimally, we advise beginning with the Settings section, then moving on to the Input, Pipeline, and ultimately viewing the Dashboard to observe the complete output of the template.
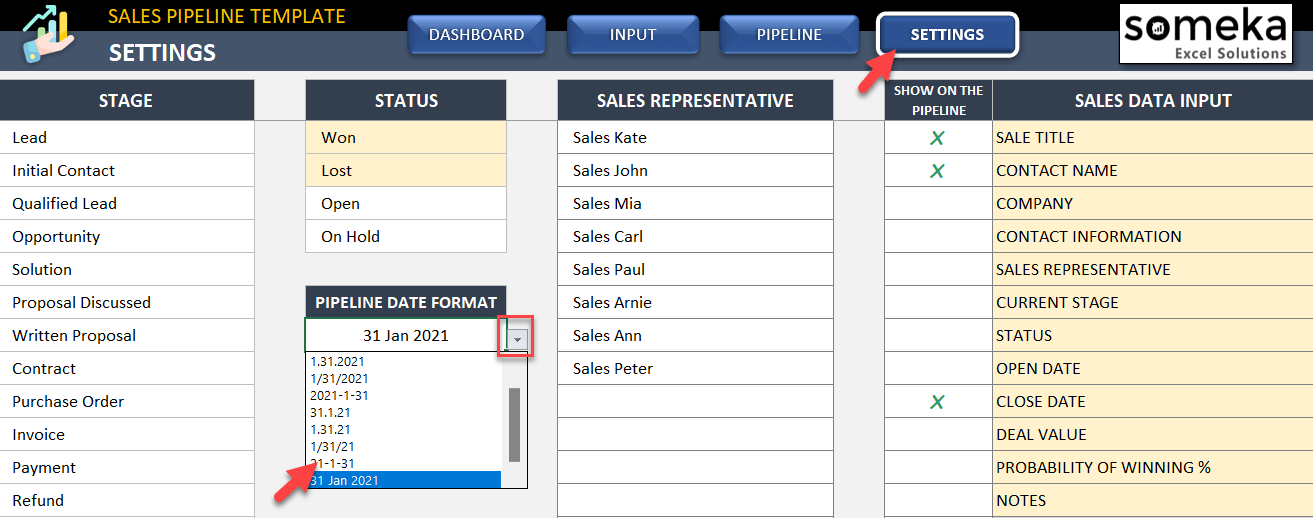
To change the “Pipeline Date Format”, open the settings sheet and locate the drop-down menu. You can then select your desired style.
After filling out the Settings and Inputs section, select the Dashboard tab and choose a salesperson’s name. Additionally, you can choose various statuses and view the results of their performance in a variety of shapes and graphs.
The size of the sales pipeline depends on the sales structure of the business. The way from the first contact with the lead to the refund might sometimes be shorter than usual. But in general, the purchase funnels include mostly 7-12 steps.
USER REVIEWS & COMMENTS
17 reviews for Sales Pipeline Excel Template
You must be logged in to post a review.
RELATED TEMPLATES
-
 This product has multiple variants. The options may be chosen on the product page
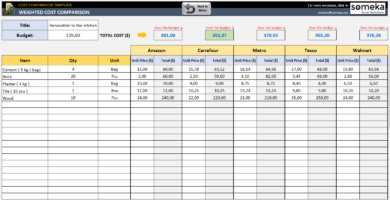
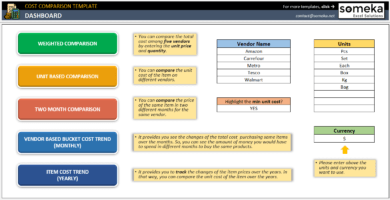
Cost Comparison Excel Template
$29.95 – $59.95Cost comparison spreadsheet in Excel. Compare prices from multiple vendors. Weighted cost analysis and printable dashboard with charts. Ready to use.
-
This product has multiple variants. The options may be chosen on the product page
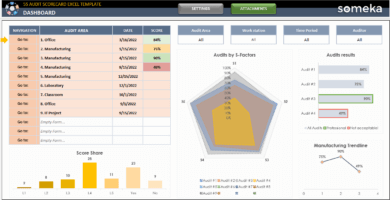
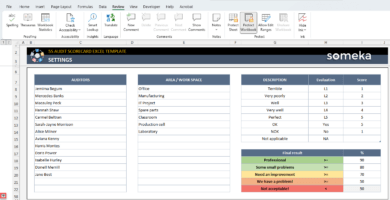
5S Audit Scorecard Excel Template
$34.95 – $69.95Process management tool in Excel. Assess your workplaces in the 5S Audit framework. Auto radar chart generator & professional dashboard included.
-
This product has multiple variants. The options may be chosen on the product page
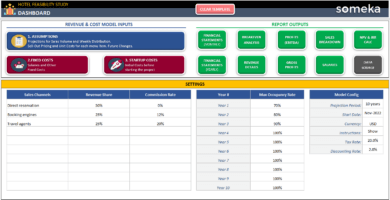
Hotel Feasibility Study Excel Template
$99.95 – $199.95Hotel Financial Model Excel Template will allow investors or business owners to make financial projections and decide on their investment projects.
-
This product has multiple variants. The options may be chosen on the product page
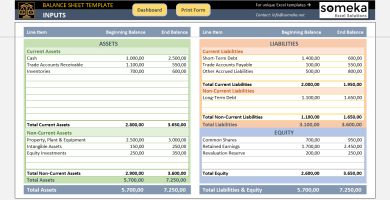
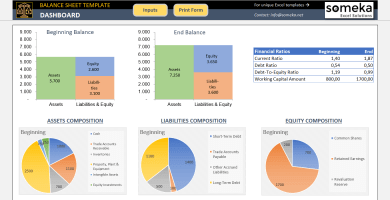
Excel Balance Sheet Template
$29.95 – $59.95Balance Sheet Template in Excel spreadsheet. Automatic dashboard with charts and financial ratios. Easy-to-edit & ready-to-print. Export to PDF.
-
This product has multiple variants. The options may be chosen on the product page
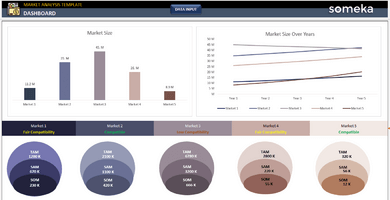
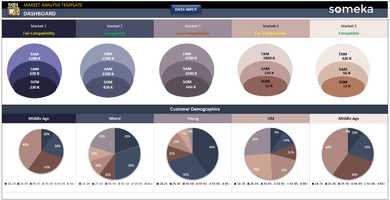
Market Analysis Excel Template
$29.95 – $59.95Creating visual market analysis in Excel. Enter your data regarding all demographics. Dynamically generate the market landscape. Ready to print.
-
This product has multiple variants. The options may be chosen on the product page
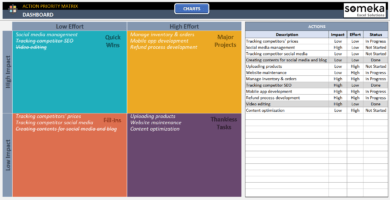
Action Priority Matrix Excel Template
$29.95 – $59.95Excel spreadsheet to prioritize your actions. Printable effort and impact matrix with professional dashboard and dynamic charts. Ready to use.
Irma Raymond –
I purchased the Multi-User version and we are satisfied with it in sales team, we can track what are we doing and we are more energetic because we can see visually the changes we make for the business, thanks Someka
Mohammad Ghiasi –
Isnt it better to change the place of settings? put it in the first sheet.
Someka –
Hello, thanks for your suggestion. We will send it to the developers. But having the Dashboard or Menu on the first sheet works better with our experience for customers.
Eric. G –
Does this template have an onilne version?
Someka –
Hopefully yes, we have created the sales pipeline google sheets template. Please check it.
Terry –
Is that mandatory to add email of each sales person?
Someka –
Hi there, no it is not a mandatory option, you can easily skip it if you don’t have access to sales person’s email.
Jane. K –
Is that possible to add more estages to this templaye?
Someka –
yes, surely it is possible, you have access to add more stages from the Setting of this template.
Marco Dijolik –
Hello, thanks for the usefull template. I have a question, how I am suppose to change the date format to month, day and year?
Someka –
Thanks for your nice words. To change the Pipeline Date Format, please open the Settings sheet and find the Date Format column, from here by simply clicking on the dropdown menus, you can select the date format that suits your need.
Dwain H –
great app. One question for you:
Please let me know what the charge would be to duplicate the pipeline into additional tabs in the same document, having all the data populate into one Dashboard and Pipeline (perhaps on a third tab named “Totals”)
Someka –
Hello Dwain,
After displaying your sheet tabs, you may duplicate the sheets.
But in order to use the pipeline for different people, you have to update the formulas on the backside in order that filters can work separately.
This will need comprehensive customization on the template.
We, as Someka, make ready-to-use templates. If you need professional assistance for modifications or you need a tailor-made template, we recommend you to visit our trusted development partner Excel Rescue’s page from the link below:
https://www.someka.net/custom-services/
After you send your task, the team will contact you with an anticipated duration and price quote.
Hope this helps!
Rosaleen E –
Hi, I’ve reformatted the input value column to show a different currency from $ to £ (GBP) but it still shows $ on the dashboard and the pipeline. How do I correct this please?
Someka –
Hi Rosaleen,
When you change the currency on the Input sheet, you have to also update formulas on the hidden “Calc” sheet.
To see the hidden sheet, you have to first display sheet tabs, then right-click on one of the tabs and click “Unhide” and select the Calc sheet.
Then both the Dashboard and the Sales Pipeline have the £ currency:
Reece B –
hi excel is very nice but a tiny request how can i change default date format?
Someka –
Hi Reece,
Date format selection is included in this template so that you can easily change the date style shown on the sales pipeline. Please see the image below.
If you need help with customization or have technical questions such as how to customize the template please feel free to get in touch with us at contact@someka.net
Reece B –
wouldn’t it break the formulas if i change it?
Someka –
Hi Reece,
It does not lead to any accidental change.
You may easily use the dropdown option.
Brock B. –
I searched a lot funnel shaped graphic for sales pipeline.
I cant create this graphic on my excel.
Finally I found it in your template. Thanks.
JUAN CARLOS PORTILLO ABALIA –
Da gusto ver las plantillas lo bien que estan hechas un gustazo gracias
Suzy –
Hi how to change the currency from $ to £ (GBP) in free file? thanks
Someka –
Hello Suzy,
For this specific purpose, our developers have included a currency option under “Settings” sheet. Just include pounds in this area to change the $ sign:
Samantha –
Is it not possible to add extra info to this sheet? I’m trying to create a new sheet but cannot make it happen. Any help is appreciated!
Someka –
Hi Samantha,
After displaying your sheet tabs, you may duplicate the sheets. Likewise, should you need to create new sheets you can add a new sheet unlocking your template and sheets. Just click on the “+” sign and your new sheet will be added to the template.
Rick B. –
Hello, I’ve purchased the single user license and have done some customization, however now the data is not being populated in the Dashboard, nor the Pipeline. Can you help?
Someka –
Hi Rick, Thank you for reaching out to us.
It’s strongly likely that your file is corrupted due to customization or formatting. Please check your data on a fresh file, should the issue continue please email your file to us at contact@someka.net and we’ll be happy to support.
Rick B. –
Solved, thanks
Olivia –
On the input tab if you select “won” should that not project in the sales funnel? As of now when a client passes through to “won or lost” it does not reflect or??
Someka –
Hello Olivia,
The Sales Funnel takes into account the “Stages”, not the “Status”. Won or Lost are the Status Options. If you want to reflect these to the sales funnel, you have “Deal Won” and “Deal Lost” options on your Stages.
MANUEL GONZALEZ –
muy completa ¡¡
Excelente ¡¡
Maria –
I was browsing through the downloaded and template without changing the contents. When I finally got to the 4 reporting tools. Thank you.