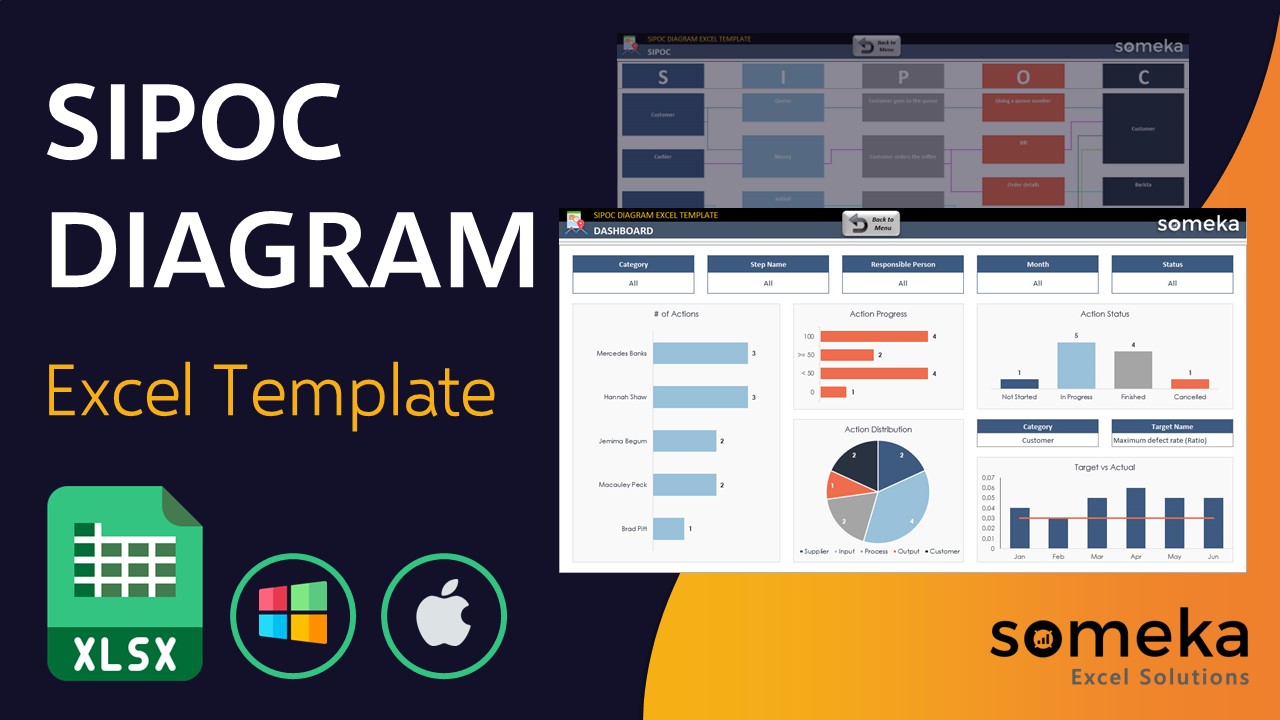
SIPOC Diagram Excel Template
SIPOC Diagram generator in Excel. Create a high level process map and increase transparency. No installation needed. Ready to use.

TEMPLATE DESCRIPTION
Do you struggle to improve your company’s processes? Do you require an all-in-one template to measure all aspects of your business? So, this SIPOC Diagram Excel Template is exactly what you need!
Above all, SIPOC stands for Suppliers, Inputs, Process, Outputs, and Customers. By using data from these five areas, you can create a process map that provides a high-level overview of a Six Sigma method.
While business processes can be complex, the SIPOC Diagram Excel Template is a simple way to see how each component of the process fits together.
What are the benefits of SIPOC Six Sigma Chart in Excel?
- Use it as a starting step of problem-solving in workflows
- Ensure everyone is on the same page before starting a process
- Use it in further steps of Six Sigma DMAIC strategy
- Assist teams in determining who is the true customer, who are the process suppliers, and so on.
Sections of SIPOC Diagram Excel Template:
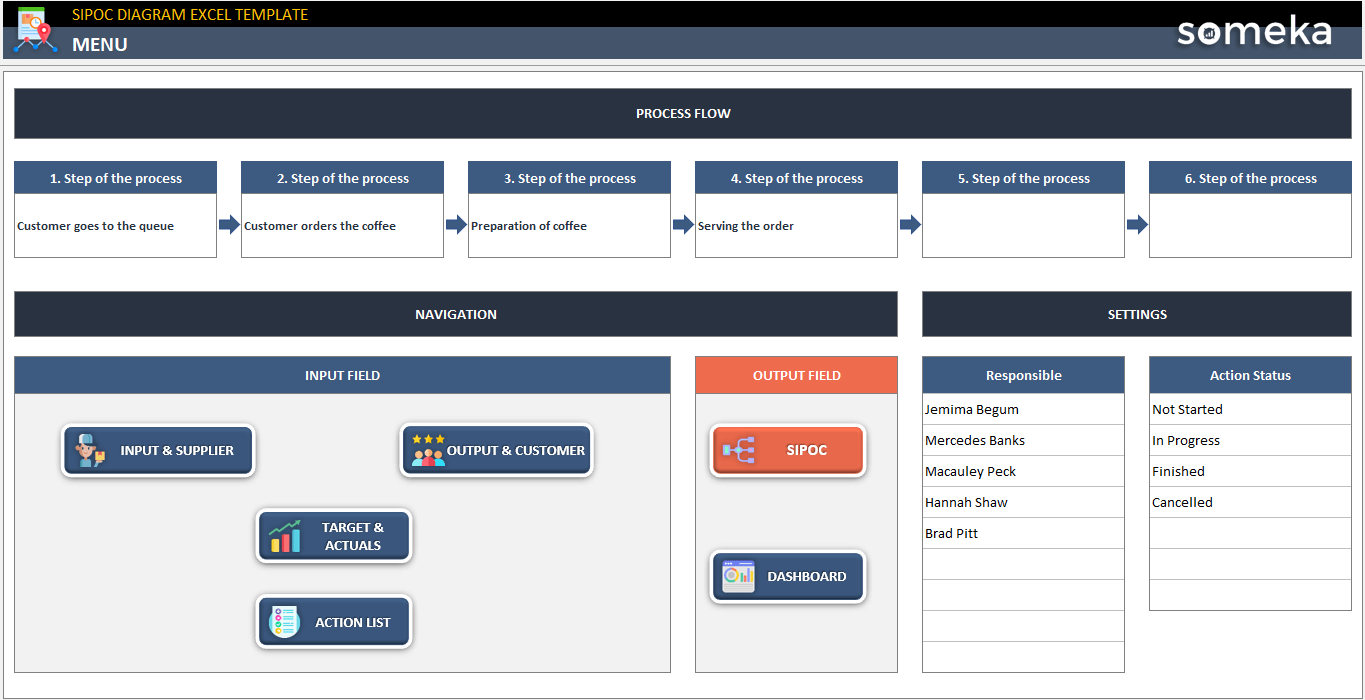
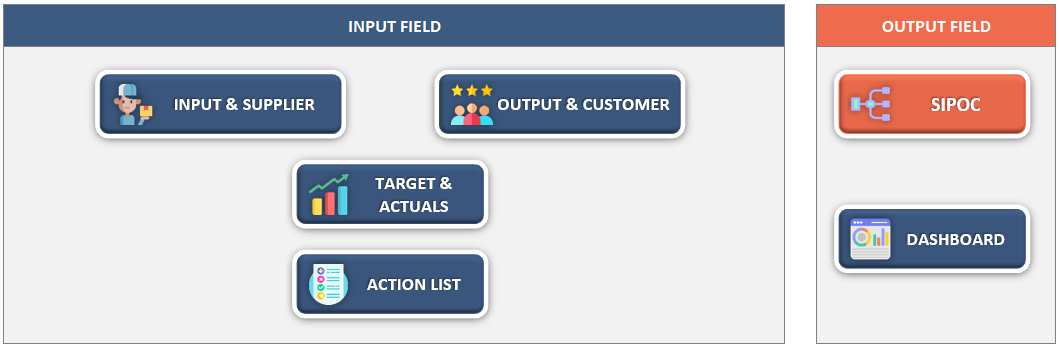
1. Menu
Basically, this SIPOC chart has 7 different sheets. Let’s check them one by one.
Simply enter your process flow step by step in the Menu. You may need some time to go over it with your team and figure out all of the steps involved in producing a service or product.
There are also two other sections in here: navigation and settings.
1.1: Navigation: Click on each button to go to the specific sheet, which is a great place to quickly go over and double-check your work.
1.2: Settings: This is an extremely important part of the SIPOC Diagram Excel Template; simply define the Responsible Person and add some terms for Action Status such as “in progress,” “completed,” and so on.
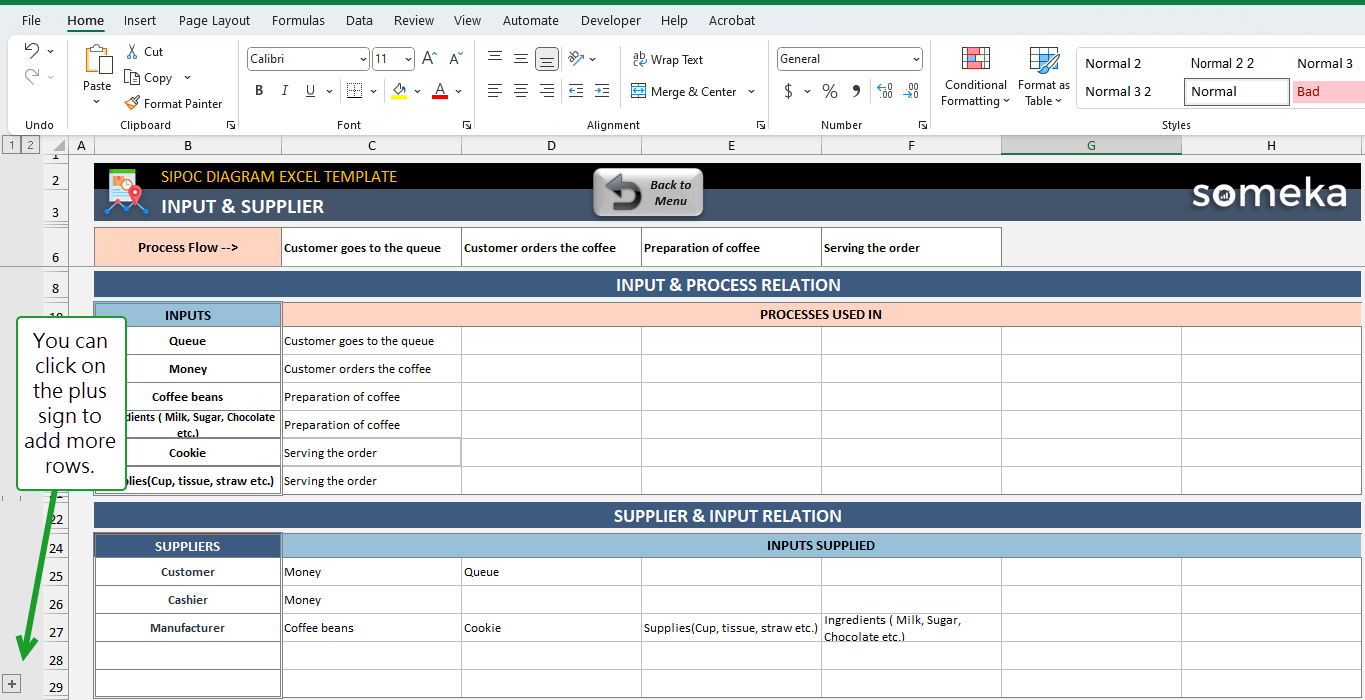
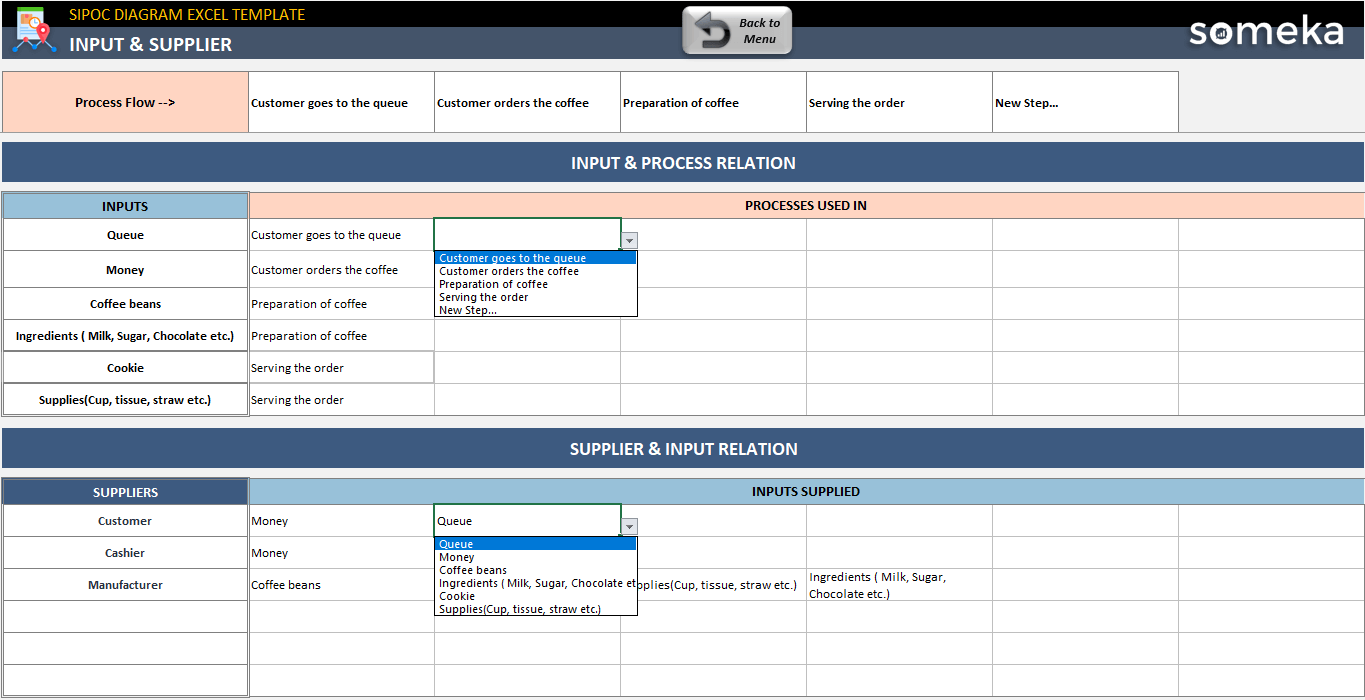
2. Input and Supplier:
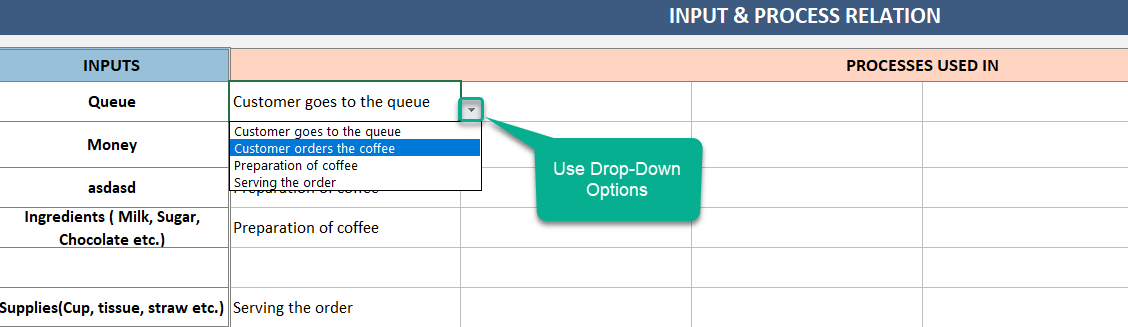
Firstly, in this sheet you have 2 different tables for: “Input and Process Relation” and” Supplier and Input Relation“. Then, add your Inputs and Suppliers, and then select “Process Used In” and “Inputs Supplied” from the dropdown menus.
To clarify, if you see red highlights, it means you have duplicate values.
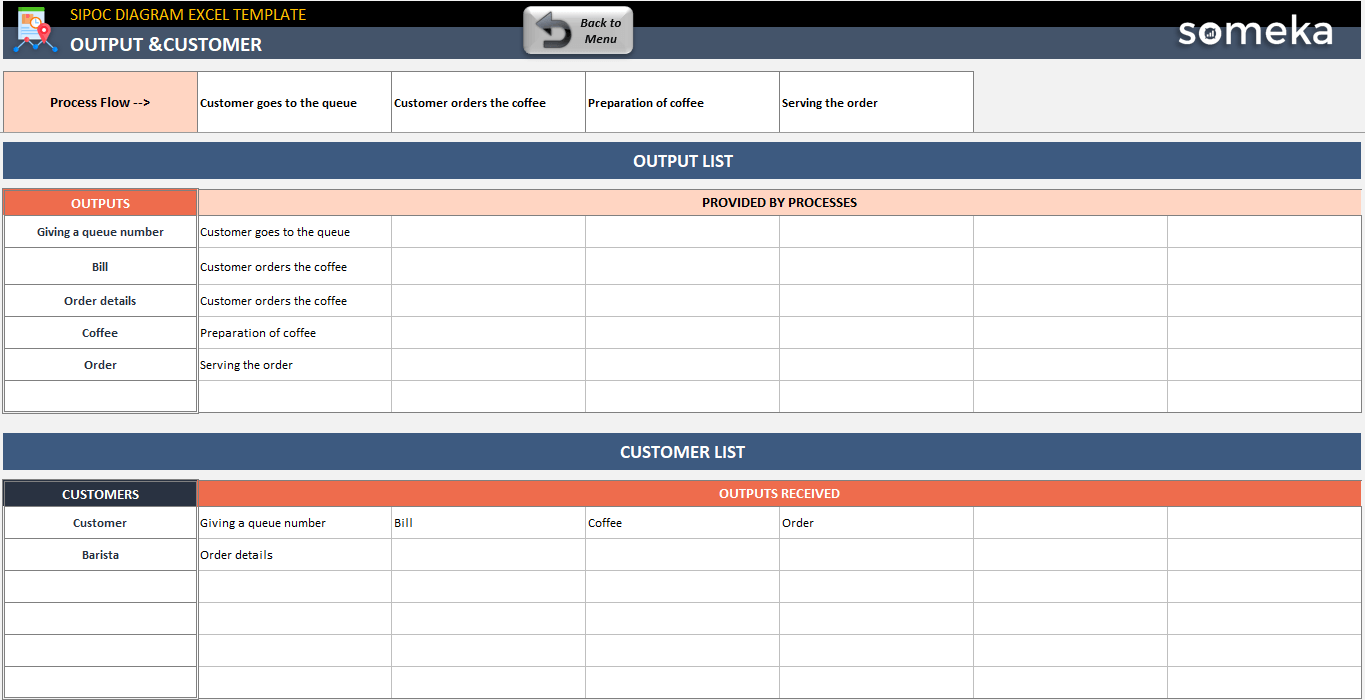
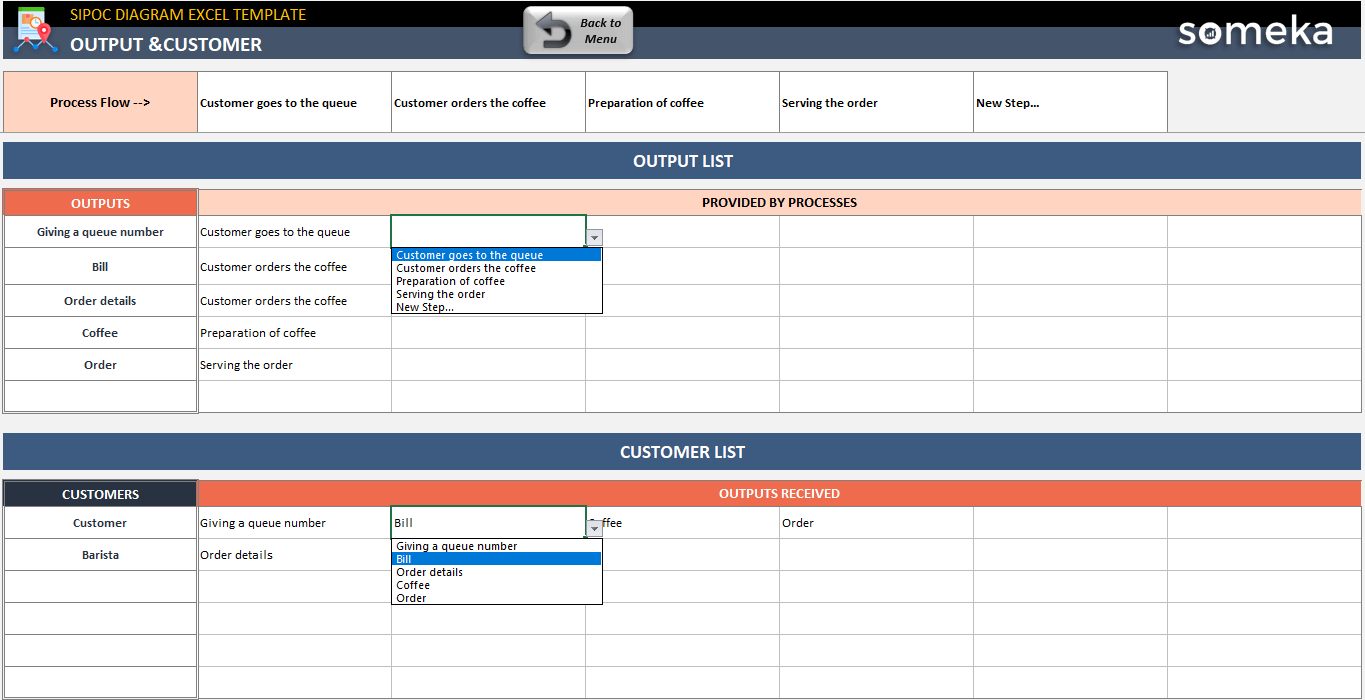
3. Output and Customer:
Secondly, follow the same steps as in the previous sheet to complete the “Provided by Process” for Outputs and “Outputs Received” for Customers.
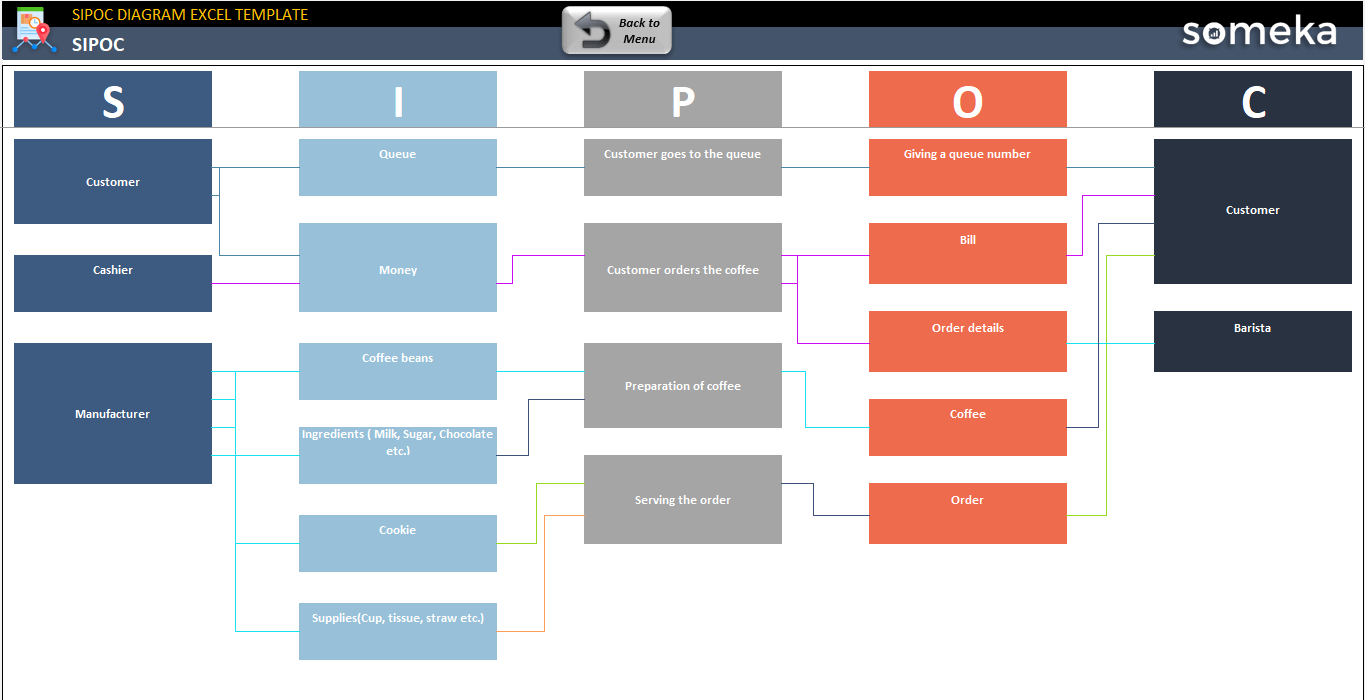
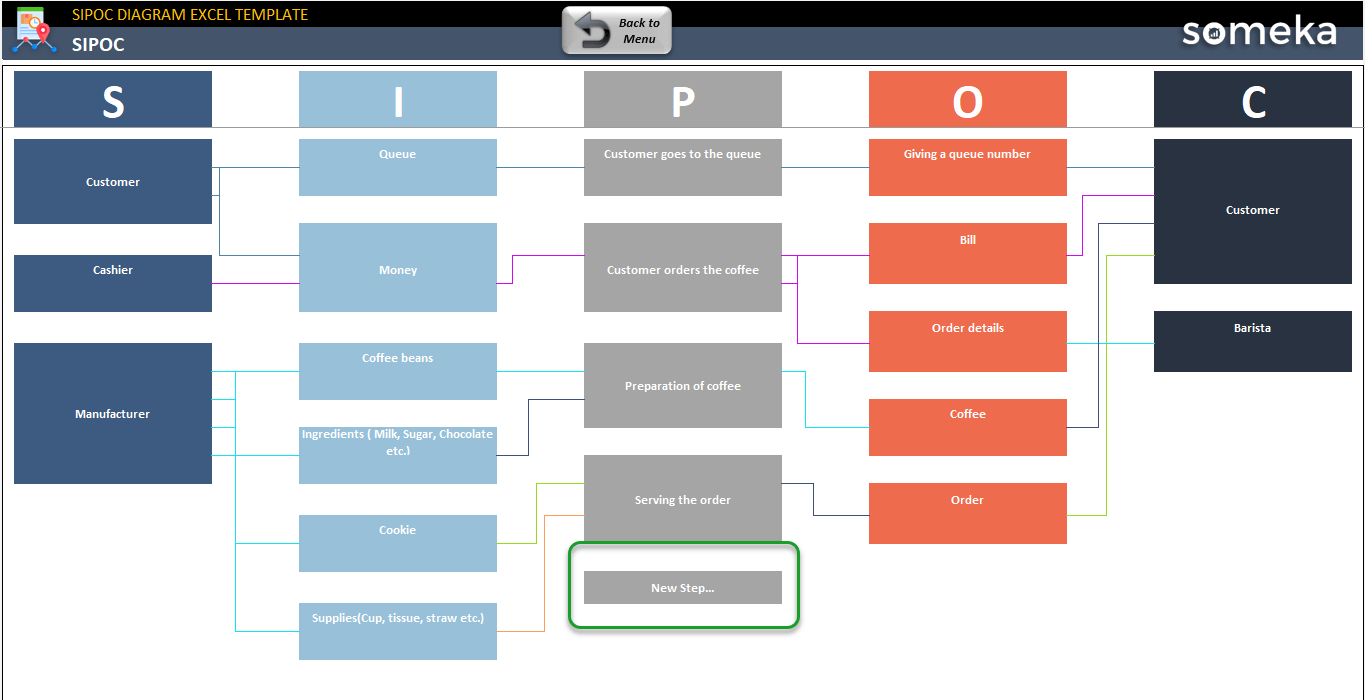
4. SIPOC Diagram Sheet:
In this section, you can see the SIPOC diagram, which illustrates the flow of work using elements and arrows.
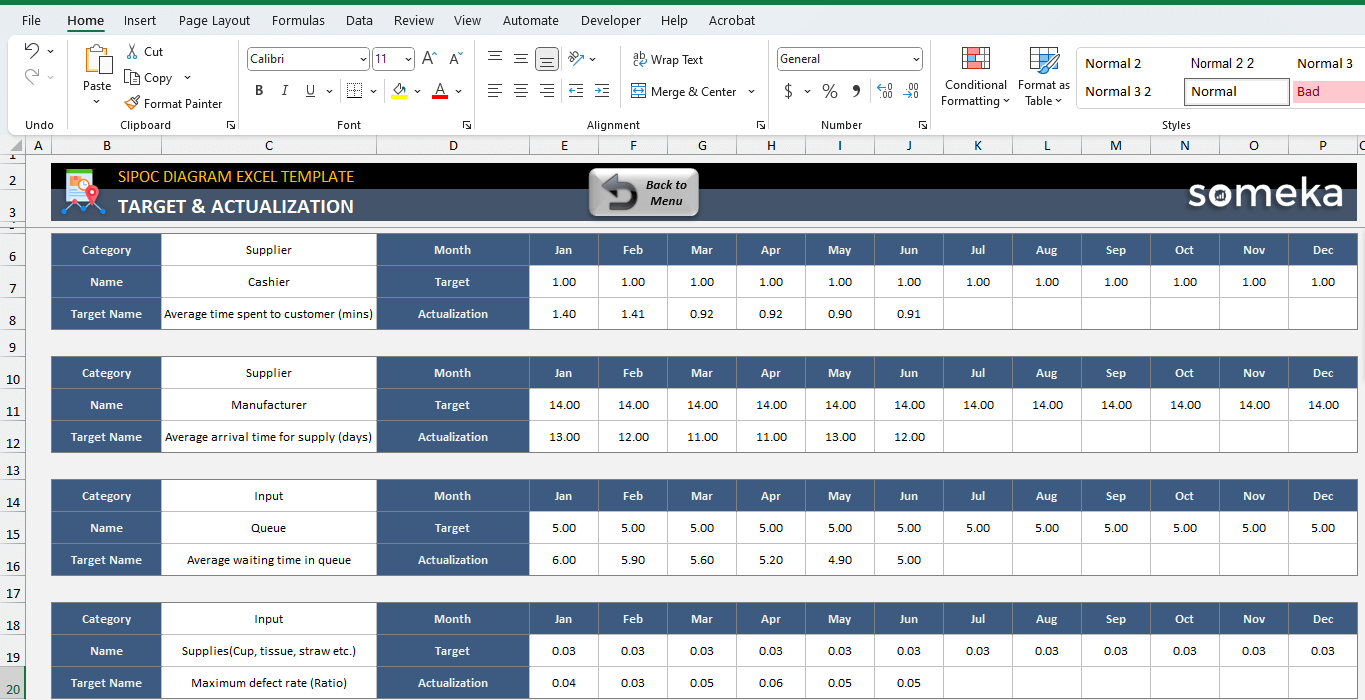
5. Targets and Actuals:

In this part, set targets for each Supplier, Input, Process, Output, and Customer element and track them. Additionally, you must select a Category name (Supplier, Input, Process, Output, Customer) and an element name to define a target.
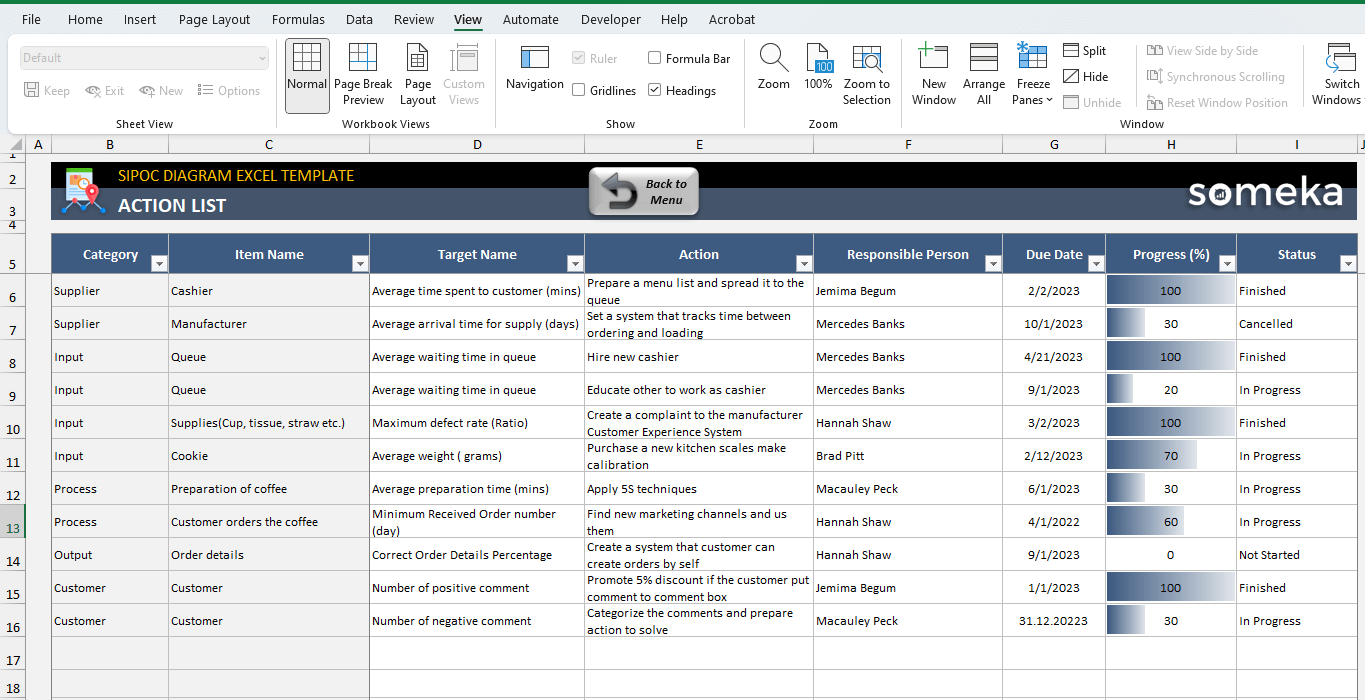
6. Action List of SIPOC Diagram Excel Template:
Gather your team to go over the Action List sheet in full detail. The, select Category and Item name from the dropdown menus and proceed to the next column.
Furthermore, assign an action to a Responsible person in this section. Also, you can Set a deadline for each action in this SIPOC Diagram Excel Template. Finally, revisit this sheet from time to time to update the status of work and see the progress ratio.
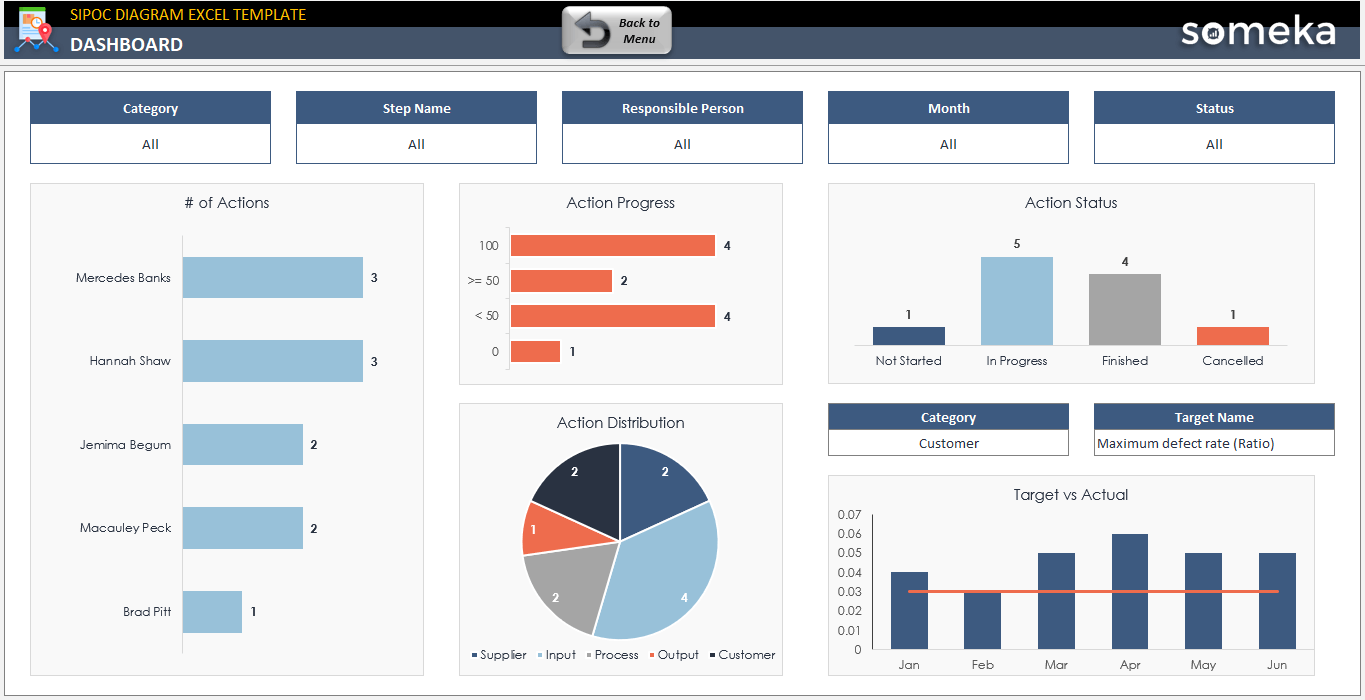
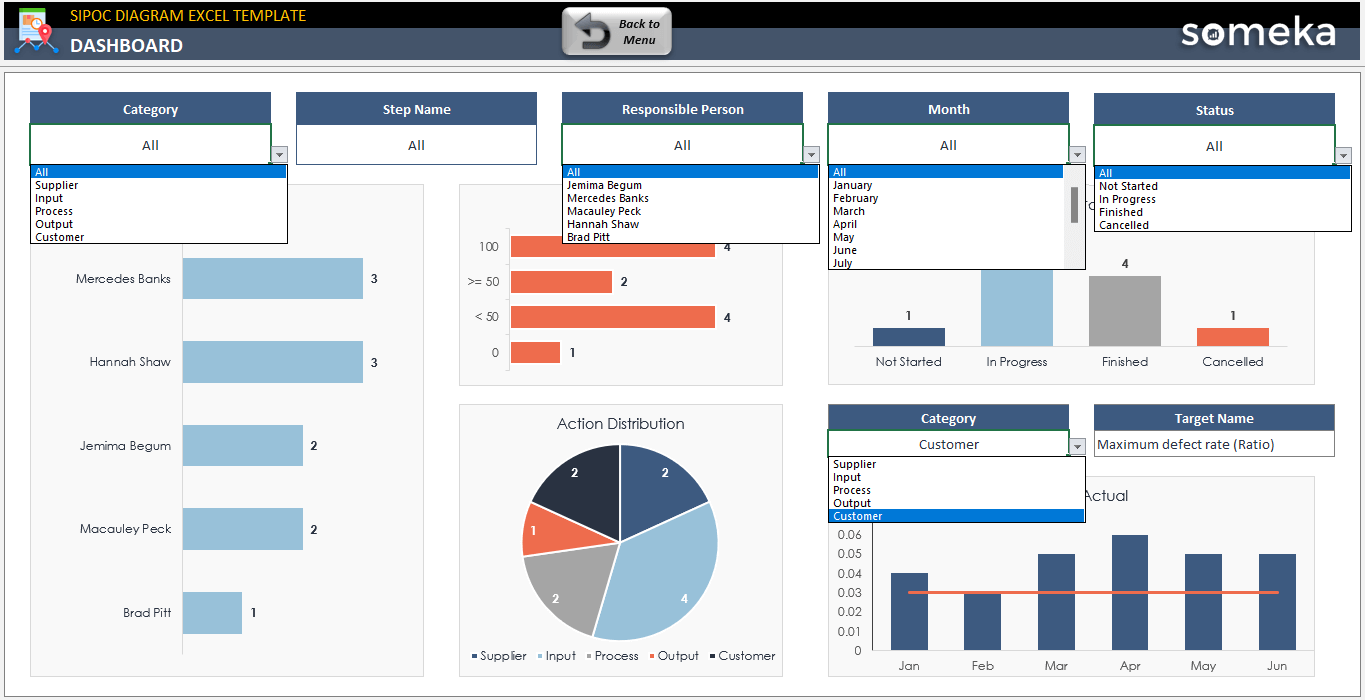
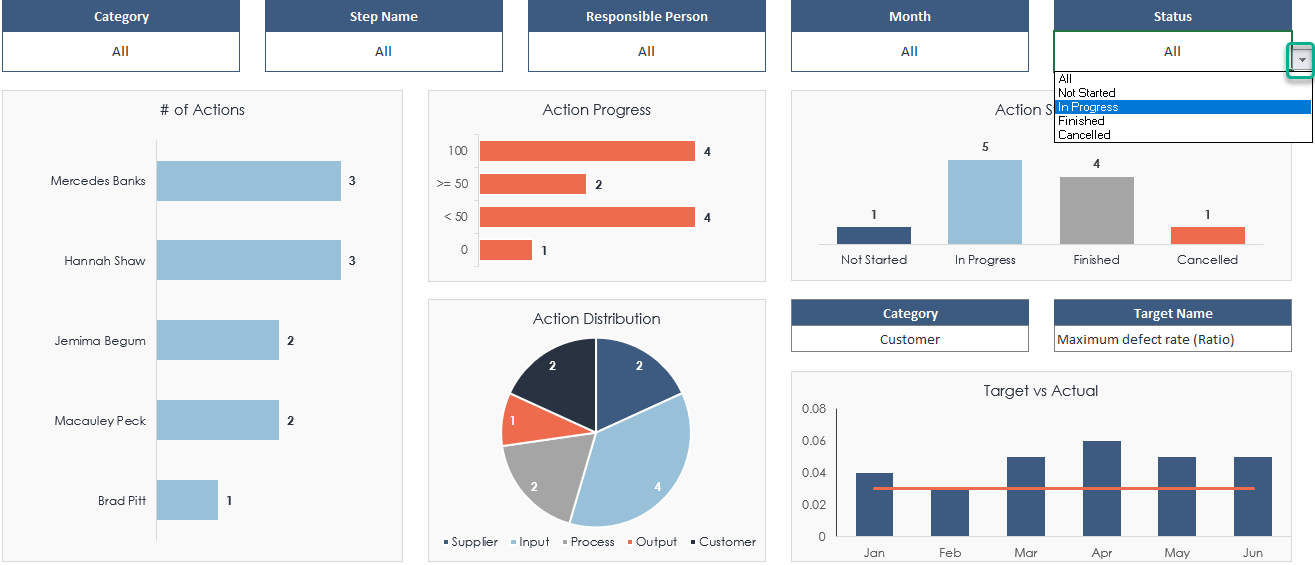
7. Dashboard:
Finally, here is a summary of your actions. You can simply filter the charts by using drop-down options to see better analytics. In addition, the status of the target can be found on the dashboard’s right side.
SIPOC Diagram Excel Template Features Summary:
- SIPOC Diagram overview in Excel
- Defining all the steps of process
- Action List to track the status of each task
- Ready to Print template
- Informational notes included
- Ready-to-use template
- Works both on Mac and Windows
- Compatible with Excel 2010 and later versions
- Does not include any VBA code or macros
PRODUCT VIDEO
Watch the video below to see the template in action! Presentation also includes usage notes, explanations and tips & tricks about the template.
USER REVIEWS & COMMENTS
6 reviews for SIPOC Diagram Excel Template
You must be logged in to post a review.
RELATED TEMPLATES
-
 This product has multiple variants. The options may be chosen on the product page
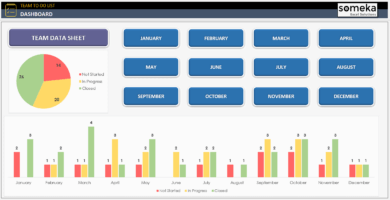
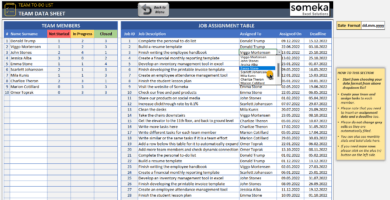
Team To Do List Excel Template
$34.95 – $69.95Excel Team To Do List Template is designed for task management and tracking of employees. Summary dashboard with charts. Editable & printable.
-
This product has multiple variants. The options may be chosen on the product page
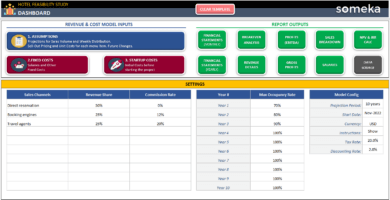
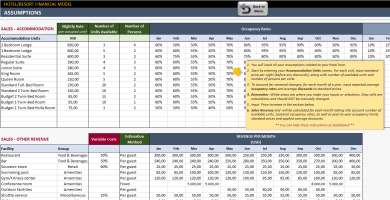
Hotel Feasibility Study Excel Template
$99.95 – $199.95Hotel Financial Model Excel Template will allow investors or business owners to make financial projections and decide on their investment projects.
-
This product has multiple variants. The options may be chosen on the product page
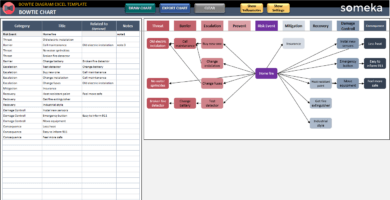
Bowtie Diagram Excel Template
$34.95 – $69.95Bowtie analysis tool in Excel. Visualize your risk pathways in a clean cause & consequence diagram. Fully printable with various color options.
-
This product has multiple variants. The options may be chosen on the product page
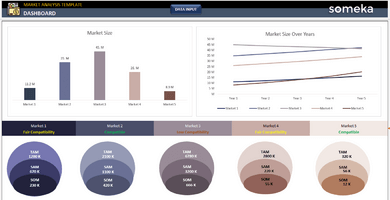
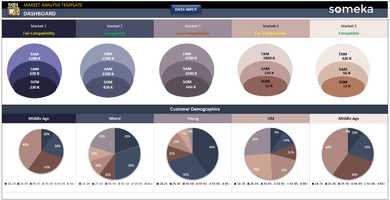
Market Analysis Excel Template
$29.95 – $59.95Creating visual market analysis in Excel. Enter your data regarding all demographics. Dynamically generate the market landscape. Ready to print.
-
This product has multiple variants. The options may be chosen on the product page
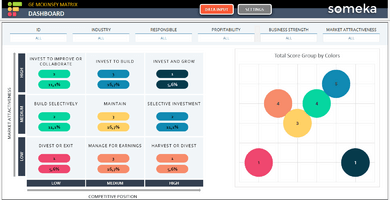
GE McKinsey Matrix Excel Template
$34.95 – $69.95Growth Matrix to evaluate business portfolio. Compare industry attractiveness and strength in a visual chart. Ready-to-use GE McKinsey Matrix Excel Template.
-
This product has multiple variants. The options may be chosen on the product page
5S Audit Scorecard Excel Template
$34.95 – $69.95Process management tool in Excel. Assess your workplaces in the 5S Audit framework. Auto radar chart generator & professional dashboard included.

Leon –
Great thx!
Andres M –
Puede ser en español?
Someka –
Hi Andres, thank you for your question! All our templates including SIPOC Diagram is in English but you can translate it into Spanish yourself. Because all our templates are fully editable.
Eric Dax –
Wow great app! Thanks for the information!
Allison Barton –
It seems nice but does it make the sipoc diagram?
Someka –
Hi Allison! Thank you for your question. Yes, the SIPOC chart in the template is drawn dynamically. It is formed according to your input.
Kelly W –
I would like to widen the columns. How am I going to do it?? Pls advice..
Someka –
Hi Kelly! To widen the column, you have to unlock the sheets with the password that you will find in the zip file. Then, go to View in the Excel ribbon, check Headings and now you can resize the columns by pulling at the margins of the headings.
Don Krager –
How many rows can we add to Input section?