Break Even Analysis Excel Template
Break Even Analysis Template. Calculate profitability point. Automated charts and dashboard. Instant download file in Excel. Works on Mac & Windows.

TEMPLATE DESCRIPTION
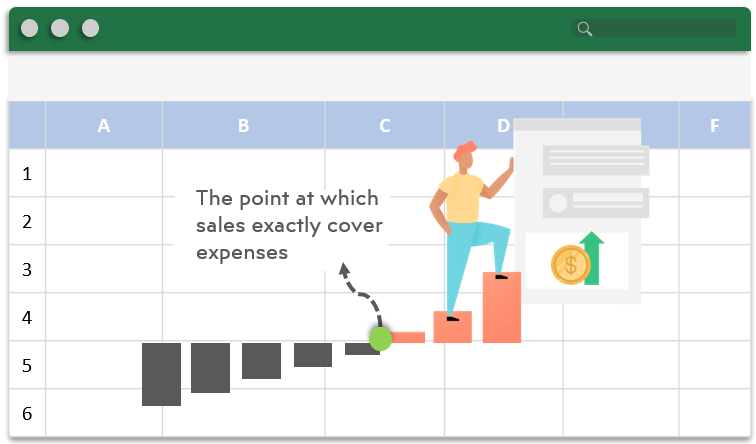
For any business or startup, it is important to estimate the point to start being profitable. So, this Break Even Analysis Template in Excel will provide a visual illustration of the estimated company properties with the right assumptions that could help you to decide. It is your revenue and cost assumptions that will be shaping the company that you are planning to establish.
The Break-Even Analysis Excel Template is an indispensable spreadsheet designed to provide businesses with a clear snapshot of their financial health. This tool will help you to determine the point where earnings offset expenditure, marking the transition from loss to profit.
With an intuitive format and diagram, this template facilitates precise forecasting and projection. You can set benchmarking standards and adjust pricing scenarios in alignment with desired profit margins.
Whether you’re determining the viability of a new venture, adjusting your pricing model, or gauging the potential impact of an upcoming scenario, our product ensures you have the data-driven insights.
Break Even Analysis Template Features:
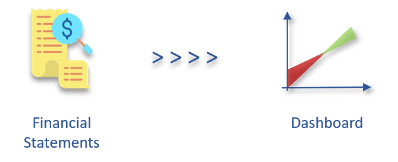
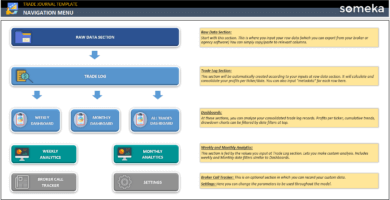
A Break-Even Analysis template is a tool to mainly identify the amount of cash inflow and outflow during the following periods and much more. Basically, it consists of two main parts:
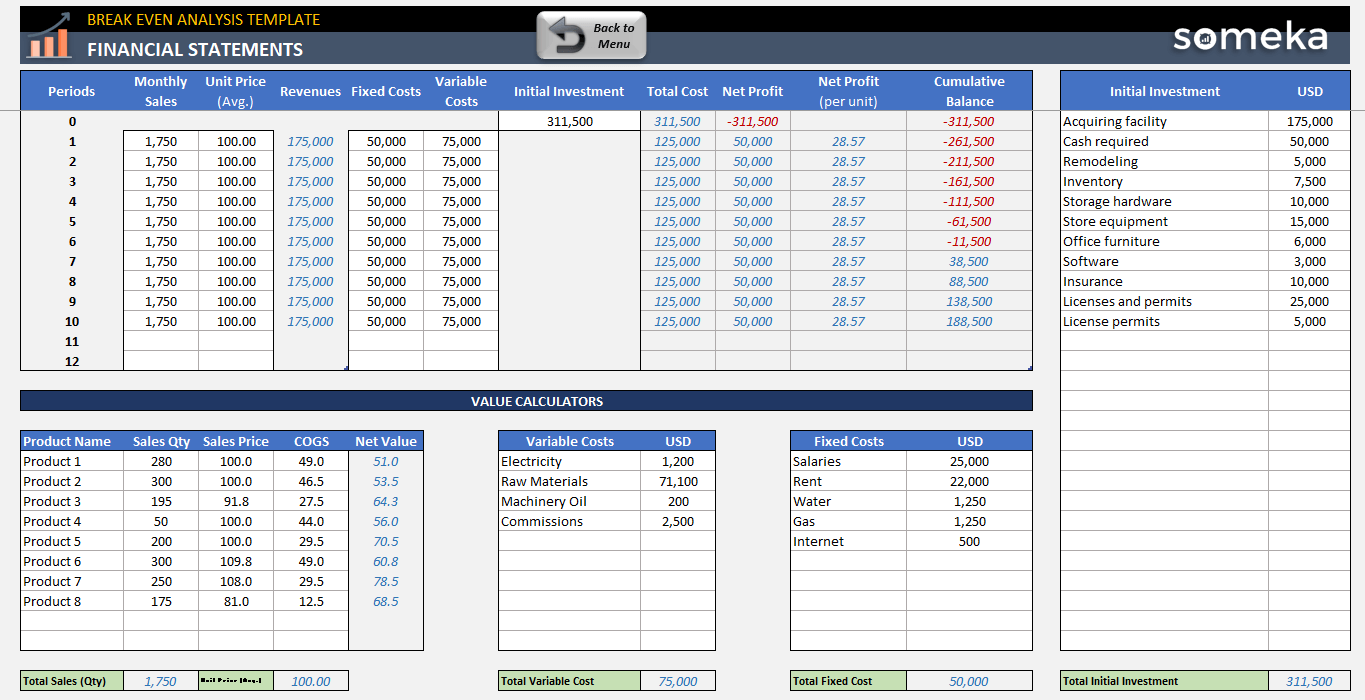
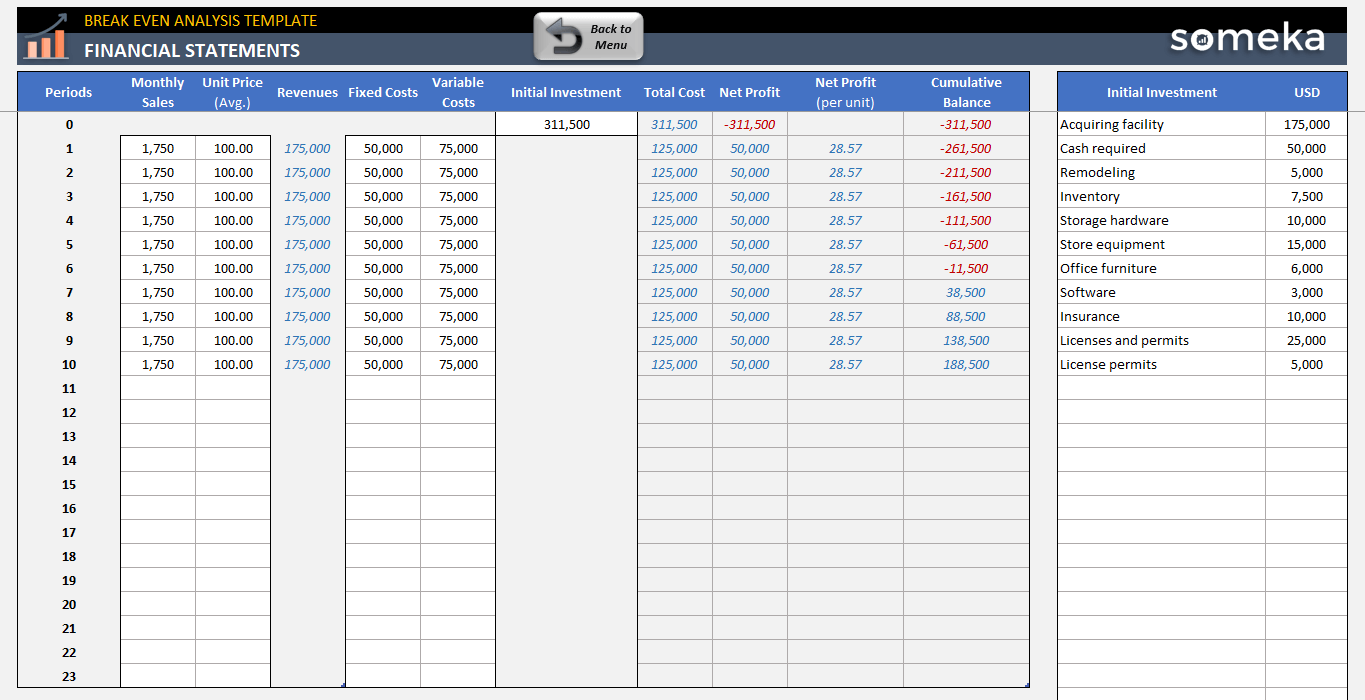
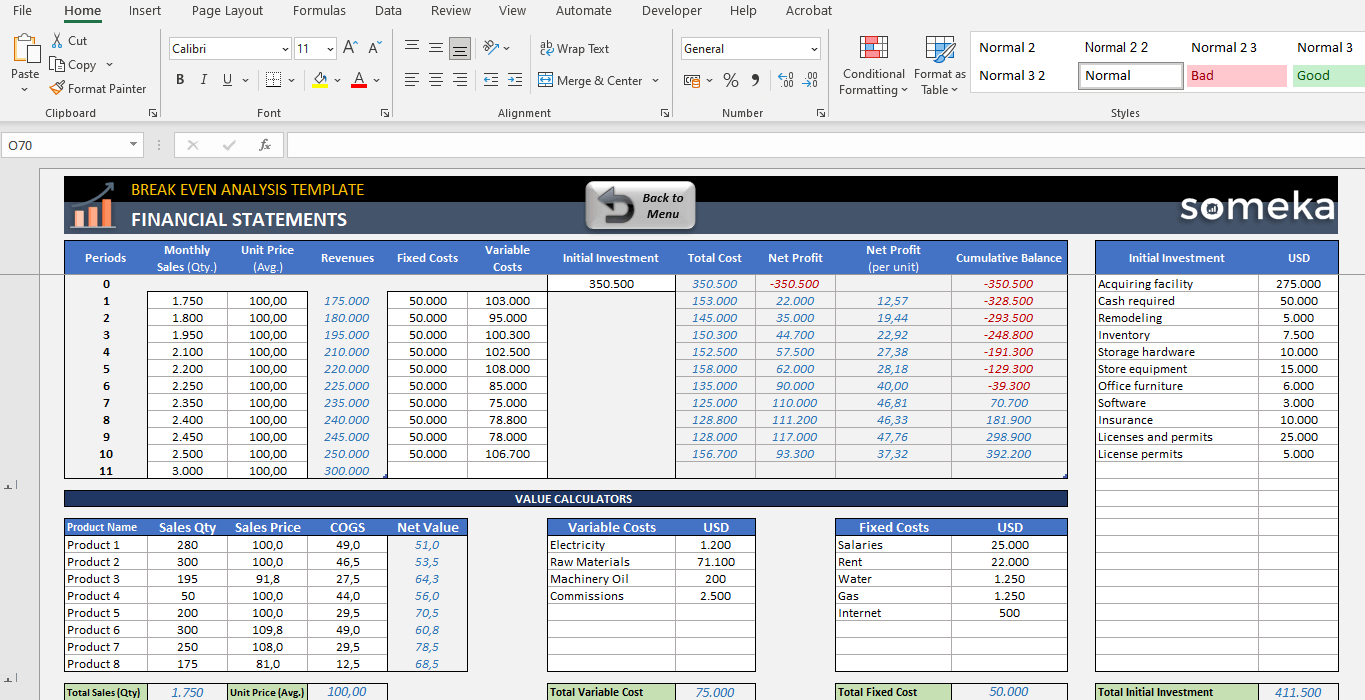
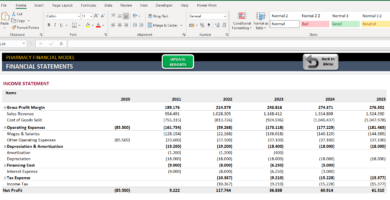
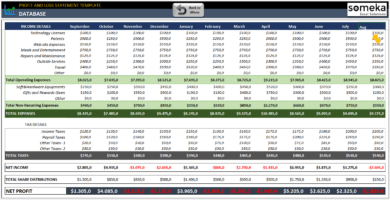
 Financial Statements
 Financial Statements
The only thing that you have to do is input your own data and find out how to price, how much to produce when to expect a positive accounting profit.
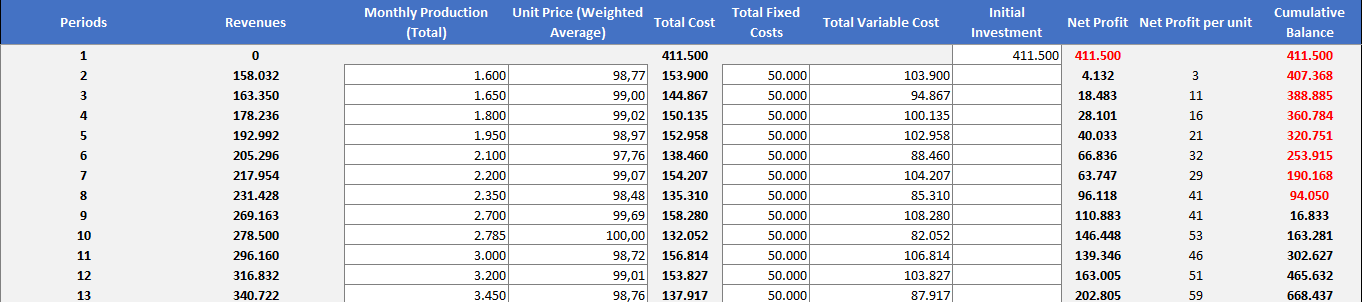
After putting the data in the white rows, this Excel template will calculate your revenues, total cost, and net profit automatically in order to give the result of your companies’ Cumulative Balance.
Calculators below the first section will ease your process on your Sales Volume Analysis. Once you record the necessary costs your company may have in the first phase, you can sum up those costs easily.
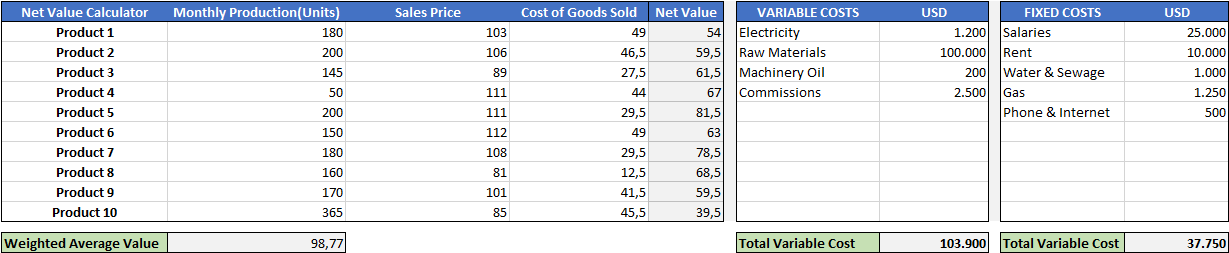
This template is also suitable for multiple products break even analysis. You’ll have a holistic view of profit and loss margins for each item, enhancing risk management and budgeting strategies.
Finally, whenever you make any changes your analysis results will be ready in the Dashboard dynamically. The Break-Even Analysis Excel Template will visualize all your assumptions to provide a clear overview of your company’s situation.
By integrating both direct and indirect costs into its formula, the product offers a comprehensive analysis. You can consider every facet of operational and operating expenses in the break-even graph presentation.
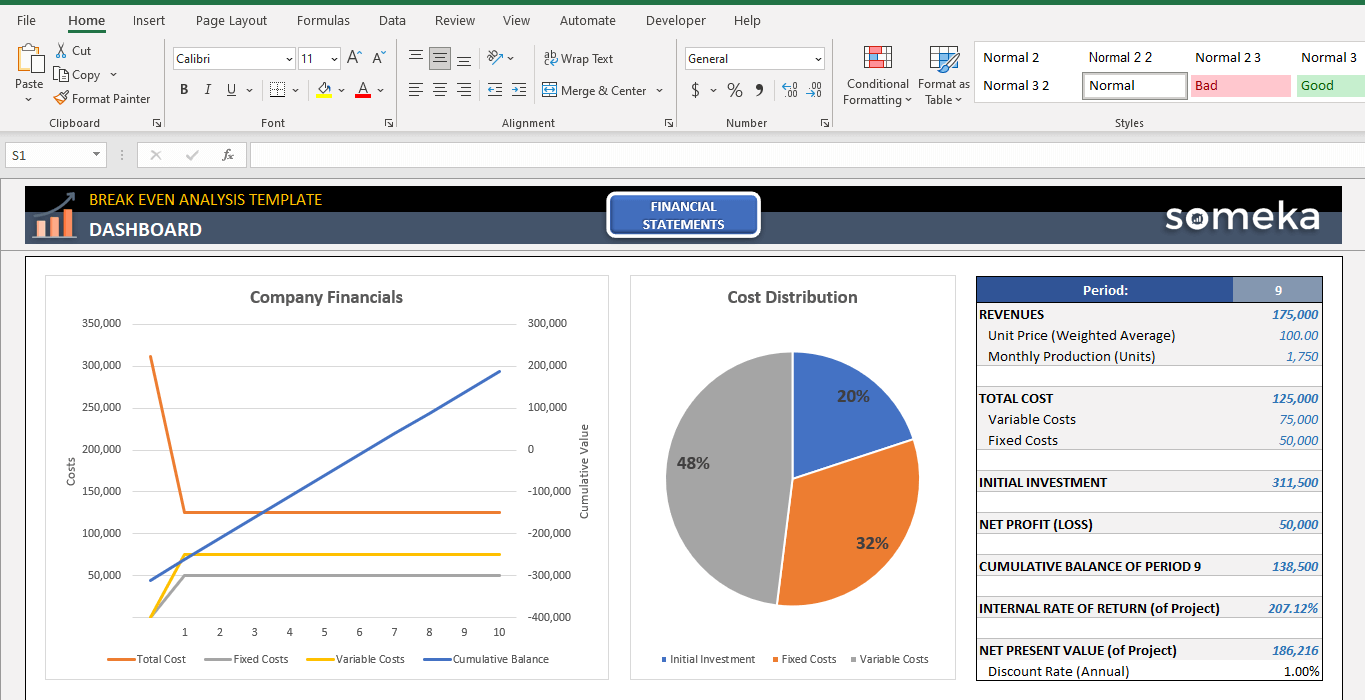
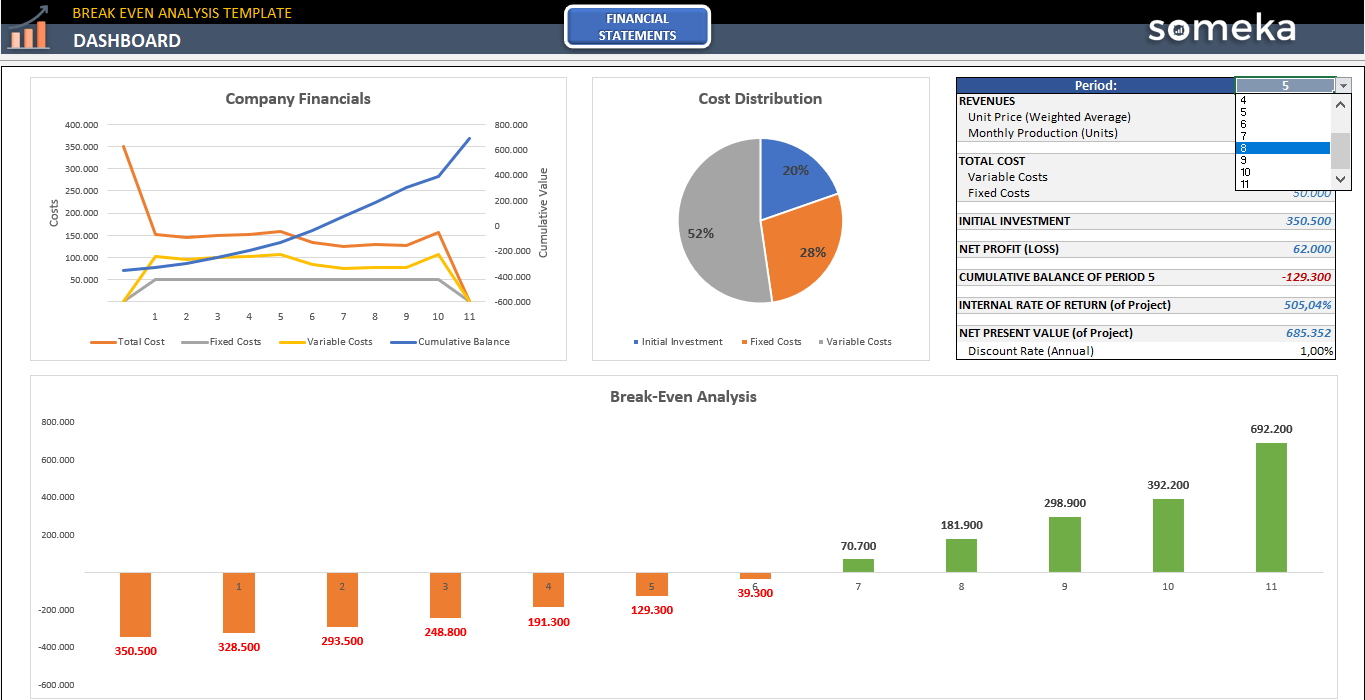
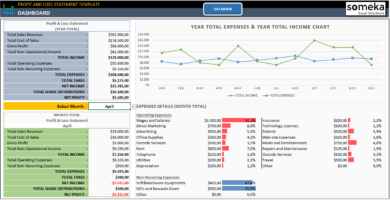
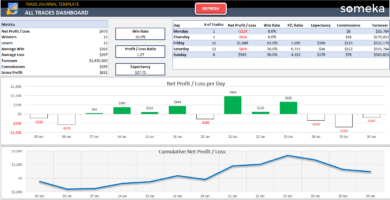
Dashboard
By understanding EBITDA and factoring in aspects such as interest on investment, the breakeven analysis template becomes an essential tool in the arsenal of cost-benefit evaluation.
Once the correctly estimated values are input, the dashboard displays:
- Line Graph of the company financials,
- Cost Distribution Chart of the Company (in terms of Startup costs, Fixed costs, and Variable costs.)
- Finally, the Bar Chart of the Break-Even Analysis will help you to find out when to expect positive accounting profit.

Lastly, the Financial Summary table in the dashboard displays the properties of the particular month. Just click and choose the necessary period on the number of “Period“.
Thus, engage with our Break-Even Analysis Excel Template for a structured approach to evaluating your financial standing. Just navigate the complex balance of earnings and expenditures, and set the stage for sustainable growth.
Break Even Analysis Excel Template Features Summary:
- Easy Financial Reporting in Excel
- Expandable Months Period
- Professional design for presentations
- Full Print Ready
- No installation needed.
- Ready to use.
- Works both on Mac and Windows
- Compatible with Excel 2007 and later versions
PRODUCT VIDEO
Watch the video below to see the template in action! Presentation also includes usage notes, explanations and tips & tricks about the template.
FREQUENTLY ASKED QUESTIONS
Break Even Analysis Excel Template FAQ
With our Break Even Analysis Excel Template, calculating your break-even point is straightforward:
- Input your revenue and cost assumptions in the Financial Statements section
- The template automatically calculates revenues, total costs, and net profit
- View the break-even point on the automatically generated line graph in the Dashboard
Our template eliminates complex manual calculations, providing instant, accurate results.
Our template provides a wide range of features to meet your needs:
- Automated financial calculations
- Dynamic dashboard with visual representations
- Multi-product break-even analysis capability
- Cost distribution chart
- Break-even bar chart
- Expandable months period
These features combine to provide a powerful, ready-to-use tool for your financial analysis needs.
Yes, the Someka Break Even Analysis Excel Template is designed to accommodate multiple products.
It provides a holistic view of profit and loss margins for each item, enhancing your ability to manage risk and develop effective budgeting strategies across your product line.
The dashboard is a dynamic, visual representation of your financial data. It includes:
- A line graph of company financials
- A cost distribution chart
- A break-even analysis bar chart
- A financial summary table
These elements update automatically as you input data, providing real-time insights into your financial position.
Our template is designed with user-friendliness in mind:
- Clear input areas (white rows) for your data
- Automated calculations in protected cells (gray areas)
- Intuitive dashboard for easy interpretation of results
- Compatible with Excel 2007 and later versions on both Mac and Windows
You can start using it immediately in Excel after downloading, with no installation or special software required.
Certainly!
The template features a professional design that’s perfect for presentations. The visual elements in the dashboard, including graphs and charts, can be easily incorporated into your financial presentations to stakeholders or investors.
USER REVIEWS & COMMENTS
14 reviews for Break Even Analysis Excel Template
You must be logged in to post a review.
RELATED TEMPLATES
-
 This product has multiple variants. The options may be chosen on the product page
Expense Analysis Excel Template
$29.95 – $59.95Spend analysis spreadsheet. Monthly reporting for actual and estimated costs. Printable and dynamic dashboard with easy-to-fill tables. All in Excel.
-
This product has multiple variants. The options may be chosen on the product page
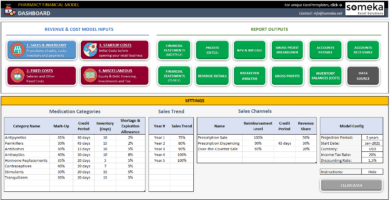
Pharmacy Financial Model Excel Template
$99.95 – $199.95Financial model spreadsheet for medical stores. Feasibility study, forecasts & budget plans. Printable financial statements. Dynamic charts. All in Excel.
-
This product has multiple variants. The options may be chosen on the product page
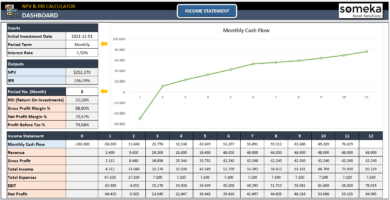
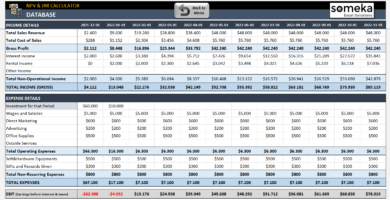
NPV and IRR Calculator Excel Template
$29.95 – $59.95Professional Excel spreadsheet to calculate NPV & IRR. Estimate monthly cashflows & feasibility. Ready for presentations. Dashboard with dynamic charts.
-
This product has multiple variants. The options may be chosen on the product page
Profit and Loss Statement Excel Template
$29.95 – $59.95Profit and Loss Statement Template built in Excel. Includes dashboard and separate database with a clean interface. Fully printable and easy-to-use.
-
This product has multiple variants. The options may be chosen on the product page
Stock Price Calculator Excel Template
$34.95 – $69.95Stock price tracker in Excel. Fetches real time stock quotes and calculates profit/loss on your portfolio! No installation, no monthly fees.
-
This product has multiple variants. The options may be chosen on the product page
Trading Journal Excel Template
$99.95 – $199.95Powerful and easy-to-use Trading Journal Excel Template built for day traders. Supports IRESS Pro, IRESS Viewpoint, and other platforms. Trade Journal Spreadsheet.
Oscar C. –
Does break even analysis comes up with an onilne version too?
Someka –
Hey there! We’re sorry, but we currently don’t have an online version of this template.
Hopefully, we’ll be able to provide a Google Sheets version of this template in the future.
Dongare –
Hi team, I realy need to have my own branding to this template, is there any way to delete your logo of this analysis template.
Someka –
Greetings! Don’t fret, you can easily remove the Someka logo from this tool. Just follow the link provided.
Randy Gordon –
totally recommended.
Abiel Gutierrez –
I can have a overal view with the money disturbiotione pie chart, thanks
Catrina Wang –
It was a wise money that i spent to buy this template.
Sergey Fedorov –
Amazing and easy to use.
Allison Sabatino –
can u help me with unprotecting the sheet?
Someka –
Hi, you have to download the file that we sent to you by email and also copy the password, and use it to unprotect the sheets. For more information please check out this link.
Amit Shrivastava –
I am really comfortable with this template in my monthly finances reports, just a few clicks and everything is ready, thank you Someka.
Charlie Garcia –
WHy i can not print this template? could you send me some help?
Someka –
Hi there,
To learn how you can print this template and also change the printing area, please check this link.
If you need more help please get in touch: contact@someka.net
Jèremy –
Good product for users not excel experts. it is really useful but I would like to have it in French version, why only in English? thank you
Someka –
Hi Jèremy,
We understand and apologize but at the moment we can only provide our templates in English.
However, if you need it in another language, remember the templates are modifiable, so you can change the labels, messages, and text shown to any other language you want.
You simply need to use the password provided to unlock it.
Hope this helps!
Janina –
Love it thank you helped me manage my restaurant business I recommend it
Jatin Patel –
Thanks
Abhijeet –
Thanks for sharing with us
matt rubin –
Many good reasons for the 5 star rating I gave. For free of price, really comprehensive break even analysis