Fortune Global 500 Map with Data Visualization
Fortune Magazine has just released 2017 versions of their well-known lists: Fortune 500 and Fortune Global 500 by country.
(For those who are curious about the difference between these two lists: Global 500 lists top companies from all over the world whereas Fortune 500 is exclusive to USA companies only)
As we have the latest data for the top 500 global companies now, we wanted to make an analysis with some visualization. First, let’s put all these companies in a world heat map to see which countries have the most companies in the Global 500 list:
Number of Fortune 500 Companies Per Country – Heat Map Visualization
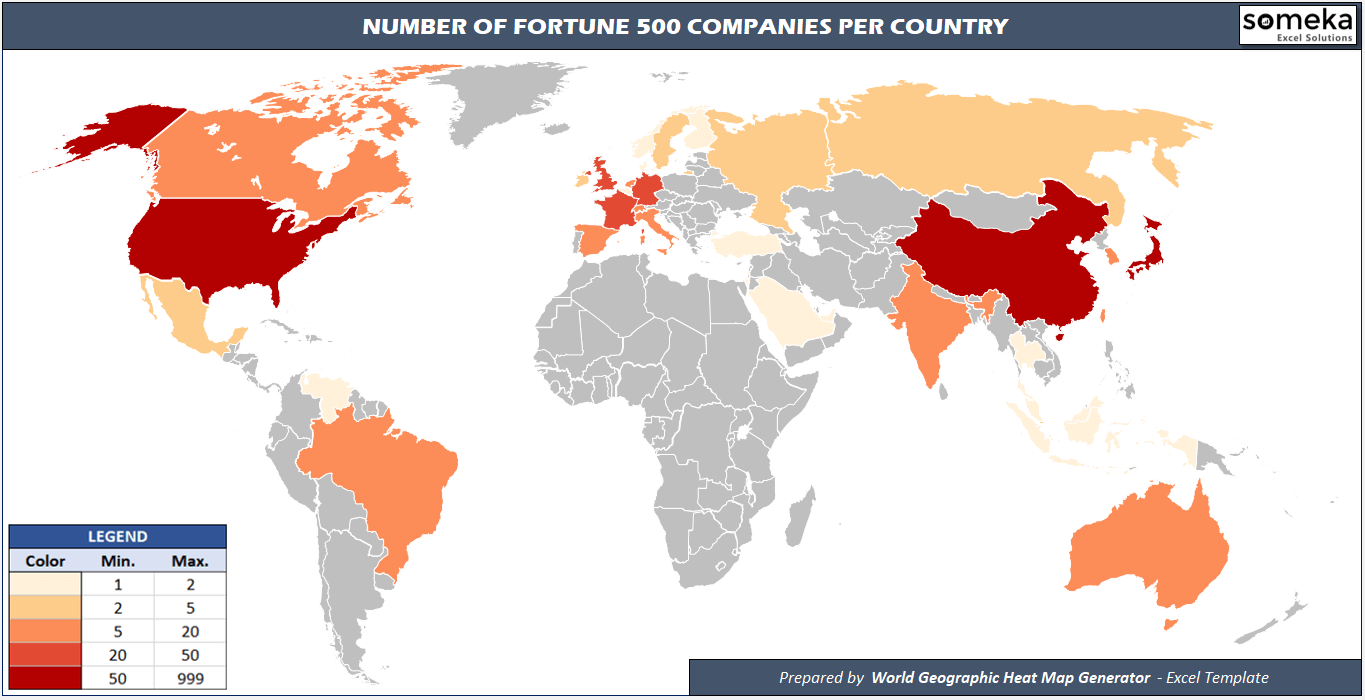
This Fortune Global 500 map analysis is automatically created by World Heat Map Generator Template. It is interesting to see the business distribution all over the world in a geographic heat map like this. (If you want to make similar heat maps, you can check our Geographic Heat Map Generators)
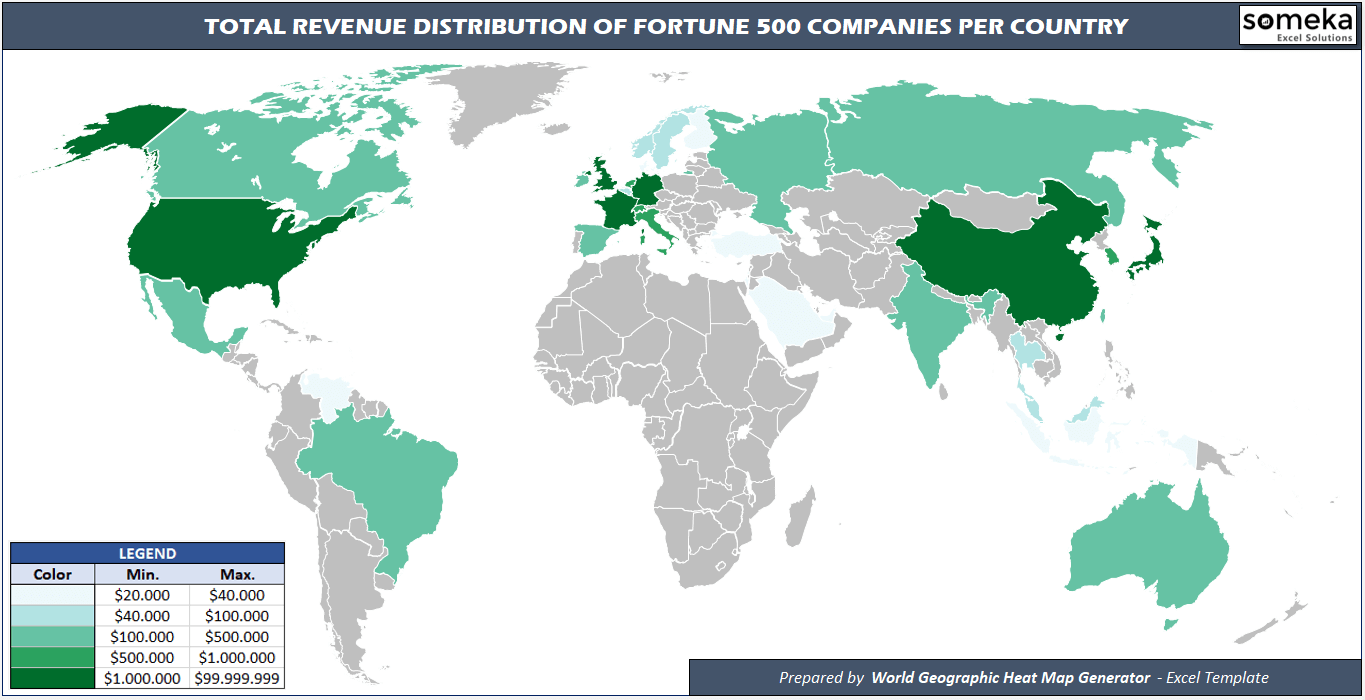
Let’s look at the data from another perspective: Revenues. Above, we have visualized the number of fortune 500 companies but there may be a few companies which make quite high revenues. Let’s check with another heat map:
Total Revenue Distribution of Fortune 500 Companies per Country
You can play with the legend limits, put country names, change colors in this Excel Template:
Europe Companies in Fortune Global 500 Map
We know the big players from USA, China, Japan, India, Canada etc. But at this scale, it is hard to see the details, especially for Europe countries. Let’s focus on Europe to see the situation in a more clear heat map:
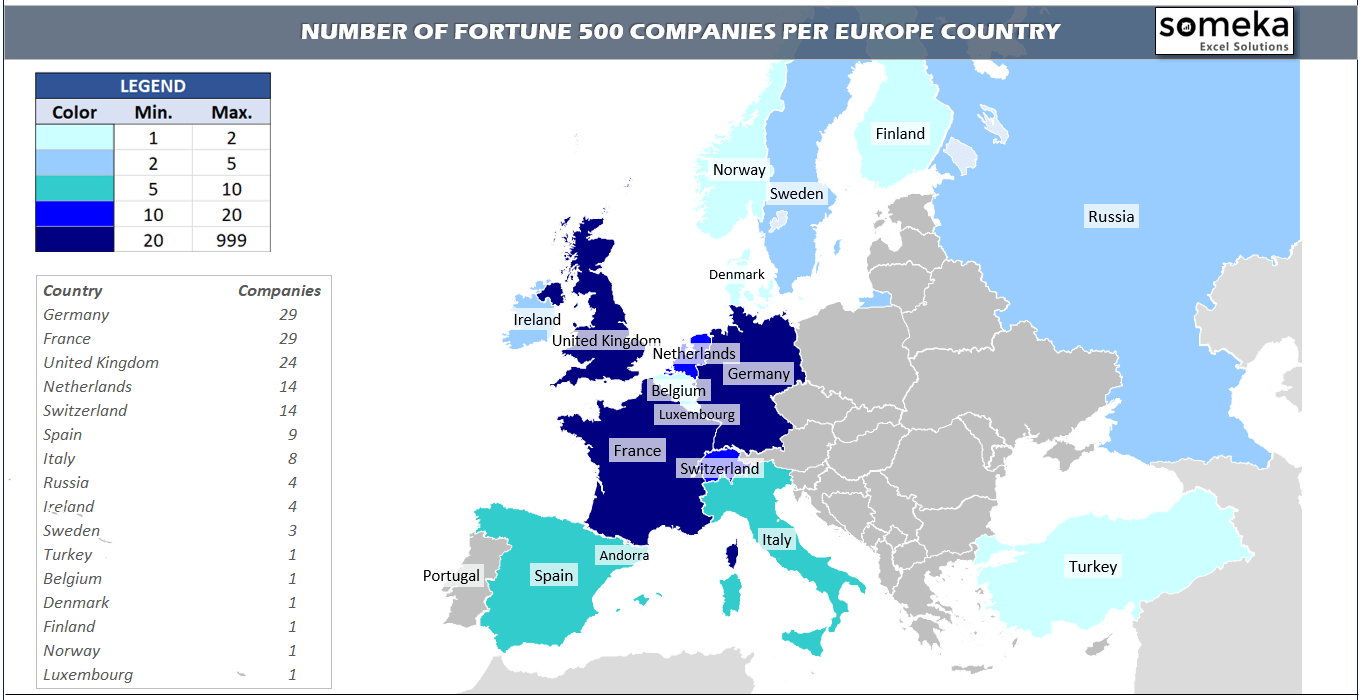
This visualization is automatically created by Europe Heat Map Generator Template.
Revenue Is Cool But What About Profits?
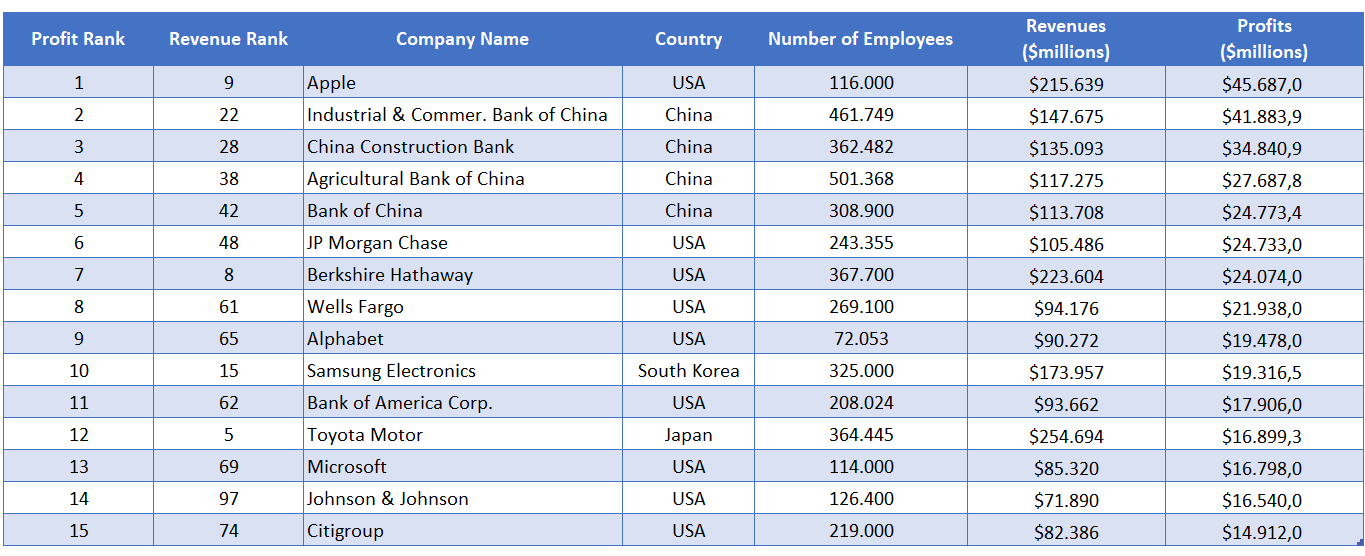
As you know, Fortune ranks the companies according to their revenues. However, a company does business for profit. When we check the profit figures, we see a few interesting facts:
- 42 companies in this list closed the year with negative profit! (almost 10%)
- Some companies make so much profit that, despite their revenue rankings, they can compete with top companies. For example National Grid from UK (ranks 491st) announced almost the same profit with State Grid from China (ranks 2nd) even though their revenues is 1/14th of State Grids!
- Average Profit / Revenue ratio for 500 companies is: 5,5%
Here are the top 15 companies when sorted by profits:
There are lots of analysis that can be made with this data but we leave it to the business analysts. If you want to play with Fortune 500 data by yourself, you can free download Global 500 (a limited version) from here:
This list is officially published by Fortune Magazine at: fortune.com/global500. Time Inc. has full rights to sell or distribute the Full List.
This is a much more limited version of the original data. You can find the full version here: fortunedatastore.com
Someka is not associated with Time Inc. nor Fortune Magazine
Happy analysis!
Related Posts