Articles About Data Analysis and Statistics with Excel
Nowadays, 90% of job postings about Data Analysis require excellent spreadsheet skills. So this generally results that the primary tool of many data analyst is Microsoft Excel. In fact, it’s truly amazing how much science you can do with it!
Explore this category to learn a lot of tips, real-life examples, mathematical solutions, data visualization methods, dashboards and graphs in Excel!
Career Guide: Data Analyst
Have you ever wondered where to start for being a successful data analyst? Here is an article that shows everything about data analysis.
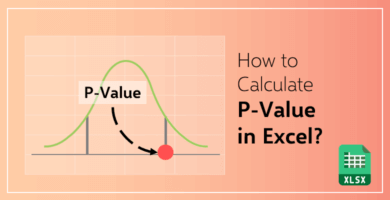
How to Calculate P Value in Excel?
P-Value might be hard concept to understand. This blog post aims to teach how to calculate P-Value in Excel with examples!
How to Calculate Confidence Interval in Excel?
This article describes the formula and explains how to calculate the confidence interval in Microsoft Excel with real-life examples.
How to Prevent Data Inconsistency & Discrepancy Problems in Excel Workbook?
Excel data inconsistencies can occur from cell to cell. It can seem exactly the same but not always. Check this guide to learn more!
Can Excel Use Python?
In this blog post, you will learn why you -as a Microsoft Excel user- should know Python and detailed comparisons of the two software.
How to Calculate Z Score in Excel?
In this blog post you'll learn about how to calculate Z-Score in Excel with AVERAGE and STDEV. S or STDEV. P formulas with examples!
Can Excel Generate Random Numbers?
Check this guide to learn more about RAND & RANDBETWEEN Formulas, running simulations in Excel and how to generate numbers in an easy way!
Can Excel Make Venn Diagrams?
Create, customize your Venn diagram in Excel with a few clicks. Check this guide to learn about SmartArt, Shapes and more!
Can Excel Convert Currency?
Microsoft Excel provides many useful functions to convert currency. Learn more about EUROTOOL.XLAM add-in, EUROCONVERT function and more!
Go back to FAQ Center