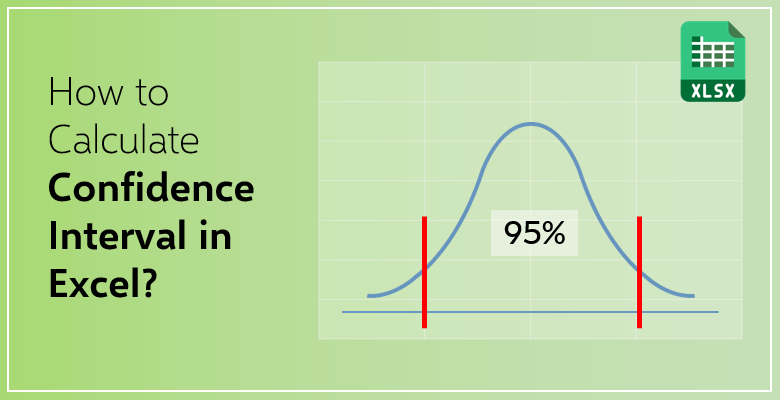
How to Calculate Confidence Interval in Excel?
When you talk about statistics you rarely can make test the population as a whole if the number is large. So you choose a little group from that large population and work on that.
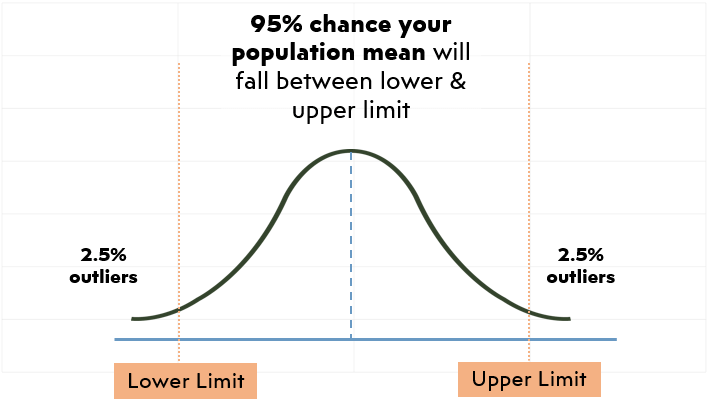
The result you got from the sample gives you a clue about the whole population. But it would cause errors since the results are the same for the whole population. That’s why it is more accurate to give the result in a range rather than give it as a single value. This interval is called the confidence interval.
- It is calculated for odds of and risk factors. This is why it is commonly used in engineering and medical areas.
- The closer the lower and upper limit of the confidence interval means the narrower the confidence interval. It means the prediction of the entire population is more accurate.
- The confidence interval is calculated by using standard error. A lower standard error means a more accurate confidence interval.
- The larger population sample means more accurate results because there are more individuals you calculate and this makes our sample closer to the entire population.
Why Do You Need Confidence Interval?
When you are making researches on large groups it is really hard to collect data from each individual in this population in terms of time and resources. So instead you pick a smaller group you believe represents our whole population the best and make our calculations based on that group.
This group is called the sample size. For example, you are designing a new running app for runners. It is impossible to track down every runner in the country and ask them their reviews on this app.
Instead, you choose a small group of people that you think represent the whole population best work from there.
Another good thing about confidential intervals is that you can calculate depending on how much you want to be sure of your results. Default accuracy is usually 95%. That means you can be 95% sure that the confidence interval from the sample contains the population mean.
If you want to be more definite you can calculate a 99% confidence interval. That will, again, mean you can be 99% sure that the confidence interval of your sample size contains the population means.
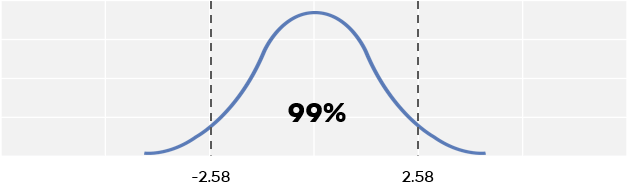
These levels of confidence tell us if you make the research over groups of 100, 99 of the individuals in these groups will have the same result. If you do them in groups of 1000, 990 of the individuals will have the results, and so on.
Where Do You Use Confidence Interval?
Let’s say you are head of a pharmacy firm that produces medicine for the diabetic. You and your team managed to eliminate two formulas that are going to be used on patients.
In an ideal scenario, you give medicine X to half of the patients and medicine Y to the other half. But it is impossible to manage it for the target population since it is too large. So you choose only a group of patients that you think represent the whole population better and give them the medicine.

The results will give us a good point to guess which medicine is working better but since you could not try it on the whole population you cannot stick to one result.
So you gather up all the information and calculate the range. This is the confidence interval and gives us a better idea of the medicine.
Let’s say after a few months you noticed the healing rate among these patients is 20%. Some of them are getting 60% better and some of them get 40% better.
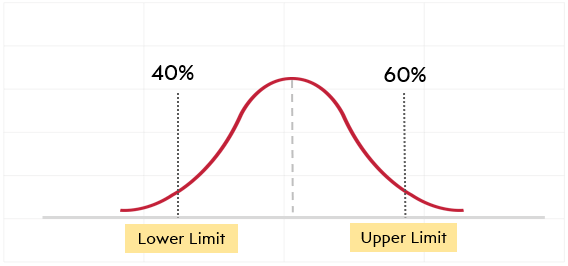
This means if you try the same with 100 other groups you might reach the same result in 95 of them. And you can be 95% sure the healing rate among these two medications will be between 40% and 60%. If the limit between them were narrow that would mean you were more successful.
How To Calculate Confidence Interval Mathematically?
You may not be good at math and you don’t have to be to calculate the confidence interval by yourself. Let us show you the calculating process with a real-life example:
Let’s say you are a veterinarian and you have to buy a transport cage for cats in your clinic. Every cat has a different weight of course so you have to guess the weight of cats you might take care of in the future.
To do so you can weigh all the cats nearby but in fact, it would be very dreadful and long works since there are hundreds of cats. So that brings you to the first step:
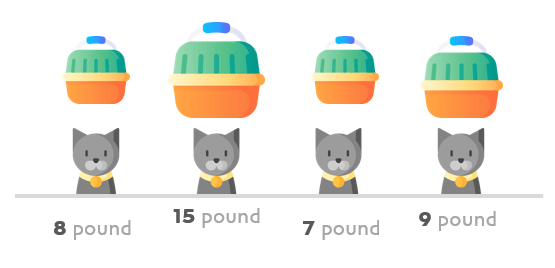
1) Choosing a test group for your calculation: You can choose ten cats to weigh that you think suits your experiment better. It is easier to work on a less crowded group. The ten cats you choose have different weights.
Let’s say our data set is 3, 3, 3.5, 4, 4.5, 3.7, 3.3, 4.2, 3.8, and 4. These are kilograms of the cats you weighed.
2) Calculate the sample mean: Mean is a very easy statistical term to calculate. It gives us the average value in a data set. All you have to do is add up all your data and divide them into the number of your data points.
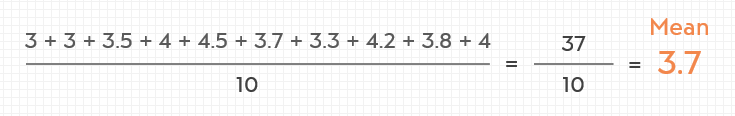
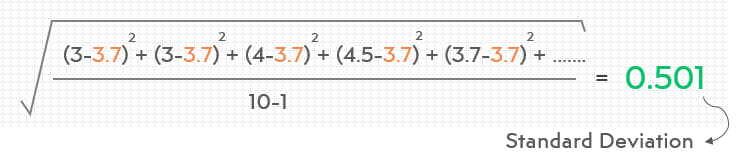
3) Calculate the standard deviation: To calculate the sample standard deviation, you need to find the mean of the data which you did in the second step.
Next, you need to find the variance of the data or the mean square of their difference from the mean. Once you’ve found this number, take its square root.
It might sound complicated but you can use a calculator for this step. The result of this calculation will be 0,5011. Our standard deviation value is approximately 0,5.
4) Choose the desired confidence level: The most common confidence levels are 90%, 95%, and 99%. You are going to choose 95% in this example.
Recommended Reading: How to Calculate Z Score in Excel?
5) Calculate the standard error: That means multiplying the critical value by the standard deviation.
Our confidence value is approximately 0,31.
6) Add the confidence value to the mean and subtract from the mean:
The lower limit will be 3,39 and the upper limit will be 4,01. Now you can guess the weight of the cats and buy the correct transport cage.
How to Calculate Confidence Interval In Excel?
Now that you learned what confidence interval is, why do you need it, how can you use it and how to calculate it mathematically, you can start learning how to use this function in excel.
Let’s start!
Step 1: Write Down Your Data Set
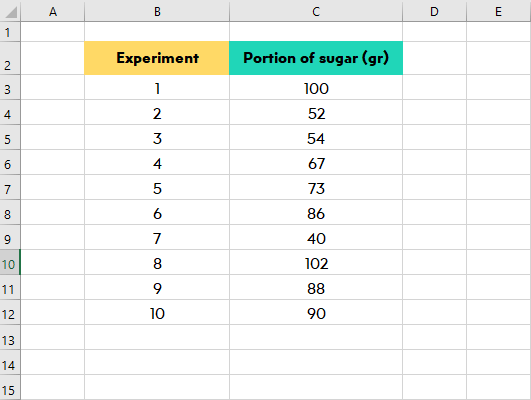
You are learning how to make cookies but you never seem to arrange the right portion of sugar the make a perfect one. So you noted how much sugar you use every time to find the right portion.
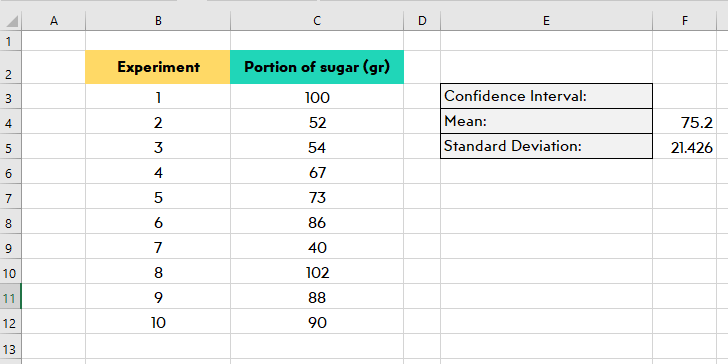
Let’s say the portion of sugar for your last ten experiment goes like 100, 52, 54, 67, 73, 86, 40, 102, 88, and 90. These are written from B2 to B11 under Portion of sugar (gr).
Step 2: Interpret your formula
The Microsoft Excel formula for the confidence interval is simply:
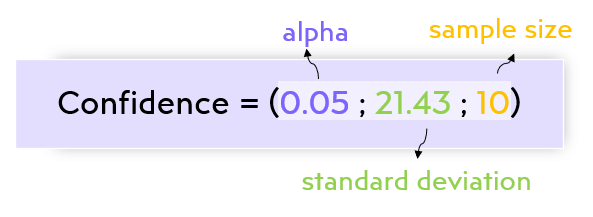
This means you need to determine three different statistics before you calculate the confidence interval.
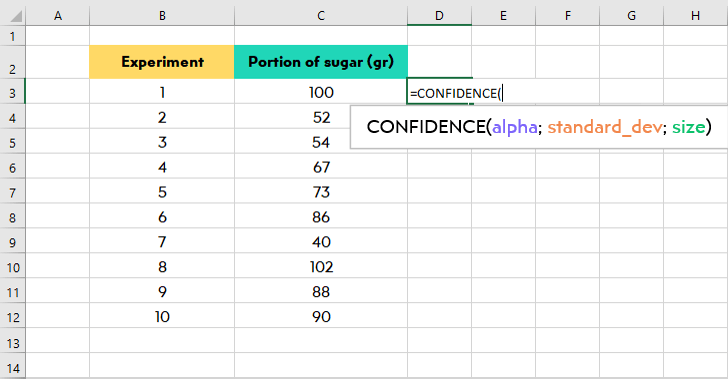
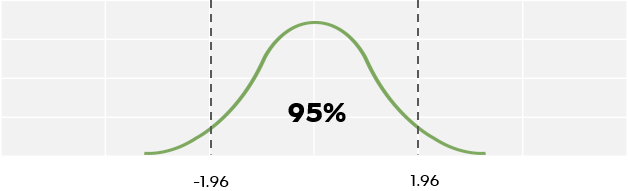
- Alpha: “Alpha is the point level which is calculated as 1 – confidence level; a 95% confidence level has a 0.05 significance level.” It means the ratio of the individuals that do not contain your population means.
- Standard deviation: Standard deviation is a statistical term that shows us the range between the mean of the population and the actual data.
- Size: Size is the population size. The number of individuals you entered in your data set.
Step 3: Calculate the Required Values
Now you will calculate these three values.
- The confidence interval is usually calculated with 95% confidence value and you will stick to that in our example. You can change it if you wish. So the alpha value for us will be 0,05.
- To calculate the standard deviation you have to determine the mean first. The formula for calculating the mean is:
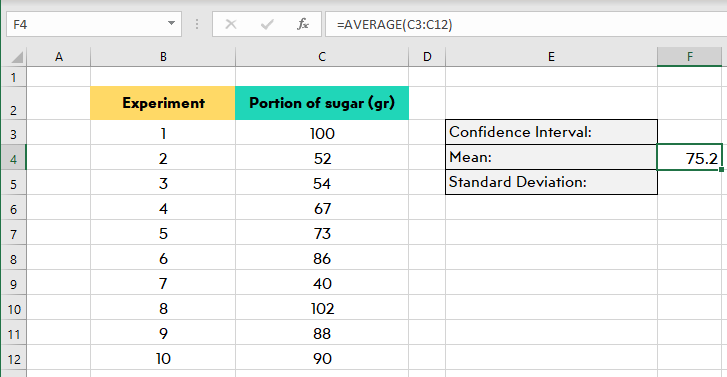
Our mean is 75.2 for this example.
After calculating the mean you can start calculating standard deviation.
If you are using a version of Excel after 2007, the formula should be:
But if you use an old version, you use the STDEV formula. This is:
The standard deviation for our example is 21.42584.
Tip: The formula you type might not work on excel due to some version issues. But don’t worries Excel correct the formula for your version!
- The sample size for our example is 10 because you have 10 individual data points.
Step 4: Place Your Calculations into the Formula
Let’s put these values into our formula. It should look like:
=CONFIDENCE (0,05, 21.42584, 10)
- Alpha: 0,05
- Standard deviation: 21.43
- Size: 10
This formula will give us a value of 13.27963 which is approximately 1.28. That is our confidence value.
The confidence interval is added to and subtracted from the mean. Which is
- 75.2 + 13.28 = 88.48 the upper CI
- 75.2 – 13.28 = 61.92 the lower CI.
How to Calculate Confidence Interval Automatically?
First of you need to activate the Tool Pak in Excel.
- Go to Files and click Options.
- Go to Add-ins section in the left column.
- At the bottom, you’ll see Manage: Excel Add-ins and you will see a button says Go.
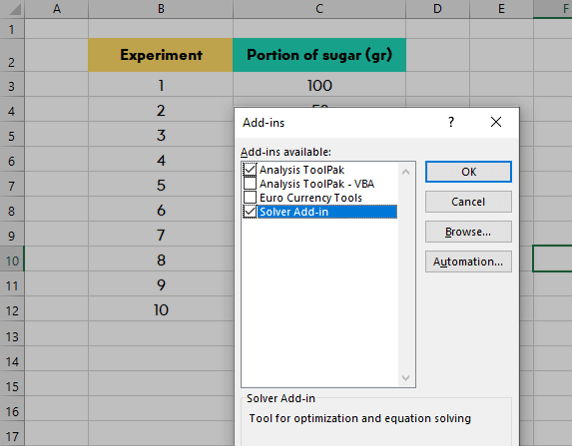
There are two tools you need to activate on the Tool Pak: “Analysis Tool Pak” and “Solver Add-in”.
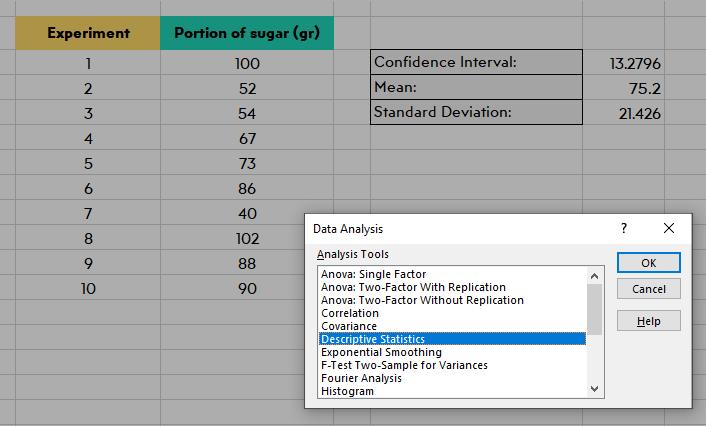
- Once you do that go to the Data tab and there you are going to see a Data Analysis button.
- Click OK and new window with an analysis tools list will show up.
- Go and select the Descriptive Statistics option.
Doing this will bring you a new window with options. The first option will require you to enter the data set on your sheet. You might type data or you can click it and select the cells with your data in it with your mouse.
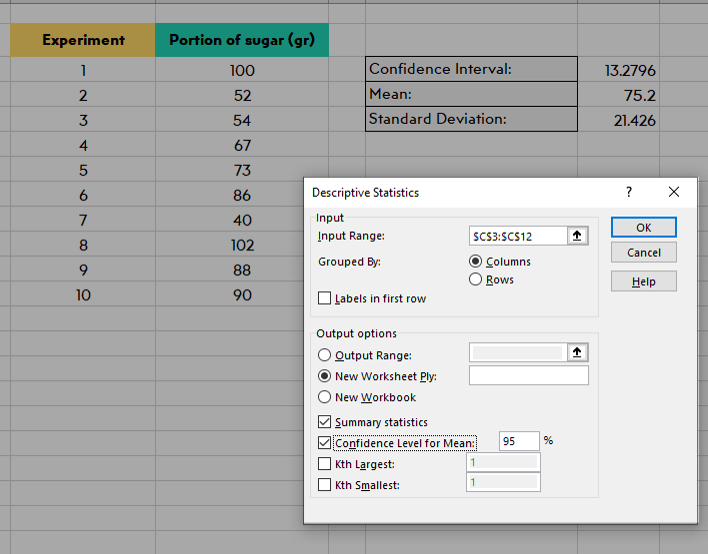
The output options allow you to enter your analysis anywhere you want. We recommend using the “New worksheet” button for a separate worksheet from the one you work on.
Under that, you should check Summary statistics and Confidence level of mean. As it was said before you can change the confidence but we decided to do this example with a standard 95%.
Once you finish doing these click the “OK” button to run the analysis:

Now that you have our analysis in a new separate sheet. This tool gave us the values of mean, standard error, median, mode, standard deviation, sample variance, range, minimum, maximum, confidence level %, and more.
Of course, you won’t use all of these values but it can be really useful to access all of these values quickly and simple.
FINAL WORDS
The confidence interval is a helpful and useful statistical term. It makes it easier to calculate the results in a large group of data. It saves us time and it is really easy to calculate by using Microsoft Excel. Don’t forget to check out our other articles on how to use excel formulas.
Related Posts