Weighted Average: What is it? Where to use it? – A complete guide with examples
We will talk about the idea of the weighted average in this article. We will discuss the use of a weighted average over a simple average, when it is appropriate to use it, and how to calculate weighted averages.
After offering a technical explanation, we’ll include a few daily and business-related examples.
Table Of Content
1. What’s Weighted Average?
2. Why do we use Weighted Average?
3. Technical Calculation of Weighted Averages
4. Real Life Applications of Weighted Average
5. Final Notes
Now let’s get started.
1. What’s Weighted Average?
The concept of the weighted average is a statistical measure that calculates the mean of values which are assigned different levels of importance or weights.

It’s crucial because it provides a more accurate representation of a scenario where not all elements contribute equally.
2. Why do we use Weighted Average?
Let’s start by talking about what a weighted average is and why it’s important. We’ll demonstrate this idea with a straightforward example.
We’ll show you why using a simple average could produce inaccurate results with two examples: one from the business world and other from daily life.
Daily Life Example for Weighted Average:
Consider a student who studies mathematics for eight hours a week, takes eight exams a year, and averages a score of ninety on each. The same student takes biology as well, but only for an hour each week. She has only taken one test and received a 50 on it.
Maths: 8 Hours/Week – 8 Exams/Year – Score: 90
Biology: 1 Hour/Week – 1 Exam/Year – Score: 50
Do we simply add 50 points for biology and 90 points for math, then divide the result by two to get 70 when assessing the student’s overall performance? This would be deceptive since there is a lot more emphasis on mathematics in terms of hours and tests for students. The real performance of the student is higher than 70.
On the other hand, we cannot claim that a student’s average performance is 75 if they consistently received 50 on math exams and 100 on one biology exam.

Inflating the student’s actual performance would be false as a result. To get a more accurate average in these situations, we apply weighting, which involves multiplying math by the total number of classes or exams (applying the same formula to biology as well).
Weighted Average in Business:
In the realm of business, the application of weighted average becomes more evident. Suppose a company sells two products with differing profit margins. A straightforward average of the profits from these products would not reflect the true financial health of the company. This is where the weighted average comes into play, considering how much of each product is sold and its respective profit.
Assume you make an average profit of 10 units on one product and 50 units on the other when you sell both. How about we just take the sum of 10 and 50 and divide it by two to get the average profit? That would be deceptive.

The amount of each product sold is important. Your average profit will be closer to the profit of the more frequently sold product if you sell a lot of the product that makes 10 units of profit but very few of the one that makes 50 units.
As a result, a simple average would produce an inaccurate outcome. We make use of a weighted average in these circumstances. We evaluate the values, taking into account the quantity or significance of each.
Weighted Average in Decision-Making:
Interestingly, our brains also apply the concept of weighted average in decision-making, although we might not realize it. For instance, when choosing a restaurant, different factors like food quality, ambiance, and price are weighted based on personal preferences. A similar process occurs when selecting a house, where factors like proximity to main roads or the size of the house hold different weights for different people.

This is a fantastic example of how weighted averaging is something our brains do all the time without us even realizing it.
Weighted averages are calculated by our brains. How does something like this occur?
Imagine that you are debating whether or not to eat at a restaurant.
Your brain takes into account a number of aspects of the restaurant, including the cost, the speed of service, the atmosphere and design, and the caliber of the food. All of these factors, though, are not equally important to everyone. For some people, the price is not as important as the quality of the food. For others, the quality of the food may not be as important as the design. Price may be more important to someone else than other considerations. As a result, each person has a different set of weighting factors—the relative importance of each factor—when making decisions.
For example, a person who places a high value on affordability might not select a restaurant that serves great food at a high price. This demonstrates how weighted averages are useful in making decisions.

In fact, this is a very good example of being a weighted mean.
Or think about picking an apartment: different people will give different weights to different factors such as floor level, interior size, and proximity to the main road. An apartment that appears ideal to one person may not be as appealing to another if, for example, its proximity to the main road—a crucial factor for them—ranks poorly. As a result, they would have a low overall weighted average score for that apartment.
Decision Matrix Tools:
We’ll also talk about how our Decision Matrix product, which is a tool we frequently use in daily life, is an excellent illustration of this.
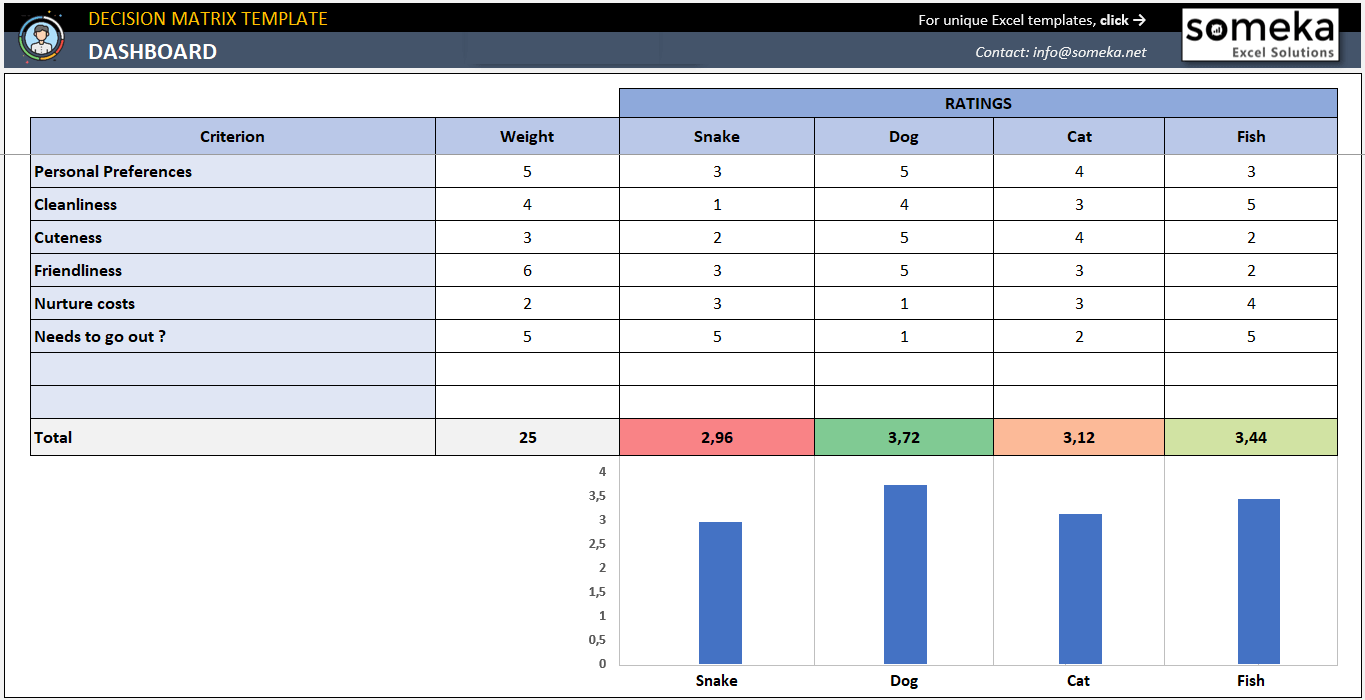
– This is the dashboard of our Decision Matrix Template –
This template is used for any kind of decision. You list the criterion and then assign a weight score for each of them. Then you rate each Option according to the criterions. In the end, the template takes the weighted avreages for you to bring you the best decision.
3. Technical Calculation of Weighted Average
Technically, calculating a weighted average involves multiplying each element by its weight and summing these products. In Excel, this can be done using the SUMPRODUCT function.
Let’s now discuss the mathematical details of creating a weighted average.
How do you Calculate Weigted Average in Excel?
Assume that we have a column containing the following products: A, B, C, D, etc. We include a list of suppliers and their costs next to each product. Product A may be available from Supplier 1 for $20, B for $30, C for $5, and D for $10. Additionally, Supplier 2 has varying prices.
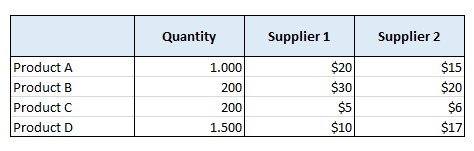
We should select the most economic solution. Which is, on average, less expensive? The result would be incorrect if we just added up all of the prices and divided by the total number of products. We must weigh our information. It matters how much we intend to buy from each supplier.
For example, Supplier A may be more expensive for one item but less expensive for the majority of them. Even with a mere average glance, Supplier A would still appear to be the better option. However, it’s possible that we intend to purchase that one pricey item in larger quantities—let’s say 100 units—instead of the other 10 units. Supplier B may benefit more in this situation. In a technical sense, this is where the SUMPRODUCT is useful.
To get the weighted average, we multiply the quantities by the prices. This is how the calculations are made. The example below illustrates how simple it is to accomplish this in Excel by utilizing the sum product function.
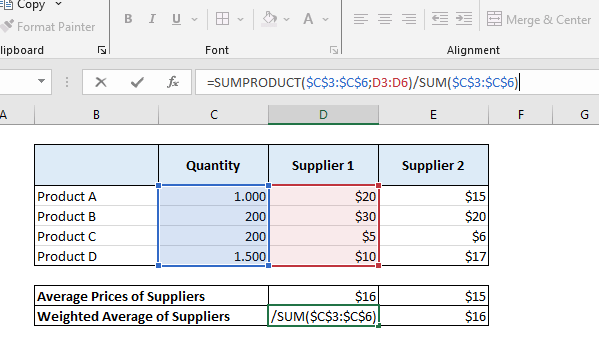
This is what we call a weighted average. We multiply the values by the weighting factor, that is, the wayfinding factor, and add the results and divide the number of parameters. This is the calculation method for this.
You can do this very easily in Excel by using sumproduct function. As you see, Supplier 2 seems more cheaper when we only check for the averages. But on the weighted mean side, Supplier 1 is much cheaper.
Bonus:
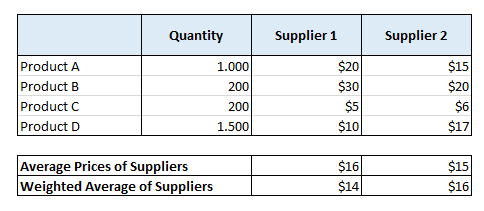
If you want to practice SUMPRODUCT and other functions in Excel, you can download our Excel Formulas Trainer to test your Excel skills:
4. Real Life Applications of Weighted Average
Yes, in the last section, we will give a few examples of how we can use the weighted average in the business world.
Example 1: Customer Satisfaction Analysis and ABC Classification
It is possible to weight the customer satisfaction scores according to the size or revenue contribution of the various customer segments. Customers who interact more with your business and shop more frequently, for example, can be classified using the ABC Classification or Segmentation method.
The average scores provided by consumers in the A segment may be deemed more significant in this method than those from lower segments. We don’t treat every customer the same; customers in the A segment, who make larger purchases, receive higher scores. This method produces more realistic results that more closely match our desired outcomes.
Example 2: Performance Evaluation
Product performance evaluation is another example. Here, a weighted performance evaluation can be carried out using the sales volume and profit margins of different products. This method emphasizes the profits of products with higher sales volumes, leading to a more accurate representation of the company’s overall profit margin. This was briefly discussed in the first section.

The assessment of employee performance is another context in which weighted averages are helpful. Employee performance in various roles or departments can be weighed based on how important the department is to the business. For instance, suppose the finance department has 30 employees and scores a 5 out of 5 in terms of its impact on the company’s operations, while the quality department with only 2 employees scores 1.
We can’t just say the average is 3. The finance department, having more employees and a greater impact on the company, should carry more weight in the overall evaluation. A weighted average could be calculated, perhaps by multiplying the scores by the number of employees in each department. Thus, we would expect a score closer to the finance department’s rating, for a more realistic overall evaluation.
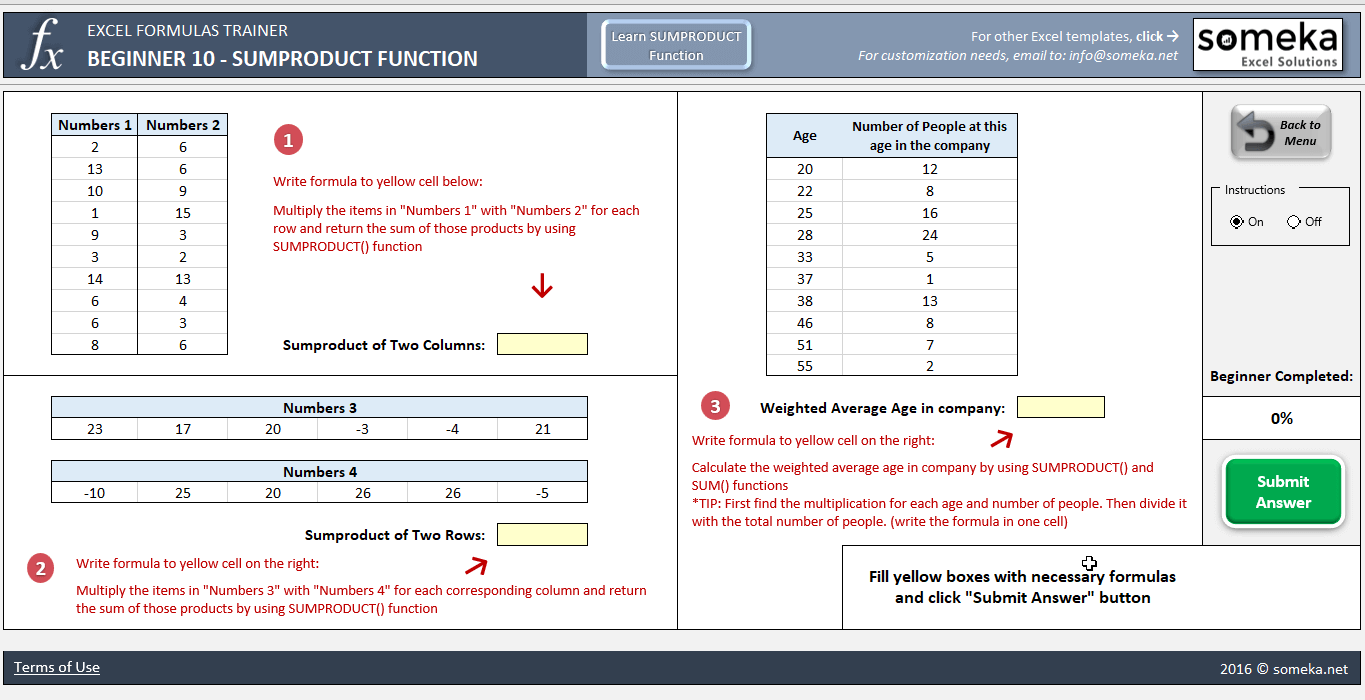
Example 3: Assessing the risks
Yes, we can actually end the topic by giving two more examples from the business world. Firstly, it may be related to the issue we call risk management. Different risk factors can be weighted based on their potential impact on the company, their likelihood, and the magnitude of potential losses.
The chosen weighting factor is critical here. For instance, how much would the company suffer in the event of a flood, a fire outbreak, a takeover by competitors, or new government regulations that adversely affect the business?
– This is the Risk List section of Someka’s Risk Assessment Template –
These scenarios are entirely independent, but their weights and probabilities of occurrence differ. Some might have a low probability of occurring but can cause moderate damage, while others might be more likely and lead to significant losses. Therefore, a weighted analysis is necessary.
Example 4: Market Share Analysis
Lastly, let’s talk about market share analysis. The market shares of different products or services can be weighted according to their total revenue or customer count.
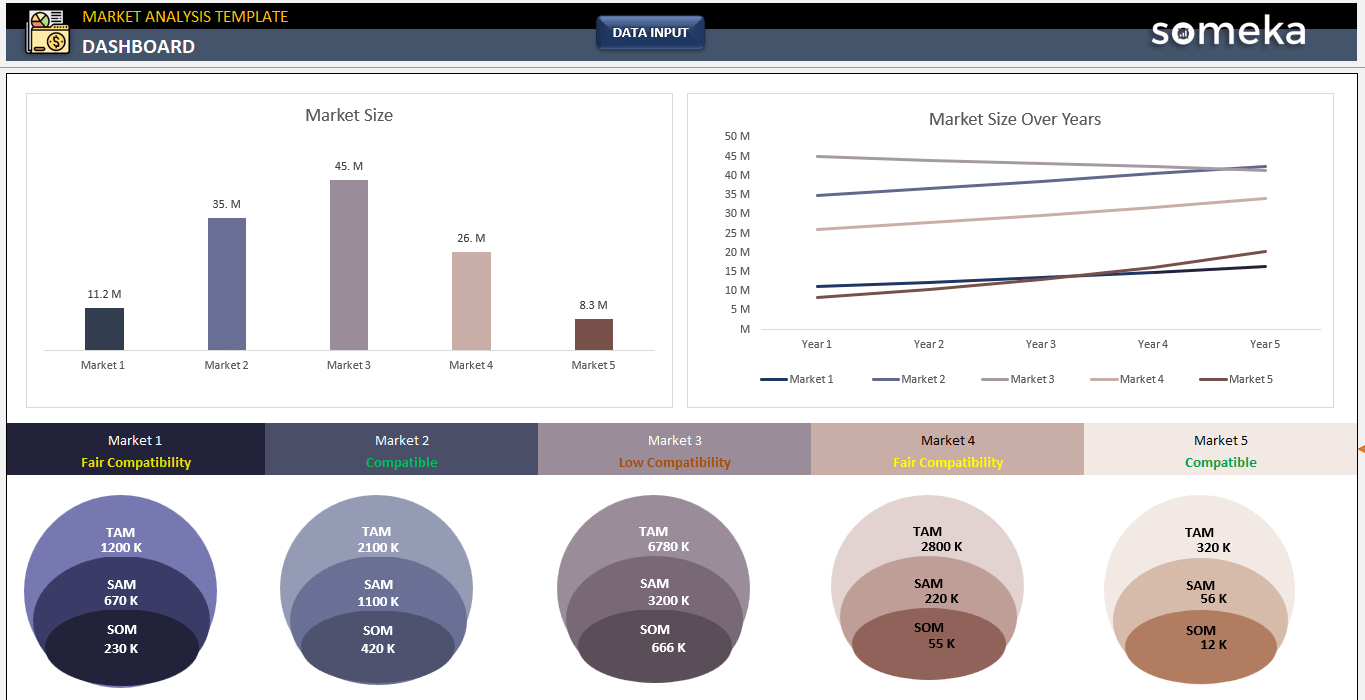
– This is the Dashboard of Market Analysis Template by Someka –
This approach allows for a more accurate analysis of market share. For example, having a high market share in a less significant product group versus a low market share in a more profitable and high-sales product group can’t be simply averaged out. The importance of each product group needs to be taken into account when weighting.
Example 5: Wholesale Price Calculation
Weighted Averages are also important for calculating the wholesale prices for customers.
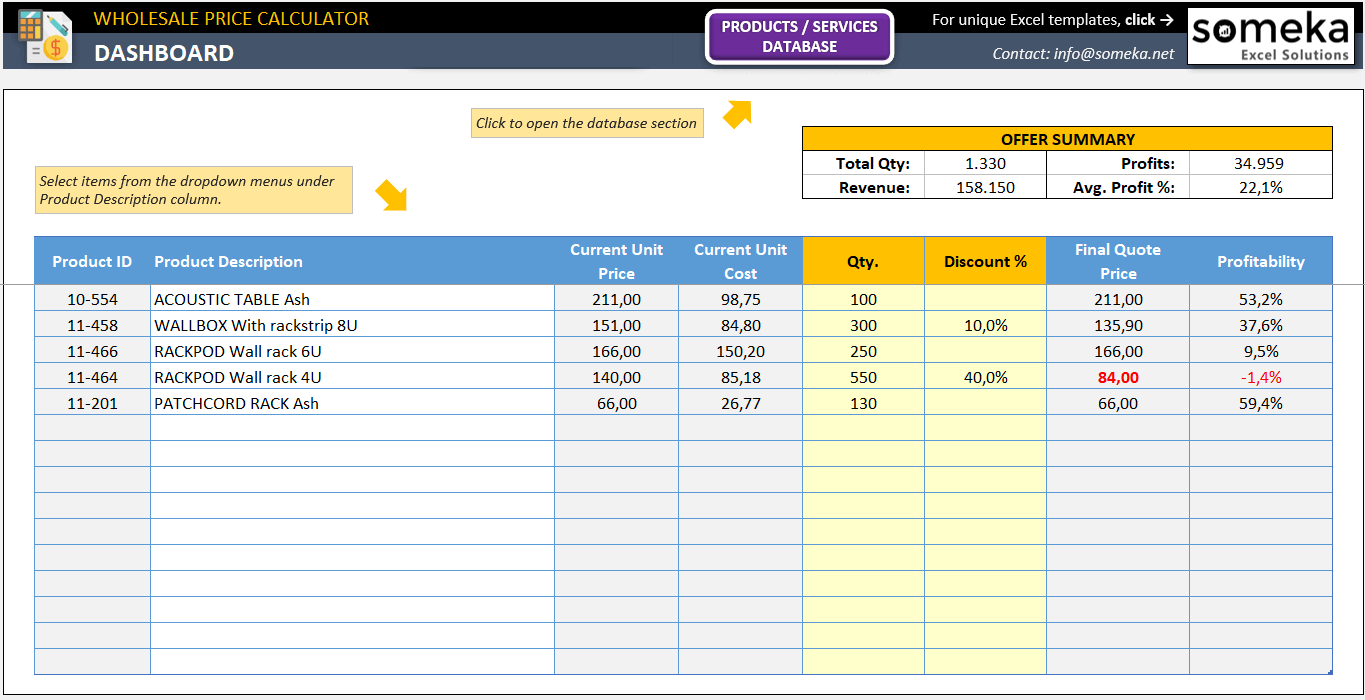
– This image is from Wholesale Price Calculator by Someka –
As a result, as you can see from these examples, what we call Weighing Factor and Weighted Average are calculated in this way. You can also look at our products regarding this.
5. Final Notes
Weighted averages has a wide range of usage in both personal life and business. Even in our daily decisions our brain is continously making weighted average calculations.
Recommended Readings:
How to use Excel AVERAGE function
Overview of Risk Assessment Process: Importance, Steps, and Framework
What is a Pareto Distribution? Here is an Eye-Opening Guide to Pareto Charts!
Related Posts