How to Calculate P Value in Excel?
Contents
What is the P Value?
P-value is a statistical term that helps you to determine, if the hypothesis you use is true, the probability of the sampling variation. It simply tells us what are the odds of getting these results if our null hypothesis is true.
- A null hypothesis is a hypothesis that claims the results we get are caused by pure luck.
- An alternate hypothesis claims that the results we get are not luck but there are outside elements that affect our results.
It is a very important and commonly used statistical term and can be easily calculated in data analysis programs like Microsoft Excel. In this article, you will learn how we use it, where do we use it and how can we calculate it in Excel in various ways.
Let’s begin!
Why Do We Need The P-Value?
While doing research with large populations you have to calculate the statistics for each individual. But even in such a case, you can’t be sure if something is happened because of coincidence or simply luck since it is impossible to observe everything. This is where statistics come in.
Statistical calculations cannot give you an absolute truth but they will help you have a good idea of your researches.
P-value allows us to test the hypothesis on our subject. We can compare the mathematical results to these hypotheses and reconsider our path without spending a great amount of time in research.
Where Do We Use The P Value In Real Life?
We use the probability value where we try to test a hypothesis. It can be about research or a simple bet we made with our friend.
It is easier to understand it with examples.
Marketing:
Let’s say you are working within the marketing area and your recent project is on cereals advertising.
You have got produced a video for social media and you have got the information for rather users skipped it or watched it for a long time.
As an example, the common watch time of the video is 20 seconds. The mean is 20 seconds. And you made the decision to edit the video with a chunk of more joyful music.
Now how will you recognize if it worked? At this point, we use significance statistics.
First, produce a null hypothesis:
A null hypothesis claims that there is no correlation between what you invest and the results you get. It does not affect the results.
During this example, the null hypothesis will be this: “There is not any relationship between the changes you are applying to the watch time.”
Then, the alternative hypothesis:
The alternative hypothesis suggests that actually changing the music worked and now people watch the commercial for more than 20 seconds. Mathematically, the alternative hypothesis says:
“The mean is greater than 20 seconds now.”
Calculate the Significance Level:
Now we have to set a boundary threshold to calculate if we are successful or not. This is called a significance level is additionally referred to as the alpha value. It can be any percentage you would like, it is absolutely up to you.
But during this example, it will be 0,05.
Now to calculate with certainty we should always have all the data of watch time. But in terms of your time and sources, you should take a sample from the population:
- You took a sample of 100 people.
- These 100 people have 25 seconds of watch time for the commercial.
- It means the sample mean is 25.
This is a very simple version of the calculation. But the standard deviation of the sample is usually calculated in this scale if you don’t know the standard deviation of the entire population.
You can use the values you calculated for the sample since they are close to the population values. The sample mean is close to the population mean.
Calculate the P-Value:
The p-value shows us whether we can reject the null hypothesis or not. The probability that the sample mean is greater than or equal to 25 minutes given the null hypothesis is true.
There are two situations that may happen.
- If the p-value is less than the alpha you can reject the null hypothesis. You have got statistical proof that the alternative hypothesis is true.
- But if the p-value is greater or equal to the alpha you cannot reject the null hypothesis. It does not mean the null hypothesis is certainly true but it also cannot be avoided.
Probability
Let’s work on another example.
Your friend and you made toss coin in the air: If it is tails you lose 5 dollars and if it comes heads you gain 5 dollars.
- Your friend flips the coin once: It comes as tails. It is okay, there is a 50% chance that it will come as tails. Now, you assume the probability is 0,5 because you believe it is a fair coin. This is your null hypothesis.
- Second: It is tails. You lost another 5 dollars but it is okay because there is still a good chance of two tails in a row. The p-value is 0,25 and it is still a fair ratio.
- Third: it is tails once again. The chance of tails three times in a row is 0,12. It is not low so there is not enough proof that the null hypothesis is not correct. But you start to think that your alternative hypothesis could be correct.
- Fourth: It turns as tails again you will see how the chances are getting really low. It can be a miraculous coincidence but there is still a 0,6 chance and there is still not enough evidence to support the alternative hypothesis that says the coin is tricky. And you wait for the fifth flip.
- Fifth: It is tails. The chance of a coin turns out as tails five times in a row is 0,3 which is very low. This is the point you can reject the null hypothesis for there is not enough evidence to support it anymore.

You ask your friend to see the coin and when you hold it you realize it has two tails side and it is a tricky coin.
What did cause us to lose faith in our null hypothesis?
In a fair game of flipping coins, the chance of getting a heads or a tails is 50%. This is a situation where we believe the coin is fair but as the p-value drops our confidence in that hypothesis weakened too.
There is little chance of having random tails when the p-value drops under 0,05. So when you apply this statistical term on matters like cancer researches or effects of climate change it gains more importance.
Note: There is no specific reason we use 0,05 p-value for default calculation. The creator of the formula decided it was a good number for calculating and the default calculations stick with it.
0,05 means 5% in 100 individuals populations which falls into the normal curve. This is one of the reasons that it is commonly used. If you want to change it during calculating it yourself, you can.
How to Calculate the P-Value in Excel?
There is more than one way to calculate the p-value in Microsoft Excel. You can type down formulas or you can use Analysis ToolPak. This article contains how to do it both ways.
Use of Classic Excel Formulas:
Let’s start with the classic Excel formula way. There are two ways of doing this TDIST formula and T-test formula.
1.1) TDIST Formula
First of all, you will need a data set to calculate a p-value.
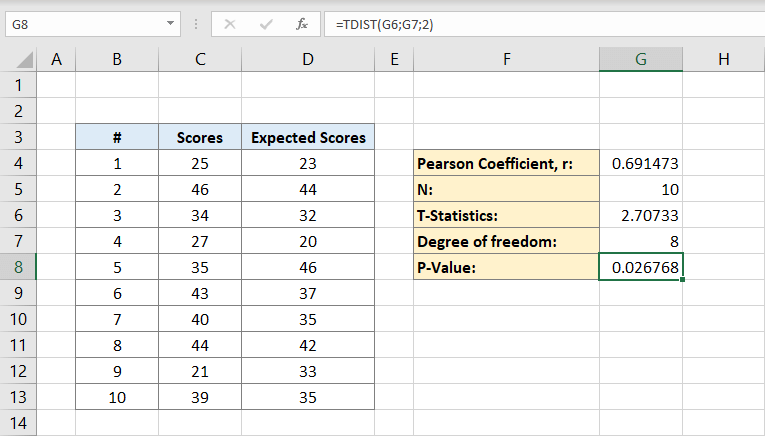
- Let’s say you are a teacher and you want to compare what your students scored in your last exam and what you expected their score to be based on their previous exams.
- You have the results 25, 46, 34, 27, 35, 43, 40, 44, 21 and 39 for your latest exam.
- Now for calculation, you need another tail, this is the score you expected based on previous tests: 23, 44, 32, 20, 46, 37, 35, 42, 33, and 35
Now, in order to use the p-value formula on Excel, you should calculate a few things beforehand:
Pearson coefficient (r): It is a statistical term that measures the linear correlation between two data. You don’t have to know the mathematical aspect of it to calculate the p-value. You will see the simple formula for it in the next paragraphs.
Population (n): n is the total number of individuals in your data set.
T statistics: It is the ratio of the deviation of data estimated value from its assumed value to its standard error.
Degree of freedom: It is the number of individuals in the data set minus two.

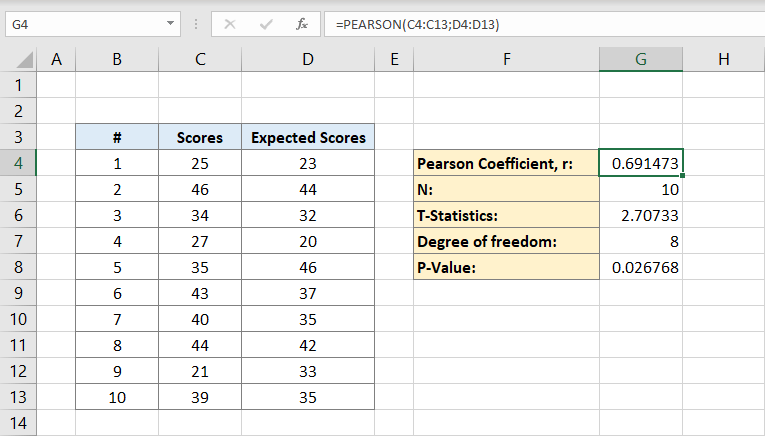
Now, the Pearson coefficient will be written on F4 in this example. After you click it you will type the formula:
C columns are for the scores and D columns are for the expected scores. The Pearson coefficient is 0,691473 in this example.
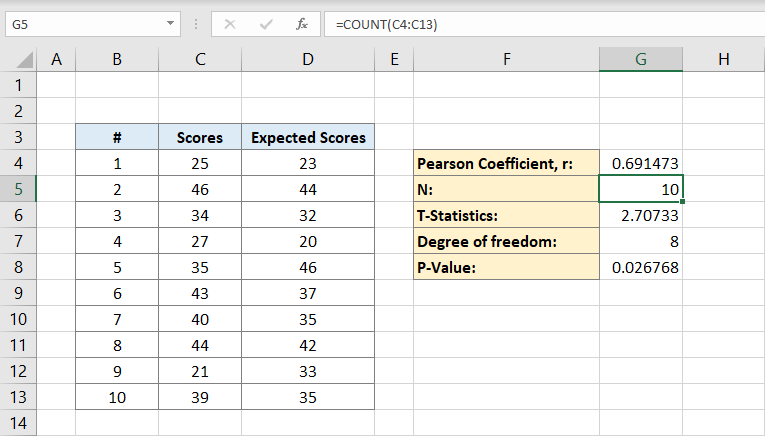
Next, you will type the number of individuals in the data set. If you know certainly how many individuals you have you can type it manually but if you don’t you can use the formula:
Why does the formula contain a C column only?
It is because we only need the individuals in one data set to calculate therefore one column will do. The cell G5 will now contain the number 10 in it. This is our population.
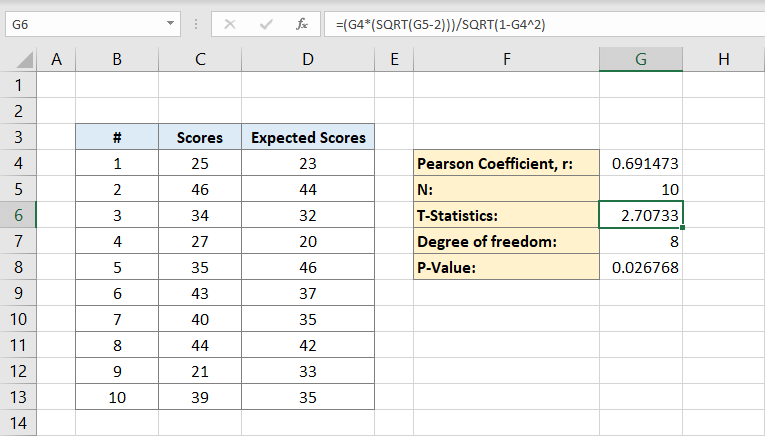
Now that you have both the Pearson coefficient and population you can calculate T statistics. The mathematical formula for T statistics is the Pearson coefficient (r) times sign square root of population (n) minus 2 divided by the square root of 1 minus Pearson coefficient squared:
The cell G6 will contain the result 2,70733. This is our T statistic.
After that, you will calculate the degree of freedom. You will type:
To the cell G7. This is the degree of freedom. It will be at 8.
Now you have all you need to calculate the P-value. The cell G8 will contain the formula for it. That is:
Or
The result will be 0,026768. This is the p-value for the data set.
1.2. T-Test Formula
The second way of determining the p-value with Excel formulas is using the T-test formula. It is a little bit similar to the previous example but shorter.
- Let’s say the data set is the same, you have the results 25, 46, 34, 27, 35,43, 40, 44, 21, 39 for your latest exam.
- Expected results are 23, 44, 32, 20, 46, 37, 35, 42, 33, 35.
- You are going to add a third column for the difference between what was expected and the actual score. In the difference column 2, 2, 2, 7, 11, 6, 5, 2, 12, 4 will be written from E4 to E13.
Now type T-Test to the cell E8. You are going to write the T-test formula to the blank cell next to it. That is:
And this formula will give you the p-value directly.
Determine the P-Value with Excel Tool Pak
Took Pak is a pack that allows you to calculate various statistical measurements automatically so it is easy and very handy. It is also easy to install.
Step 1: Go to settings. There’s an “Add-ins” button at the bottom of the left corner, click it. A new window will appear, find the “Analysis Tool Pak” option, click it, and then click the go button at the bottom of the window.
Step 2: Activate the add-in by clicking the tick symbol next to it and after the OK button on the right column.
Step 3: If you managed to activate it properly a “Data analysis” button will appear on the top menu of your worksheet to the right side.
Step 4: Click the “Data analysis” button and choose the “t-Test: Paired Two Sample for Means” option. Click OK after that. A new window will appear.
Step 5: It will ask the inputs in the first row of the window. Type C4: C13 to the “variable 1 range” box. You will type D4: D13 to the “variable 2 range” box. Leave the alpha box with its default value.
Step 6: In the second row of the window you can select where to monitor your results. It can be a new worksheet or any blank cells. If you want the result on a cell make sure you lock the column and the row. Click the OK button after that.
Tip: Use the dollar sign before the letter and number to lock the column and row. For example, if you want to lock A2 cell you type $A$2.
Step 7: The Excel will calculate the mean, variance, observations, Pearson correlation, hypothesized mean difference, t statistics, p-value, and more.
FINAL WORDS
P-value is easy to calculate and adapt in many different situations. It helps you to get the information you need without spending a lot of time or effort on it. It is even easier to calculate when you use statistical analysis programs like Microsoft Excel that come with the right tools and formulas. Let’s check Someka templates collection and download statistical templates to make your job easier!
Related Readings:
Related Posts