Weekly KPI Report in Excel
Download Weekly KPI Report Excel Template. Compare Actuals vs Targets on weekly basis. Ready spreadsheet. Cumulative charts included. Editable and printable.
TEMPLATE DESCRIPTION
Here’s a Weekly KPI Report in Excel. A simple, yet powerful spreadsheet to track actuals vs targets for your key performance metrics in weekly basis.

With this weekly KPI Dashboard:
- Define your KPI metrics
- Set your targets for each week
- Input your actuals
- Track your performance results at a glace!
How to use Weekly KPI Report Excel Template?
Basically, this kpi excel spreadsheet includes 2 main parts:
- Menu
- KPI Report
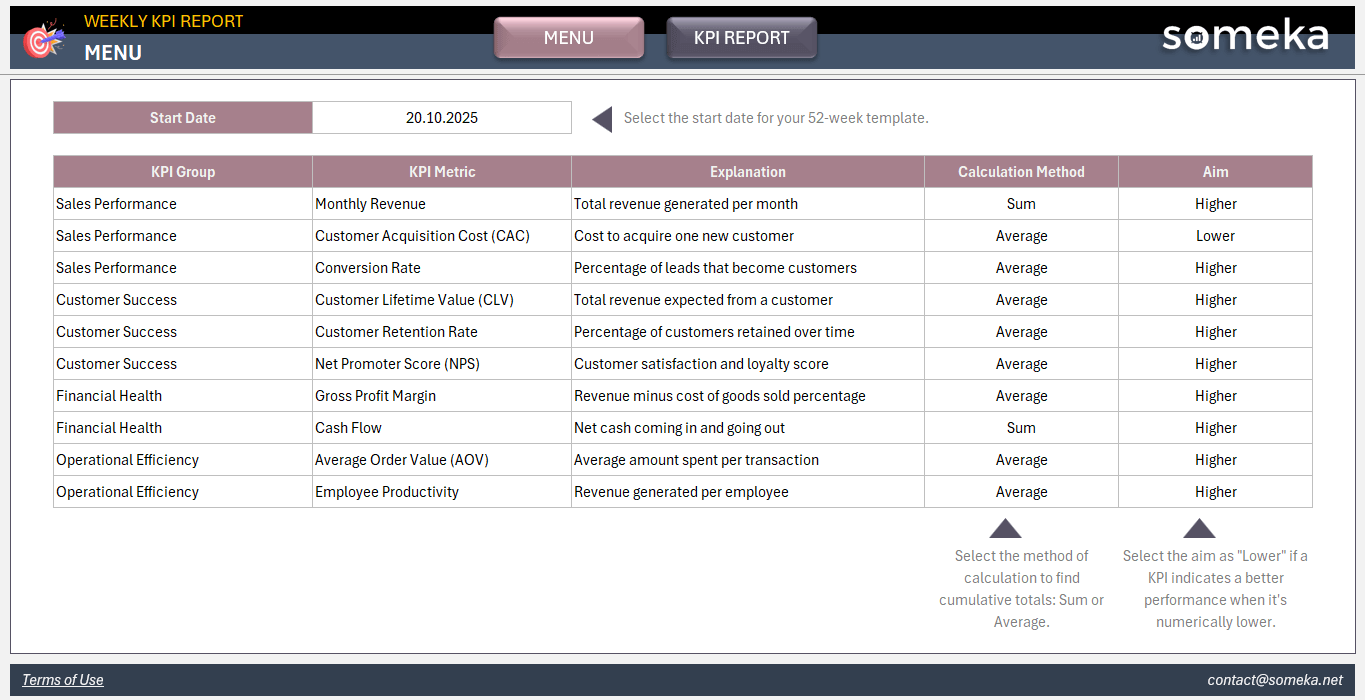
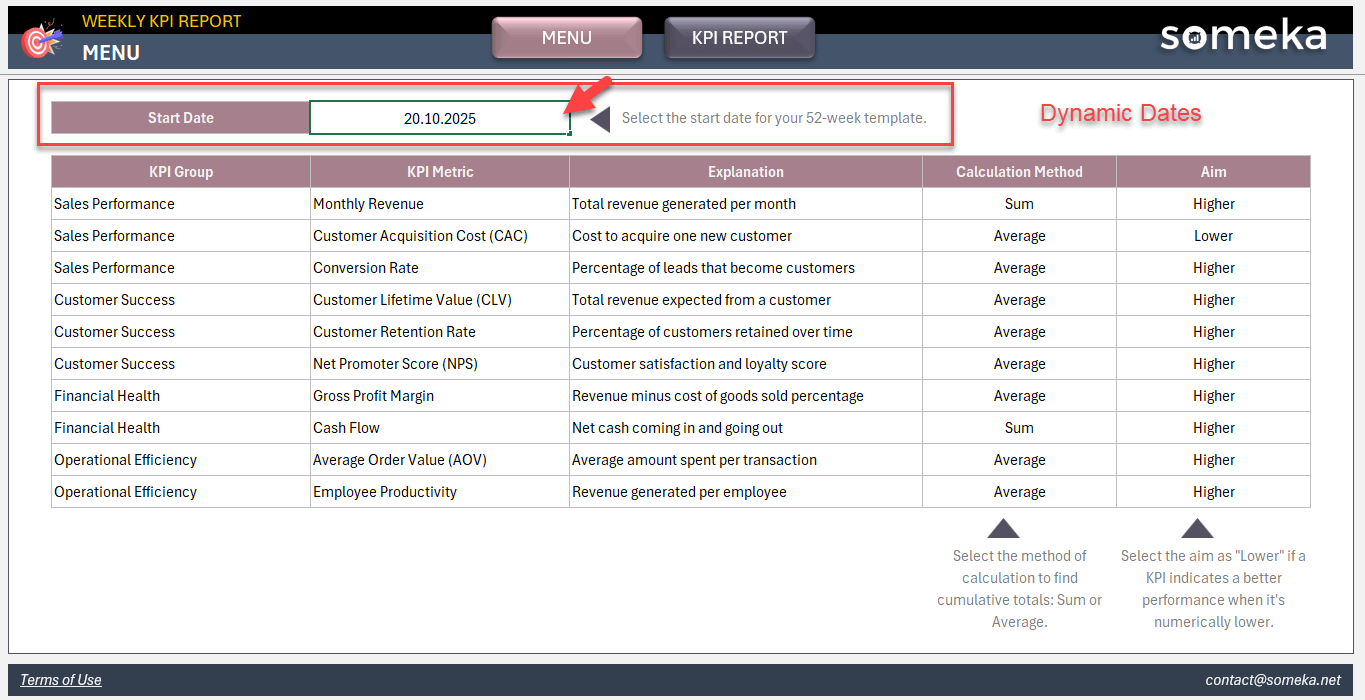
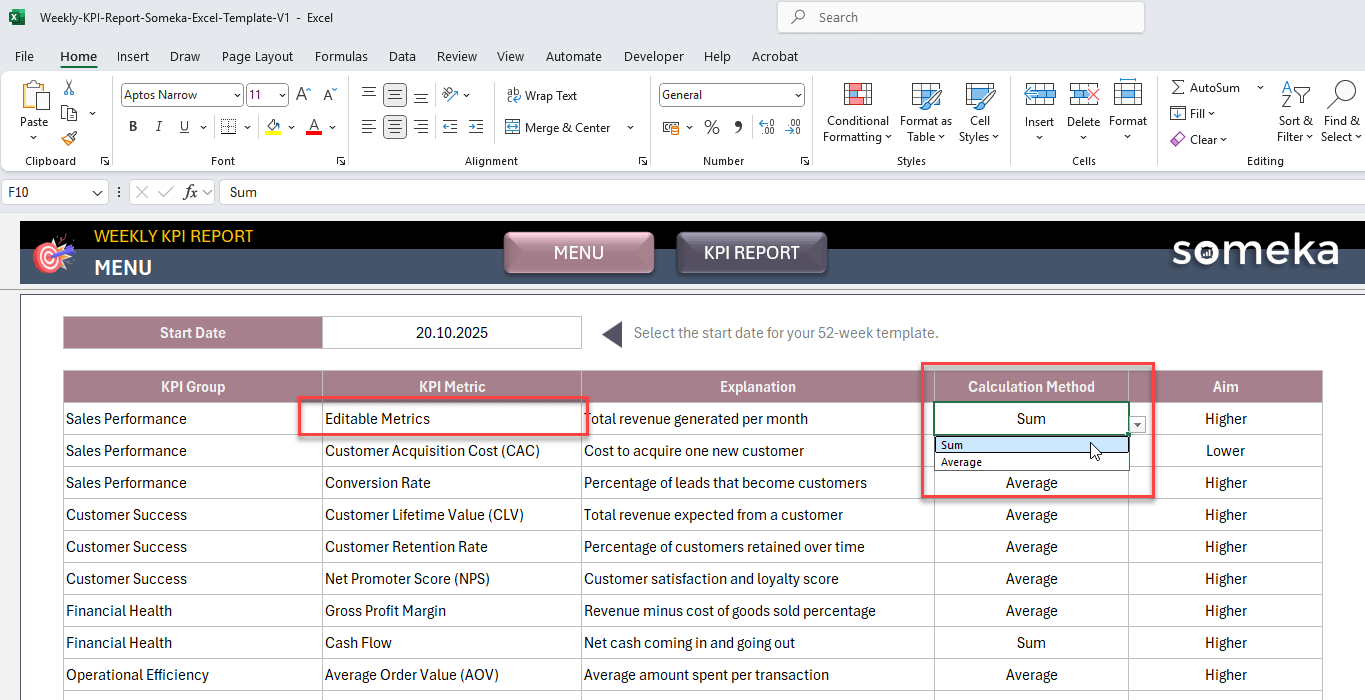
1. Menu
Firstly, you should define your starting date for the kpi excel template.

Then, you should set your key metrics for the weekly kpi report. Add the KPI Group name and KPI Metric Name.
Optionally, you can write an explanation for each metric for your reference.
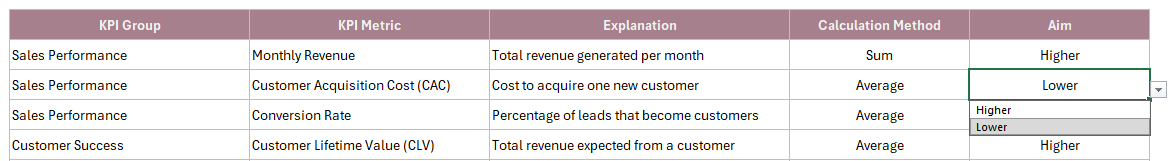
There are two important parameters for each metric:
- Calculation Method: Select Sum or Average. So, this will be used while calculating the cumulative totals for metrics. Mostly, the numeric value metrics like revenue, traffic, etc are used with Sum calculation, whereas the ones with percentages such as conversion rate, productivity etc are used with Average calculation method.
- Aim: If you aim higher for a metric select “Higher“. But if the opposite is valid for a metric, then select “Lower“. For instance, you should expect a “Lower” value for a metric like accident number.
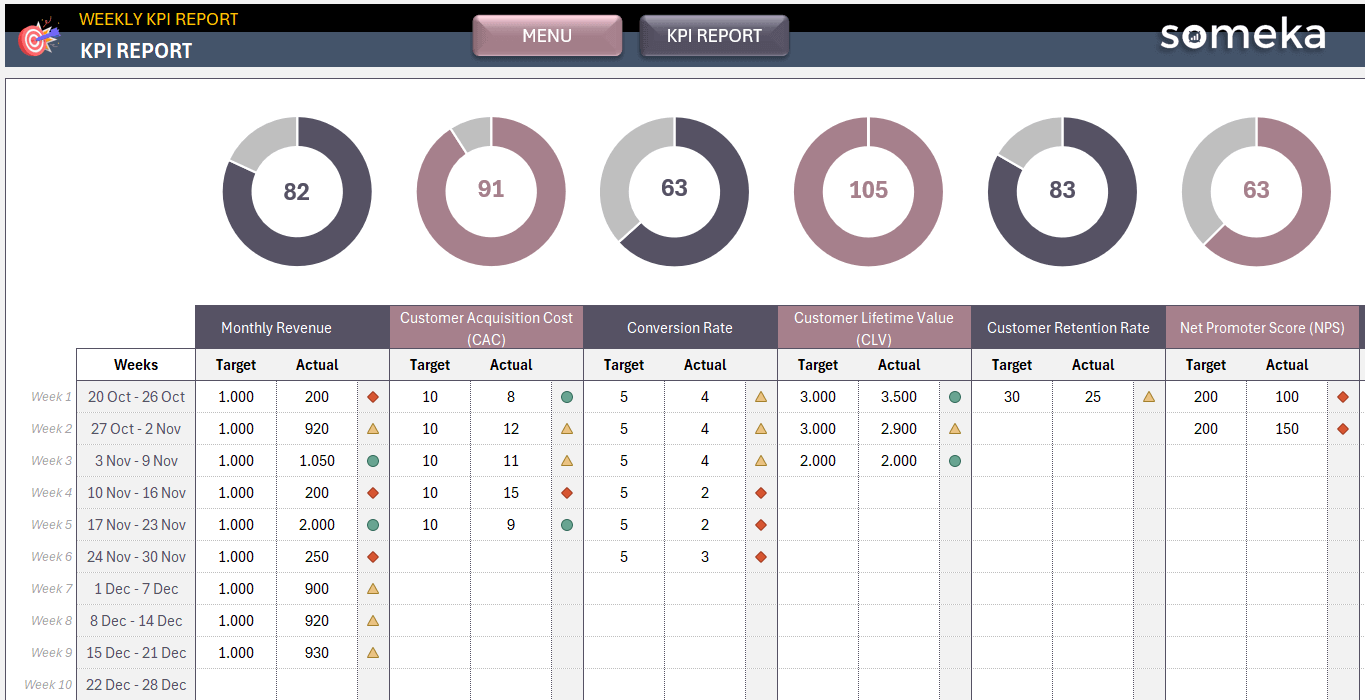
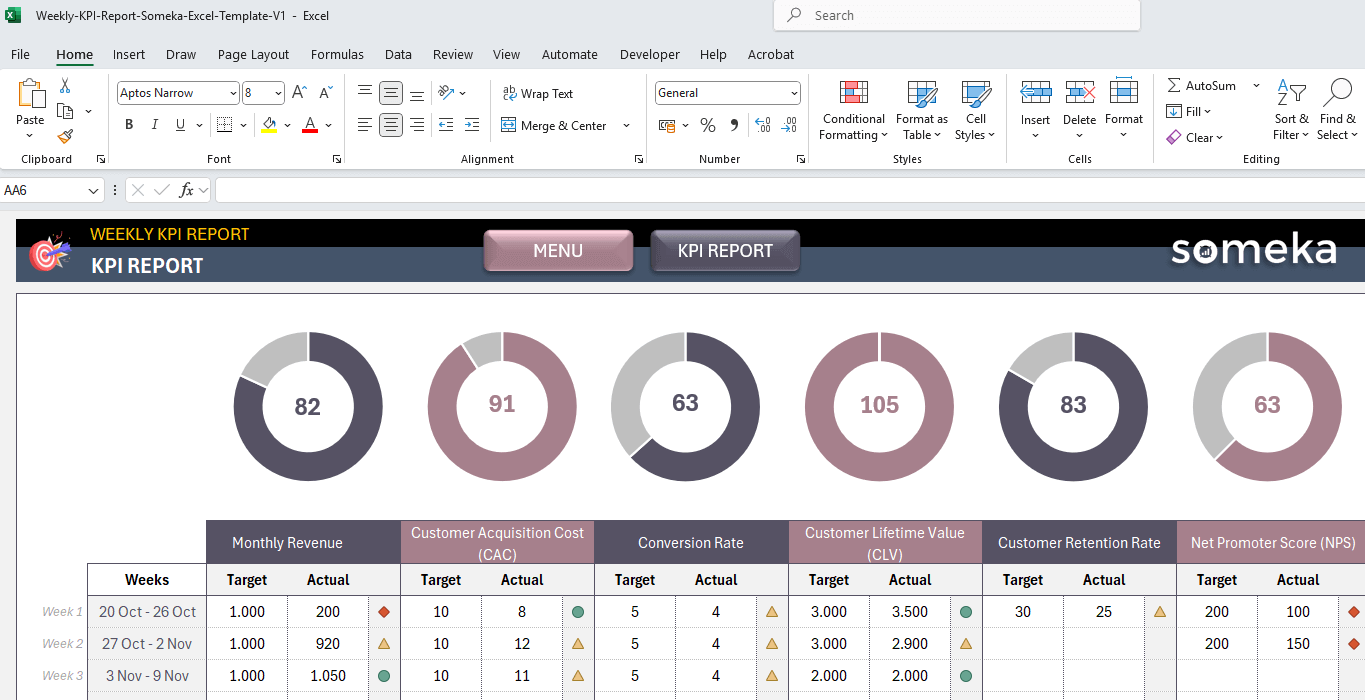
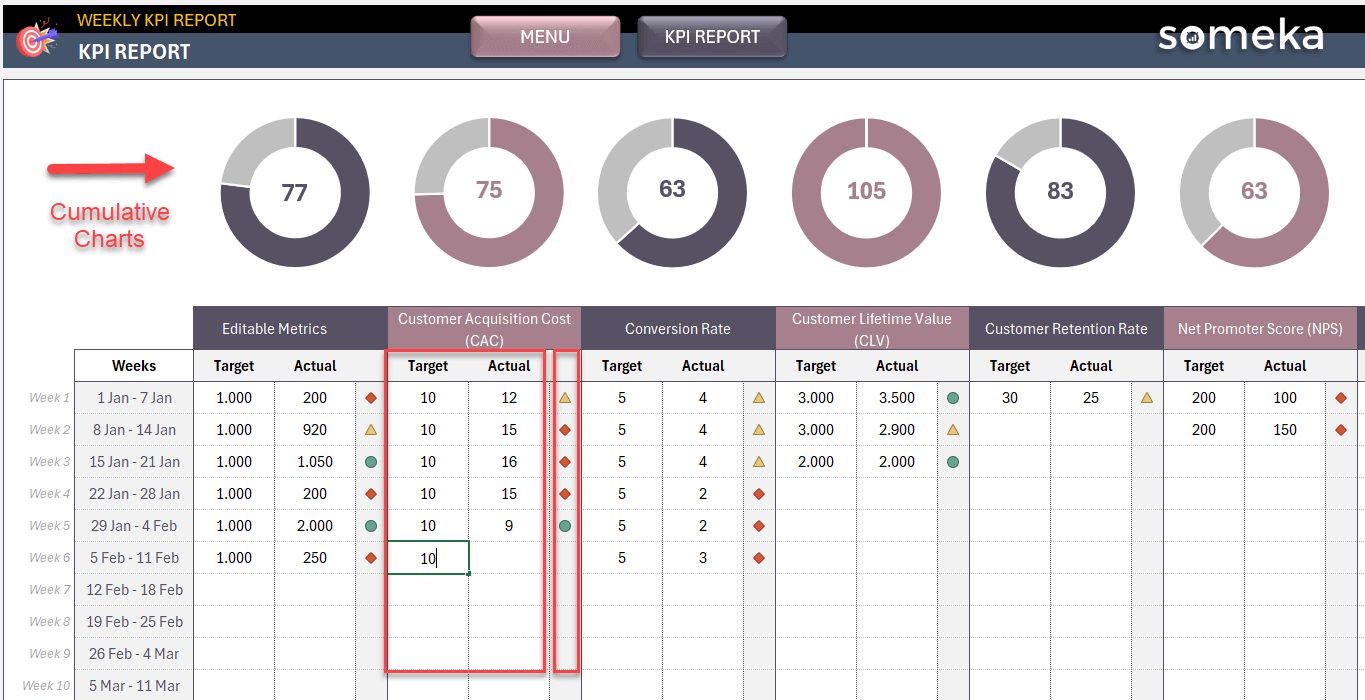
2. KPI Report
In brief, this section is your main area to track weekly targets and actuals.
The dates will be automatically listed according to the Starting Date set on the menu of this weekly kpi report. Also, the metric names will be ready for you here.
So, all you have to do is define your targets and then input your actuals.
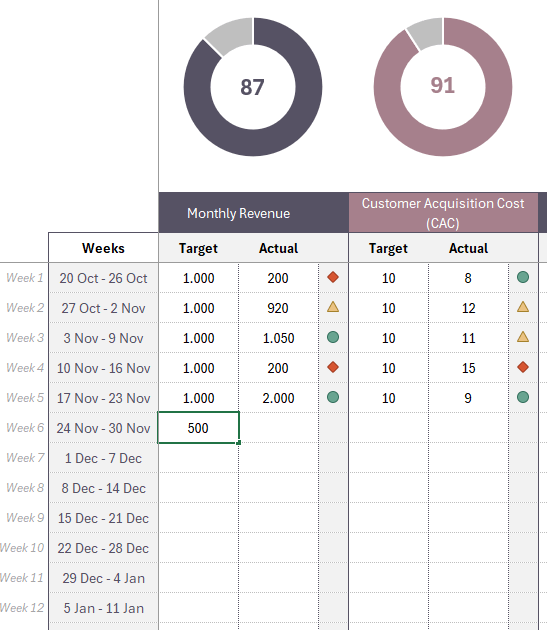
The little icons will show your actual’s position against your target. If you attain your target %100 or more, then you’ll see a green icon. But if you are %80 below your target, you’ll see a red icon. For other values, you’ll see a yellow one.
Weekly KPI Report Excel template will also show you the cumulative status on the doughnut charts just above each metric.
That’s all for the kpi report in weekly basis.
Excel Weekly KPI Report Features Summary:
- Simple KPI tracking spreadsheet
- All-in-one Excel template to track weekly targets and actuals
- Cumulative charts included
- Also, flexible and customizable
- Printable and editable kpi dashboard
- No installation, no setup
- Works both on Mac and Windows
- Compatible with Excel 2010 and later versions
- Does not include any VBA macros
FREQUENTLY ASKED QUESTIONS
Weekly KPI Report Excel Template Product FAQ
Surely. All Someka templates are editable and customizable. You can set your own metrics and starting date.
Weekly KPI report is a simple dashboard to keep track of your targets and actuals for key performance metrics on a weekly basis. You can analyze your position against your targets.
Yes, Excel is an excellent tool to track your KPI metrics, especially for small businesses, freelancers, and self-employed individuals. Excel will provide you with flexibility and customization.
Absolutely. The KPI report will also show you the cumulative status for a general overview.
All the sections, are print-ready. Simply, you can export to pdf or use them on your slides.
All Someka templates come printable.
USER REVIEWS & COMMENTS
You must be logged in to post a review.
RELATED TEMPLATES
-
 This product has multiple variants. The options may be chosen on the product page
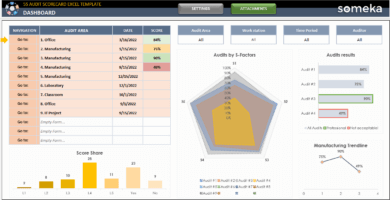
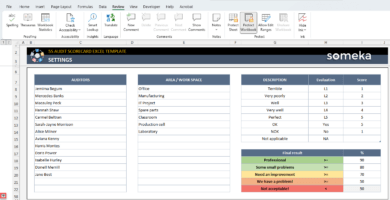
5S Audit Scorecard Excel Template
$0.00 – $69.95Process management tool in Excel. Assess your workplaces in the 5S Audit framework. Auto radar chart generator & professional dashboard included.
-
This product has multiple variants. The options may be chosen on the product page
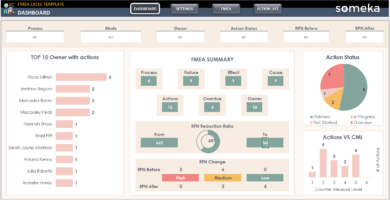
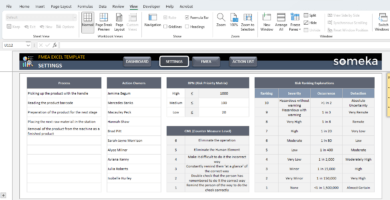
FMEA Excel Template
$0.00 – $69.95Risk analysis tool in Excel. Detect failure modes and plan preventive actions with FMEA model. Dynamic dashboard included. All print-ready.
-
This product has multiple variants. The options may be chosen on the product page
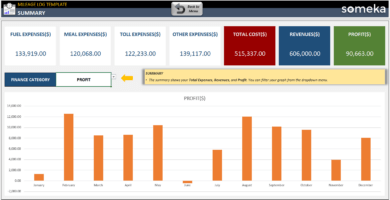
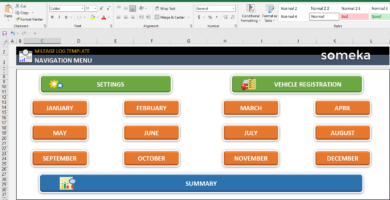
Mileage Log Template for Excel
$0.00 – $59.95Excel mileage log to track your trips. Keep a record of company journeys and calculate the expenses month by month. Dashboard included.
-
This product has multiple variants. The options may be chosen on the product page
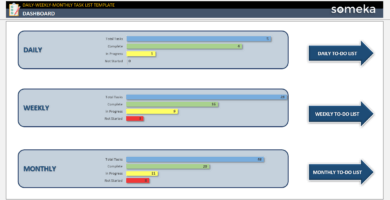
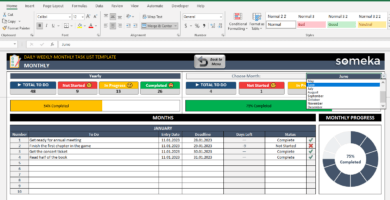
Daily-Weekly-Monthly Task List Excel Template
$0.00 – $69.95Excel Task List Template on a daily, weekly, monthly basis. Save your headspace and keep track of your to-dos easily. Works in Mac & Windows.
-
This product has multiple variants. The options may be chosen on the product page
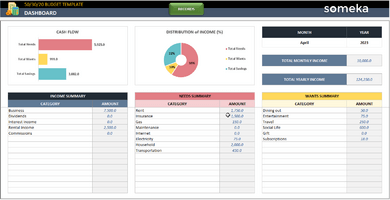
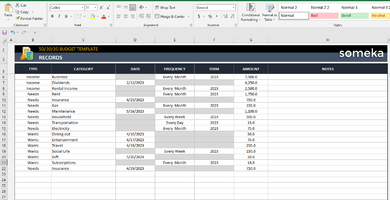
50/30/20 Budget Excel Template
$0.00 – $49.9550/30/20 simple budget template in Excel. Input your income, wants, and needs. Track the ratio of your savings in your budget. Ready to use template.
-
This product has multiple variants. The options may be chosen on the product page
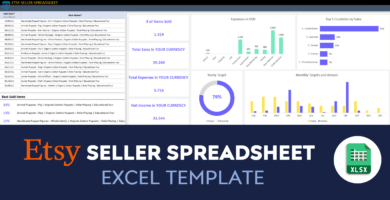
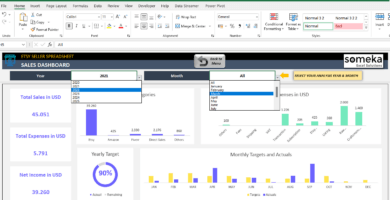
Excel Etsy Seller Spreadsheet
$0.00 – $69.95Bookkeeping template in Excel for Etsy shop owners. Track your sales and expenses on a nice-looking dashboard. Import data feature with instructions.
Reviews
There are no reviews yet.