Brazil Geographic Heat Map Generator Excel Template
Unique Excel Template to create Brazil Heat Map instantly. Enter your own data and Brazil states get painted automatically with VBA.
TEMPLATE DESCRIPTION
Geographic heat map is a favorite method for data visualization/presentation of geographical values. While presenting those values, we use color sets and shades in order to show individual data points. If you are interested to create a Brazil Geographic Heat Map, this Excel Template is for you!
Why Do We paint maps In Order To Present Data Sets?
In today’s modern world, we’re much more attached to data and information than we were yesterday. On the other hand, as technology improves, we became more capable to reach more data that are ready to be presented. But the more data we have, the easier and smarter ways we have to find out in order to tell them to our audience.
For this reason, data presentation and visualization through geographic heat maps have become an effective solution for telling and reading sophisticated data sets.
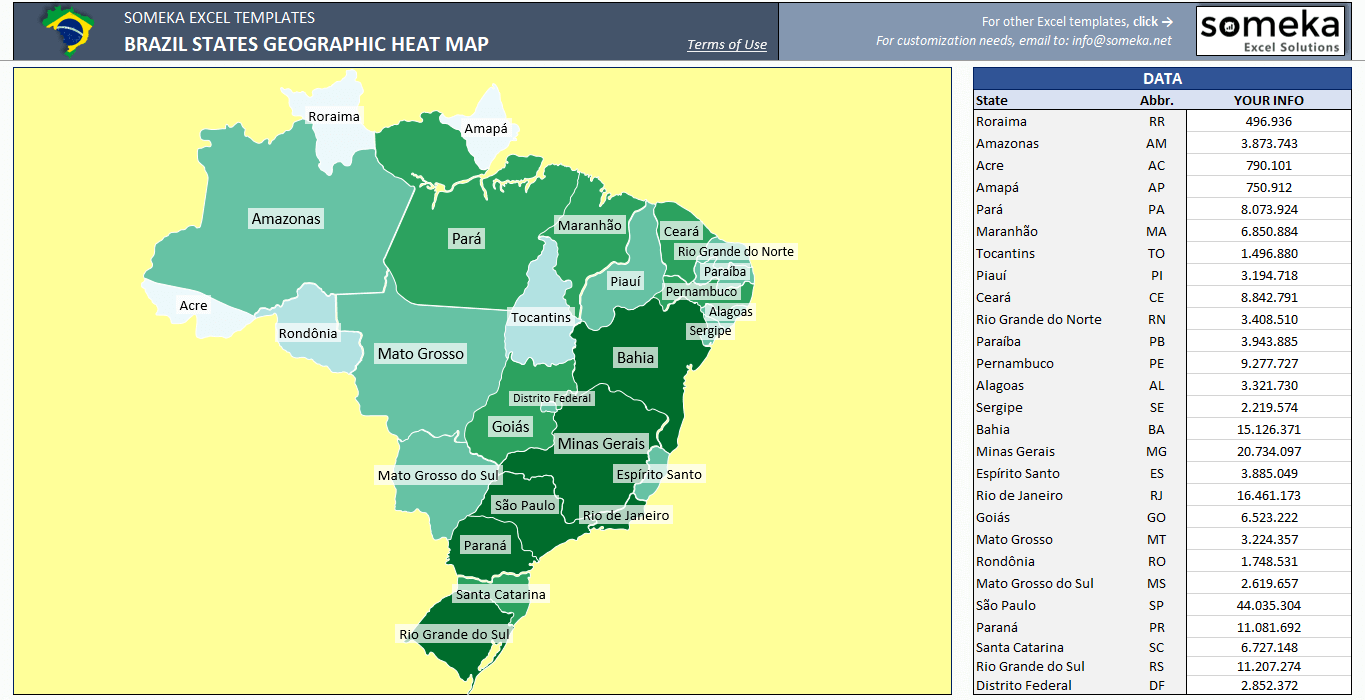
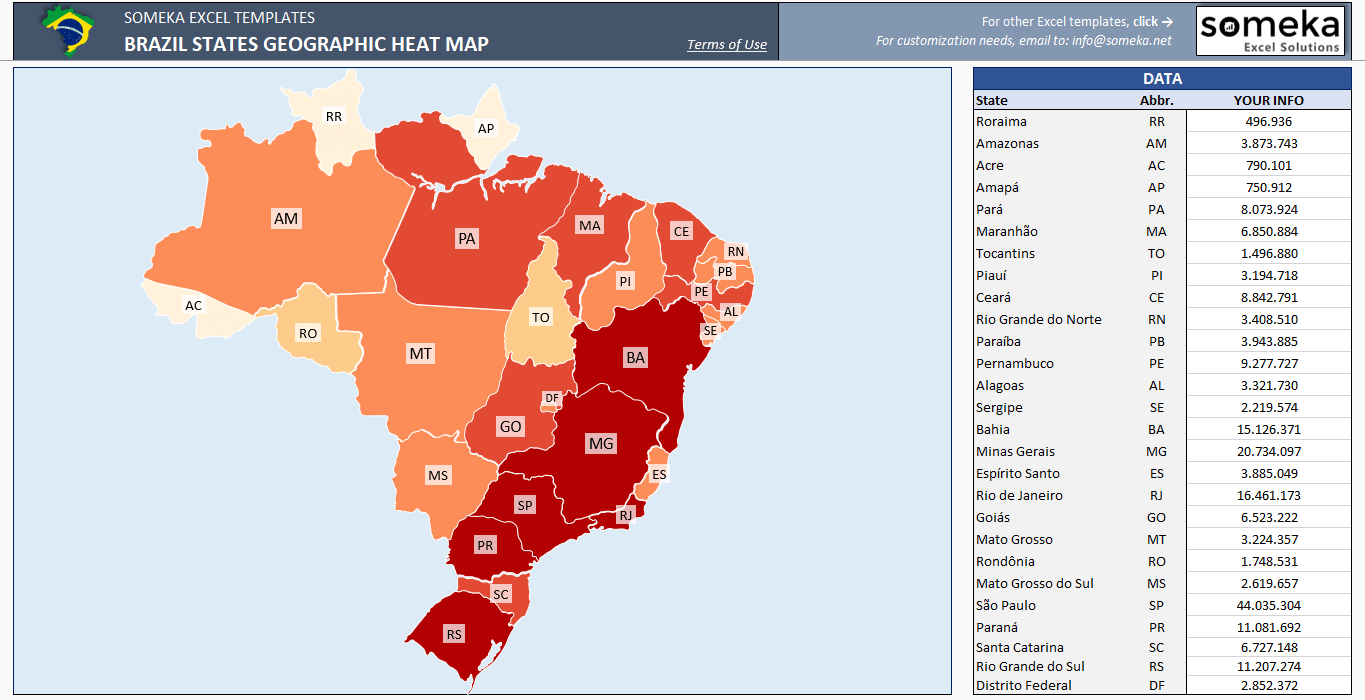
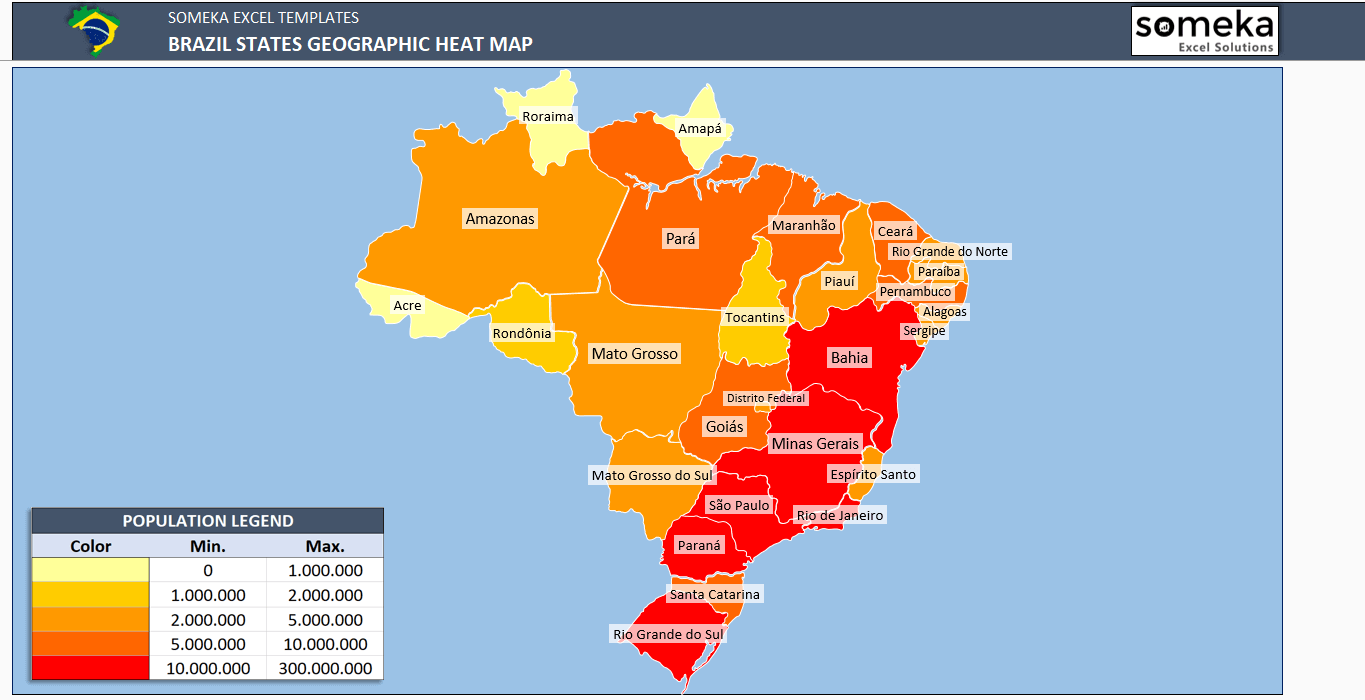
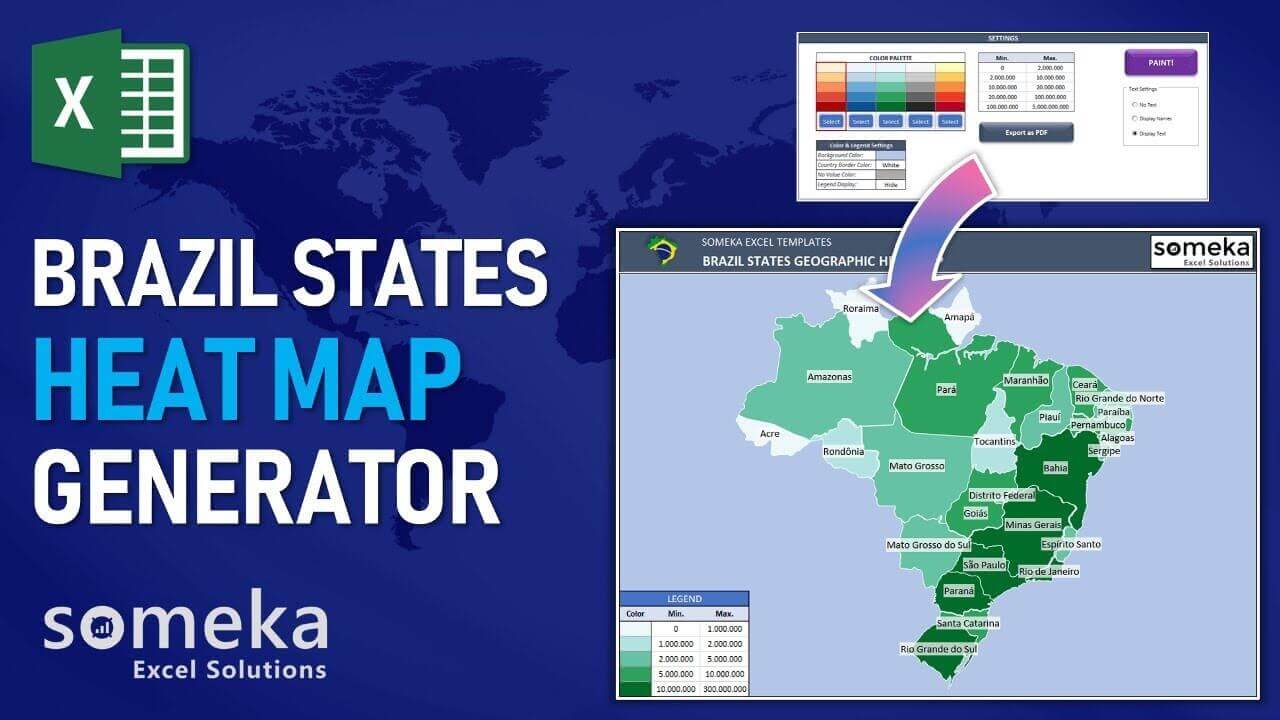
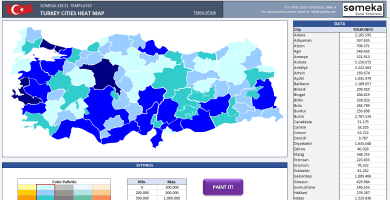
Thanks to heat maps or choropleth maps, your audience is able to read and understand clearly, what you are trying to tell. Furthermore, it is definitely more professional and smarter to use heat maps for your presentations instead of presenting a set of raw data. See how Brazil heat map looks like:
We use geographic heat maps in various areas. Especially, the business world is frequently making use of this effective data visualization method for their daily reports and presentations. As we all know, another area where geo heat maps are popular is meteorology science. Sociology, economics, politics, and medicine are other fields in which we use geo heat maps.
How To Create A Geographic Heat Map?
Unfortunately, it is not so easy to create a geographic density map from scratch. The development of this tool in Excel consists of 4 main parts:
- Create/Gather Visual Assets
- Set up the Data Table and Name Shapes
- Create the Legend and Color Scale
- Automate with VBA
As you see, it takes a lot of time and effort to make a heat map on your own. Therefore, we have created ready-to-use geo heat maps for continents, countries, and cities, in Excel. Geographic Heat Map of Brazil States at region level is one of these heat map templates.
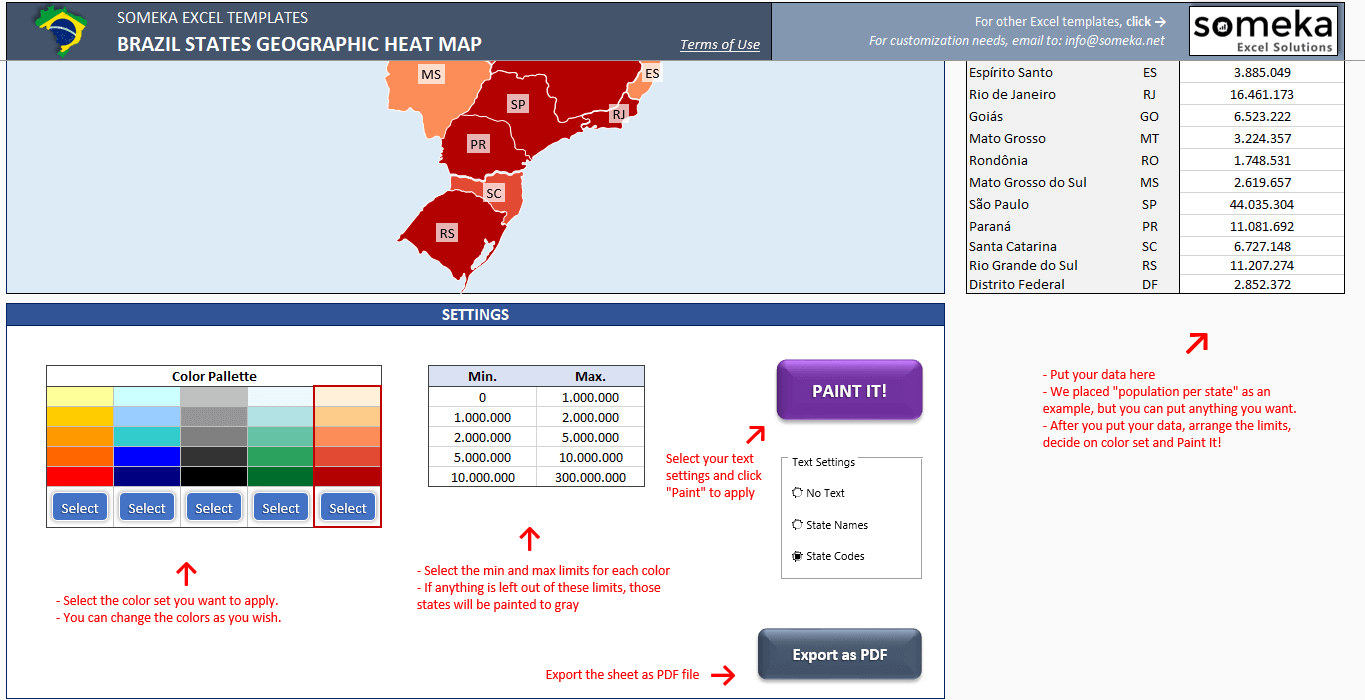
In 3 basic steps your Brazil Heat Map gets ready:
- Step: Paste/Type your data from your own spreadsheet
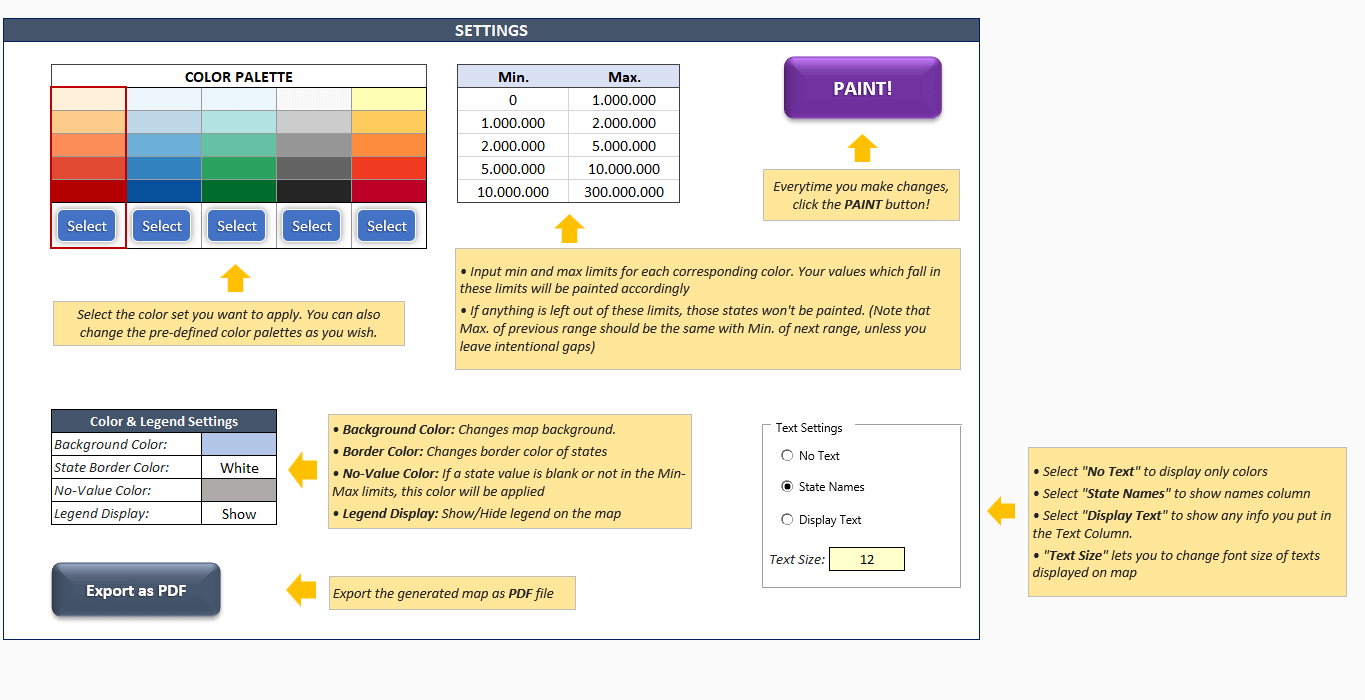
- Step: Choose your limits for data ranges
- Step: Choose your color set and click the button!
You will see that heat map of Brazil States gets generated automatically within minutes!
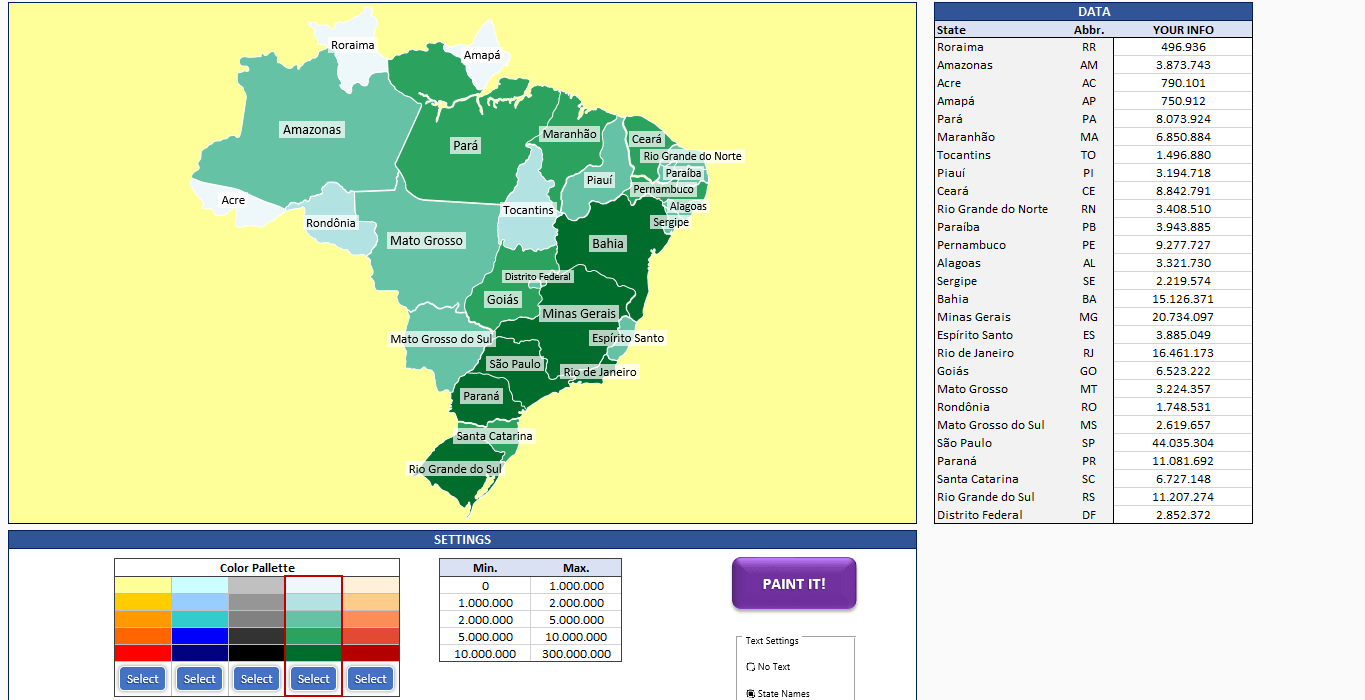
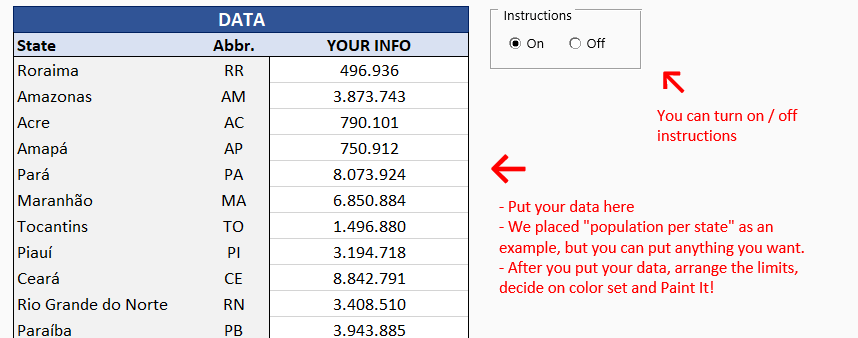
On-sheet instructions in the template will guide you while using the template. We have used population data just for illustration but you can easily put your own data and prepare your heat map:
You can print the results or export them to PDF as you like.
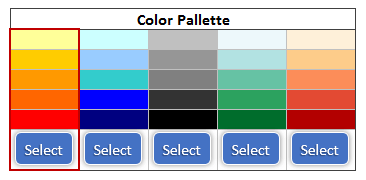
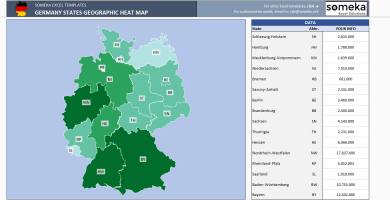
Template offers 5 different color palettes to choose from. Additionally, you can change the colors and choose from your own defined palettes:
For other country’s heat map generators, check our templates:
Someka Heat Maps Collection
Brazil Heat Map Generator Excel Template Features Summary:
- Fully editable Geographic Map of Brazil including 27 states
- Easy to use and nice design
- 5 Premade color sets to choose from (you can even modify as you wish)
- Export to PDF feature
- Clear on sheet instructions (with turn on/off function)
- Print Ready
- No installation needed, ready-to-use
- Works both on Mac and Windows
- Includes VBA codes and macros
- Compatible with Excel 2007 and later
PRODUCT VIDEO
Watch the video below to see the template in action! Presentation also includes usage notes, explanations and tips & tricks about the template.
USER REVIEWS & COMMENTS
11 reviews for Brazil Geographic Heat Map Generator Excel Template
You must be logged in to post a review.
RELATED TEMPLATES
-
 This product has multiple variants. The options may be chosen on the product page
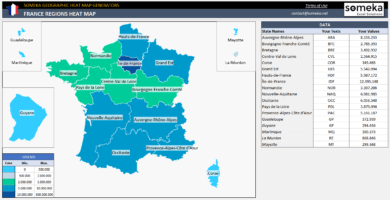
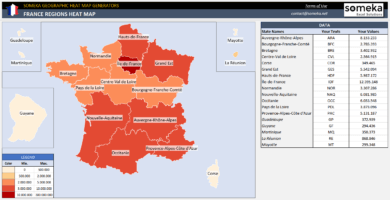
France Geographic Heat Map Generator Excel Template
$9.95 – $19.95Excel Heat Map Generator to paint France provinces automatically according to your data. Make inputs in Excel and your geo heat map created instantly.
-
This product has multiple variants. The options may be chosen on the product page
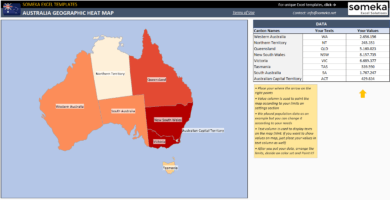
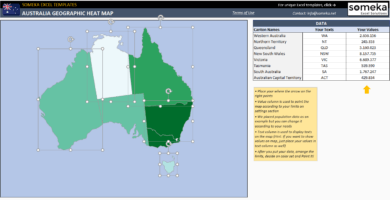
Australia Geographic Heat Map Generator Excel Template
$9.95 – $19.95Dynamic Excel spreadsheet to create Australia Heat Map. Paint states automatically according to your data. Editable shapes compatible with Powerpoint.
-
This product has multiple variants. The options may be chosen on the product page
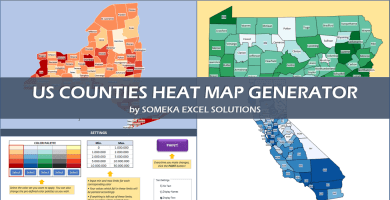
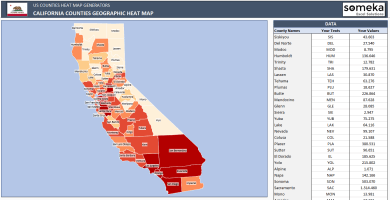
US County Heat Map Generator Excel Templates
$39.95 – $79.95Excel Template to generate heat maps for US Counties. Visualize your data in an editable spreadsheet. Copy paste shapes into Powerpoint.
-
This product has multiple variants. The options may be chosen on the product page
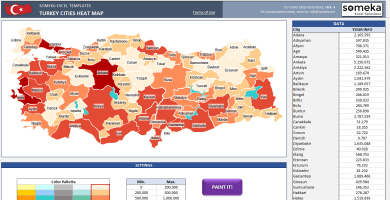
Turkey Geographic Heat Map Generator Excel Template
$9.95 – $19.95Unique Excel Template to create Turkey Heat Map. Just put your data and your printable density map will be generated automatically.
-
This product has multiple variants. The options may be chosen on the product page
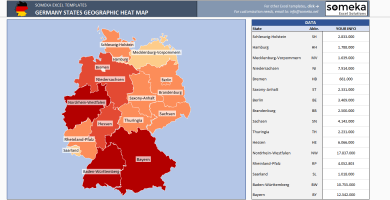
Germany Geographic Heat Map Generator Excel Template
$9.95 – $19.95Unique Excel Template to Make Dynamic Germany Heat Map at Region Level. Enter your data in Excel and your heat map gets created instantly.
-
This product has multiple variants. The options may be chosen on the product page
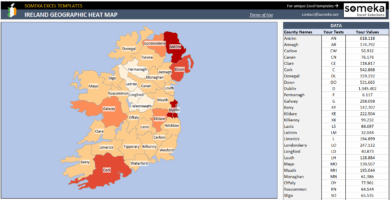
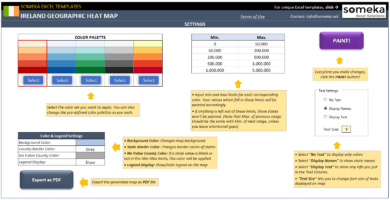
Ireland Geographic Heat Map Generator Excel Template
$29.95 – $59.95Spreadsheet template to create Ireland Counties Heat Map. Transform your numbers and geographical data into a map chart in Excel!
Nayef Ahmed –
Can you make this for Google Sheets?
Someka –
Hello! At the moment, we don’t have a Google Sheets version of this template, but we hope to have one in the near future.
Becca Oyali –
It was incredibly simple to buy and start using this template! I was able to purchase it, download it, and begin using it in a mere five minutes. Additionally, the interface is very clear and straightforward.
Steen Tych –
This product is really easy to use, and the customer service is top-notch!
Priya Mizele –
So helpful and intuitive!
Domenic –
NOT WHAT I EXPECTED.
Someka –
We apologize that you’re not satisfied with our product.
If you would like to request a refund, please email us at contact@someka.net and we’ll do our best to assist you.
Cigdem –
Will make me more efficient. Tanks
Rohan S. –
This template is fantastic! It arrived quickly and is super easy to use!
Vandana Martinez –
This is perfect! Exactly what I was looking for.
Cheryl M –
I’m extremely pleased with the excellent quality of this product. It is very useful.
Nirriti –
I don’t know the password to unlock!?
Someka –
Hey there! To use the Excel template from Someka, you have to unlock it first. We have created a guide with pictures that will show you how to unlock template. Just follow the link and you’ll be good to go!
Despina Mat –
I found an amazing Excel template – just perfect for my needs!