
20 Most Asked Excel Job Interview Questions for Financial Analysts
If you are a financial analyst, your job is to be the financial consultant to a company and provide them with the necessary information and analysis. This blog will tell you about excel for financial analysts with detailed interview questioned and answers in addition to top financial tools.
By assessing the current financial market, catching up with the current trends and forecast possible situations, your opinion is crucial for the financial future of the company. Your word will help the company invest in better business and evaluate their financial decisions.
And saying that your job is very crucial is not an understatement at all. You are the one standing between the business and its financial failures. And also, this is the reason that companies, while hiring a financial analyst, will turn to important interview questions. One of the subjects they will ask you for a financial analyst job is Microsoft Excel. Due to the fact that it is the most used tool among the financial analysts and the companies they work for, you should focus on your Excel skill.
Of course, the interviewer will ask common questions about yourself, your finance knowledge and your desire to work for the company in general as well. For example, questions such as ‘why do you want to be a financial analyst?’ or ‘why do you want to work in this company and not others?’ are the most common and the somewhat cliché ones.
In this blog post, the questions are focused only on your (as a financial analyst) Microsoft Excel skills and general knowledge.
What tool would you use to create visual graphs, charts and spreadsheets?
Yes, the interviewer can transition to the Microsoft Excel question with the Excel topic hidden in one of the questions. As a financial analyst, Microsoft Excel is one of the most (if not the most) used tool in your arsenal. And also, if you look at the tools which you can create visual graphs and charts with, there is not much of a competition there.
A sample answer for this question can be: “Microsoft Excel has always been and will be my main tool in order to create illustrated graphs, charts or enter data for spreadsheets. They are used by millions, if not by billions, of experts around the world because it is very user friendly and stacked with functions.”
If you’re not sure about your portfolio, you can enhance your cv with articles, and use essay writer online in finance services. So, this will help you to position yourself in a more expert community.
Do you think it is important for a financial analyst to be used to VBA?
Now, before the job interview, practice your knowledge of Visual Basic for Applications (VBA) as well. The possibility of coming up in the interview and then later, in the job itself depends on what type of position you applied for. However, it is never a bad thing so study and learn a useful tool which can help you on the job interview and then at work.
A sample answer: “Regardless of what kind of company or which position they are applying for; a financial analyst should be used to every modern and useful tool they can find. And VBA is one of them, with the help of macros, it can be a helpful tool in the work process.”

What is a pivot table? When do you use it?
The chance of a pivot table or a pivot chart question coming up in the job interview is higher than any other topic. It is one of the most utilized tools of Microsoft Excel you can use as a financial analyst.
A sample answer for a pivot table question can be: “Pivot table is a feature of Excel that is used for sorting, summarizing and filtering the data. It can be used when dealing with a vast quantity of data.”
What is the LOOKUP function in Excel?
It is not possible to memorize and study every function of Microsoft Excel because it has more than 400 of them. But what you can do is research and practice on the most used ones before the job interview only to reinforce your knowledge on them. LOOKUP is one of those functions.
A sample answer: “The LOOKUP function in Excel is used for finding exact or partial matches in the processed data. It has VLOOKUP for vertical searches and HLOOKUP for horizontal searches.”
Do you prefer to use Microsoft Excel with a mouse or a keyboard?
This can seem as a tricky question. Because the simple (and the obvious) answer is ‘both of them’. However, it can be important for the interviewer and the financial department in general if someone is hired who is good with keyboard shortcuts. So, keep in mind that keyboard shortcuts save time.
A sample answer: “While it is important to use a combination of the two methods, I prefer mostly keyboard shortcuts and keys. So that I do not have to reach for my mouse and lose time.”
How can you protect your Excel file?
Microsoft Excel has the function to include a password before you open the file. Even though it is low-security protection, it is still possible to block other people to access your password-protected Excel file.
A sample answer about security in Excel can be: “Excel worksheets can be protected with a password from the toolbar above in the Review section.”
What are the data formats used in Microsoft Excel?
There are a total of 11 data formatting tools you can use in Excel. However, giving a couple of examples would be enough, unless the interviewer wants you to list every one of them.
A sample answer: “Excel has a number of data formats; but, my most used ones are numbers, dates, percentages and currencies.”
What is a spreadsheet?
It is a simple question requiring a simple answer. You do not need fancy explanations for this question, a sentence or two should be enough for the interviewer to see that you know what you are talking about.
A sample answer: “Spreadsheet is the essence of programs such as Microsoft Excel. It is a digital ledger sheet.”
What does Excel consist of?
Again, you might be expecting that they want you to count and list every section of Excel. But they only want to know that you understand the key elements of the software you are using and will be using while working there.
A sample answer: “Microsoft Excel’s main elements consist of columns and rows. Also, the small boxes which you put your data in are called cells.”

What is the SUM function?
These Excel questions can range between a general and a simple question to a very specific function or tool’s use. The SUM function, as with the LOOKUP function, is one of those that is used a lot in finance and accounting. It is for the best to get the hang of it before you go to a job interview.
A sample answer: “The SUM function helps to add up the data for each of the rows and columns you choose. It saves a lot of time regardless of the size of the data you are dealing with.”
What is the IF function?
A sample answer: “The IF function gives possible results while checking certain conditions. If the conditions are true or false, then the if statements show results according to those conditions.”
Can you customize the Quick Access Toolbar?
A sample answer: “Excel’s Quick Access Toolbar helps save time and does not waste your attention on finding the useful shortcuts. However, if you want to change these shortcuts to suit your own use, you can.”
How can you wrap a text?
Although you might be used to the automatic wrapping of a text in other Microsoft programs such as Word, in Excel you must wrap the text manually. Just make sure to show them that you know that.
A sample answer: “You can wrap the text by selecting the whole text or only selecting the cell and click the ‘Wrap Text’ button located in the Home tab. You can adjust the size of the cell by moving its vertical and horizontal lines.”
What are the report formats in Excel?
A sample answer: “There are three report formats: Compact, outline and tabular form.”
What happens if you click the button shown with the arrow?
With the outbreak of Covid-19, the amount of in-person job interviews decreased significantly. However, this does not mean you can use a video chat platform such as Zoom, Google Meet or Skype in order to conduct the job interview. So, visual questions such as this one can be asked.
A sample answer for this kind of question can be: “All the cells in the worksheet will be selected.”
What is the purpose of inserting comments? How do you do it?
A sample answer about comments can be: “The purpose of adding comments are clarifying data or information in the cell or leaving additional notes for the people who will be looking at the same worksheet later. Adding comments is done by selecting the cell, right-clicking on it and choosing ‘Insert Comment’.
What is the order in the sequence of mathematical functions?
The order of mathematical functions is important especially for financial analysts working in finance. You can remember the order by memorizing the word ‘BEDMAS’.
A sample answer: “The order of mathematical functions are Brackets, Exponents, Division, Multiplication, Addition and Subtraction.”
Recommended Reading: Most Used Excel Functions
What is conditional formatting?
As with the ‘what is…’ questions, there is no need for a detailed description as if you memorized it. That is only going to hurt your chance of getting the job. Explaining what it is and perhaps giving a simple example will let the interviewer realize you know what you are talking about.
A sample answer for conditional formatting can be: “Conditional formatting helps you to format any cell you want based on their data value. For example, you want all the cells which include a value of 5 to be highlighted and made italic. By using conditional formatting, Excel will do this task for you in seconds.”
What is a formula and what is a function?
Again, do not hesitate to deliver simple yet adequate answers.
A sample answer on the difference between a formula and a function can be: “A function is a built-in tool in Excel which has more than 400 functions. On the other hand, a formula is the creation of the user which instructs the program to do the tasks. A formula has a lot of functions in it, but a function does not have to include a formula in order to operate.”
What do you think is lacking in Microsoft Excel?
The key factor to include here is honesty. It does not matter if they love and only use Excel for their financial endeavors. If you are honest about what you even do not like about the program, they can provide you solutions or other tools to help you with your workflow.
A sample disadvantage of Excel can be: “Microsoft Excel’s biggest disadvantage is the lack of collaboration between a team of employees.”
Recommended Reading: Google Sheets vs. Microsoft Excel: Which is better?
The Purpose of the Excel Questions
No matter how big or how different a business or an institution you apply for, almost all of the financial analyst job positions use Microsoft Excel. It is one of the most crucial tools to consider in the workplace. That is why questions about it are asked and focused on job interviews as well.
Reviewing these potential questions, researching and looking up answers on the topics you think you are lacking are some of the actions you should take before the job interview. The interviewers and recruiters are instructed about hiring people who meet the company’s needs and most importantly their requirements. Because keep in mind, you are the backbone of all the financial decisions that the company makes.
What Do Financial Analysts Use Excel For?
Making Basic Spreadsheets
Every financial analyst or every person who is in the financial sector deals with numbers. Numbers turn into data and data turns into charts and graphs. Anytime in this data processing phase, spreadsheets can be used and are always used. It is an essential tool for a financial analyst in order to gather up, write down and process data.
Custom Formatting – Excel for Financial Analysts
Let’s be honest, even if you are financial analysts, looking at only numbers for the whole day, every day can be a little daunting. That is why Excel’s vast collection of functions and also customizable formatting on everything helps you to colorize and format your processed data. By creating charts and graphs and also, customizing every little detail such as color, size and shape, you will be ready for presentations.
Storing and Navigating Data
Excel functions as the ‘keeper’ of your data. While storing it, it also allows you to smoothly navigate through it regardless of the size of your dataset or database. As it was mentioned above in the previous chapter, some of its functions such as LOOKUP, SUM and IF are the key elements for data navigation in Excel.
Financial Modelling
What does the process of building a financial model consist of?
– Estimating the value of your business and forecasting the possible outcomes of financial decisions
– Comparing other businesses’ net worth and sales prices
– Testing ‘what if’ scenarios
– Planning and budget allocation
What Skills Do You Need to Be A Financial Analyst?
The required skill set for you to be a financial analyst can change based on the company’s needs and requirements. However, every financial analyst should take upon skills ranging from technical accounting to social communication. That means it should consist of a combination of technical skills as well as what it is called soft skills.
Education
But before listing and detailing the needed skills for a financial analyst, let’s look at the education part of it. Because no matter whether you applied for a junior or a senior financial analyst position, almost all of the firms and businesses require you to get a bachelor’s degree in math or math/finance related major.
Also, on top of that, a master’s degree, again in similar fields would be useful for you to get on top of some of the other candidates. However, as it is with almost every field of business, your education does not matter if you cannot show it with the skills you acquired.
Skills for Financial Analysts

Technical Skills
As it is mentioned several times in this blog post, a financial analyst should be familiar with Microsoft Excel. In addition to this, you should be keen on learning new accounting and financial tools and software in order to keep up with the company and the developing world. Learning and getting familiar with programs such as Microsoft Access and SQL will only get you closer to the top.
Accounting Skills
No surprise here, a financial analyst should be an expert in his or her accounting skills. Accounting skills is the basis of the finance sector. Calculating, accounting, managing, planning, strategizing, researching and processing data are its essential processes. Reporting and analyzing balance sheets, tracking the cash flow and creating profit or loss statements are some of the tasks you would be asked for in order to use your accounting skills. A financial analyst who is lacking or is weak at accounting in Excel would not advance very far in their career.
Social Skills
As a financial analyst, you are also a part of a team, department and an organization. Effective communication with other team members, supervisors, managers and your bosses will help you through climbing the ladder of success.
Leadership Skills
You are a team member, yes, but if you want to get promoted and reach to the top, you should show your skills as a leader as well. Do not hesitate to ask for more and harder tasks and to apply for manager or project manager positions. Show your problem-solving and critical-thinking skill in order to take a step forward. However, take these steps and accept these promotions, if and only if, you are certain of yourself that you will accomplish the task.
Analytical Skills
Identifying problems, forecasting potential negative or positive outcomes and setting financial goals can seem that they come with the job. However, it is very hard for a financial analyst to operate these tasks if they do not have the analytical skills to achieve them.
Excel Formulas and Functions You Need to Know as A Financial Analyst
What are the Excel formulas you need to know as a financial analyst?
- LOOKUP (VLOOKUP and HLOOKUP)
- IF (with AND / OR)
- SUM
- INDEX (also used as INDEX MATCH): INDEX is a formula which can be used as an alternative for the LOOKUP. It is designed to return the value of a cell-based on the number of its row and column.
- XNVP: This formula analyzes what a company’s worth is based on cash flow and dates.
- XIRR: Somewhat similar to XNVP, this formula calculates the rate of internal return again based on the cash flow and specific dates for the company.
- CONCATENATE: Although it is one of the most basic formulas in Excel, it is also one of the most useful ones. CONCATENATE combines text, dates, analytical numbers and data in general from different cells into one.
- RANK: This formula is a time saver. It ranks the cells according to their values in descending or ascending order.
- INDIRECT: The INDIRECT formula works exceptionally well when working with large amounts of data. Its function is to summarize text or data cells into a cell reference. This reference can be referred to in the same worksheet or even in different Excel files with different worksheets.
Someka provide’s a very useful tool to practice your Excel skills before the interview: Excel Formulas Trainer. This tool will help you practice the Excel formulas with an interactive dashboard.

Excel Templates for Financial Analysts
Break-Even Analysis Template
Someka’s Break Even Analysis Template is designed in order to plan and program your revenue and cost assumptions. Every new start-up has to calculate its investment and the sales it will get in return. The Financial Statements and Line Graph, Cost Distribution Chart and a Bar Chart will let you illustrate your forecasts visually.
Also, it comes with the customization ability as well in order to make your every chart and graph ready for your presentations. And the most important advantage you would get by downloading this template, it is free!

– This Dashboard is from Someka’s Break Even Analysis Template in Excel. –
Balance Sheet Template
Someka offers a free Balance Sheet Template for you. You can create professionally designed yet easy to use financial balance sheets for your company. This template will let you realize finance trends, find problems in your accounts and forecast future financial decisions much easier. It also allows you to create a number of different charts for the financial ratios. It will process the data you enter regarding assets, liabilities and equity. Then it will create a professionally designed chart for you to print or for you to show at presentations. And as with each of the Someka templates mentioned, it is compatible with both Mac and Windows devices.
Profit and Loss Statement Template
This profit and loss dashboard is carefully designed to show the company’s annual revenue and loss statements. It also includes a detailed spreadsheet or a chart to show the total spending of the company. If you are using different templates also for your financial statement or your income statement, this template also has both of them built in it! Someka’s comprehensive Excel template is completely free and ready for you to use!

– This Dashboard is from Someka’s P&L Statement Template in Excel –
Cash Flow Statement Template
Someka’s free Cash Flow Statement Excel template helps you to create cashflow statement based on accurate insight of your current and future profitability. It calculates and records every cash transaction and can provide you detailed charts and graphs based on that data. If you want to track and store the company’s cash flow, this is the template for you!
Financial Analysis Excel Templates
Beside the financial statement templates mentioned above, Someka portfolio also includes many effective financial analysis templates.
You can use Discounted Cash Flow Excel Template to evaluate investments in DCF model. Another important tool for investment valuation is LBO Model Excel Template. Actually, you can use this tool to prepare for financial analyst interviews. Because, LBO model is one of the most common questions in the interviews of financial positions.
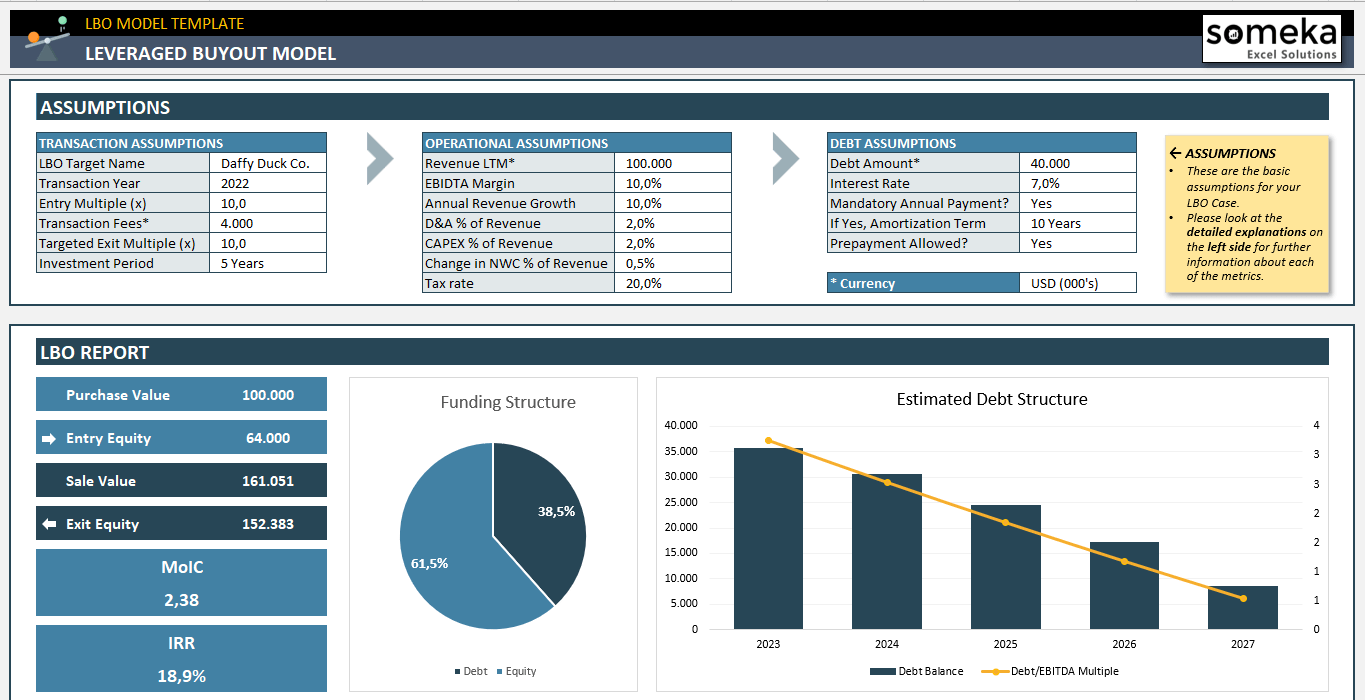
– This is a screenshot from Someka’s LBO Model Template –
Another important tool to evaluate cashflows and feasibility is NPV and IRR Calculator Excel Template. This tool is also very helpful to make practices on IRR and NPV calculations.
Excel for Financial Analysts Summary:
This post reveals some of the most common questions in financial analyst interviews with the most simple and relevant answers. You’ll also find some very effective tools to make practices on your financial knowledge.
These tools will also provide you professional-looking reporting and dashboard options.
Recommended Readings:
Complete List of Things You Can Do With Excel
Related Posts


