UML Diagram Types Guide: Learn More about Tools, Examples!
Contents
- What is a UML diagram?
- Types of UML Diagrams
- Behavioral Diagrams
- Structural Diagrams
- Benefits of Using UML Diagrams
- UML Diagram Examples
- How to Create UML Diagram in Excel?
UML diagrams are widely used in order to visualize the way any system works and data flows in a structure. In this article, you will be introduced to different types of UML diagrams and why they are crucial for visualizing systems.
You will also learn about the easiest way to form UML diagrams using Excel.
What is a UML diagram?
UML stands for Unified Modeling Language which is a visual language to illustrate the design of a system in software engineering.

In brief, UML diagrams show the shapes that represent objects, people, and the mutual relationship between them in software.

Types of UML Diagrams
There are 14 types of UML diagrams that are grouped under two titles as behavioral diagrams and structure diagrams.
Structure diagrams show the way a system is structured and the relationship between its elements while behavioral diagrams show the way elements interact with each other in order to make the system functioning.

Recommended Reading: 7 Types of Organizational Chart Structures
Behavioral Diagrams:
1) Class Diagram
Class diagrams are the most popular UML diagrams. They are created to show the classes in a system and their relationships.
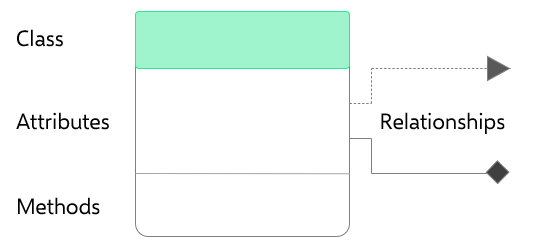
In a class diagram example, every class is represented by a rectangle which is separated into 3 parts that show the class’s name, attributes, and behavior.
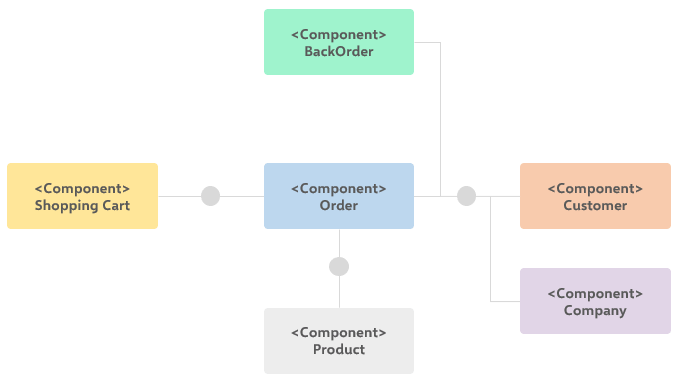
2) Component Diagram
Component diagrams are used in order to break complex systems into their components in order to have a simplified visual representation of a system.
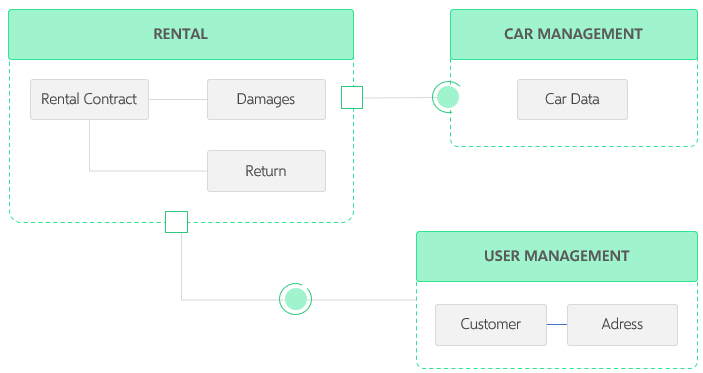
3) Package Diagram
Package diagrams show the relationship between different packages in a system. A file folder symbol is used to represent a package and a package may contain different components, groups, or even other packages.
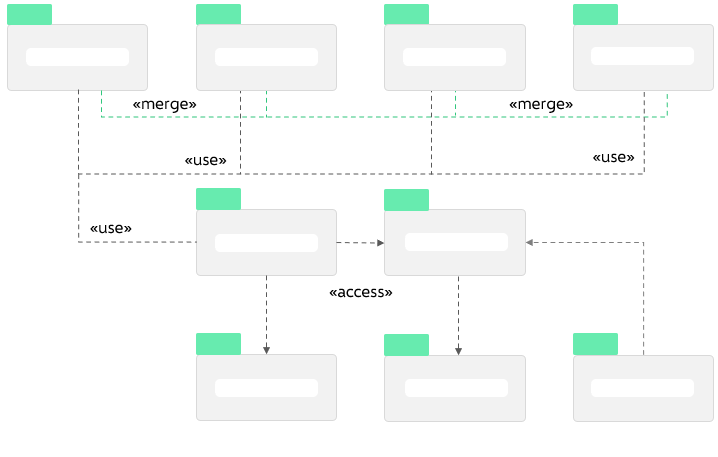
Package diagrams, therefore, show the complex systems that are made up of large components.
4) Object Diagram
Objects diagrams are built in order to check if a diagram functions in the right way.
For instance, you can form a test case using an object diagram to see if a class diagram is viable and complete.
5) Composite Structure Diagram
Composite structure diagrams are rarely used since its function is very specific.
They show the internal structure of classes and the interaction between the components of classes.
6) Deployment Diagram
Deployment diagrams show physical resources in a system.

They depict the relationship between software components and hardware components and the way artifacts are deployed on the nodes.
7) Profile Diagram
A profile diagram is a model that is recently introduced. Rather than other diagram types, it used as a language that allows extending other UML notations.
Structural Diagrams:
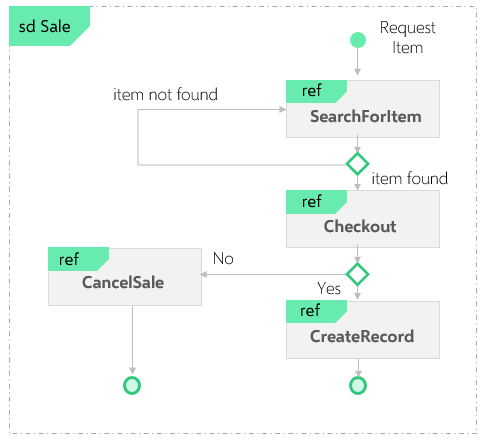
1) Sequence Diagram
A sequence diagram, also known as an event diagram, shows the sequence of messages and order of the interaction between objects in the case of a particular scenario.

The processes are represented chronologically on a vertical line and the interactions are shown with arrow symbols.
2) Timing Diagram
Timing diagrams resemble sequence diagrams. They also show the interaction between objects or the process of a single object in the given time. However, the main point of the diagram is to show the way objects act in a given time frame.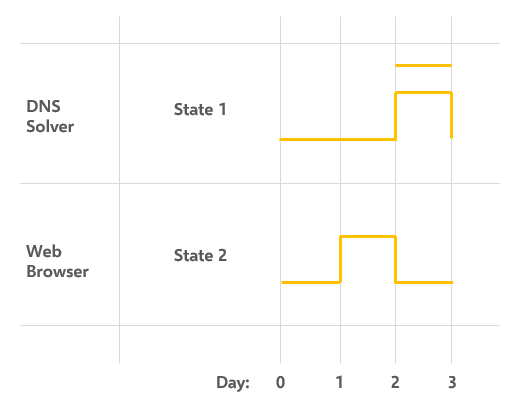
Contrary to sequence diagrams, the time passing is shown from left to right and it shows how much time each process takes.
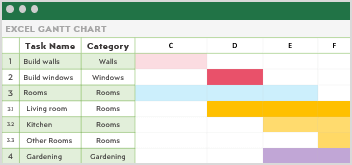
 Gantt charts are also one of the most famous frameworks for visualizing project timing.
Let's check what can you do with this Gantt Chart Maker in Excel!
Gantt charts are also one of the most famous frameworks for visualizing project timing.
Let's check what can you do with this Gantt Chart Maker in Excel!
3) Interaction Overview Diagram
Interaction overview diagrams are like activity diagrams. The same notation that is used in an activity diagram is used.
However, the diagram does not show the sequence of a process but the sequence of different interaction diagrams in the order they happen.
4) Activity Diagram
Activity diagrams are crucial for business process modelling since they represent the activities that take place in a system and to depict the workflow between the components of a system.
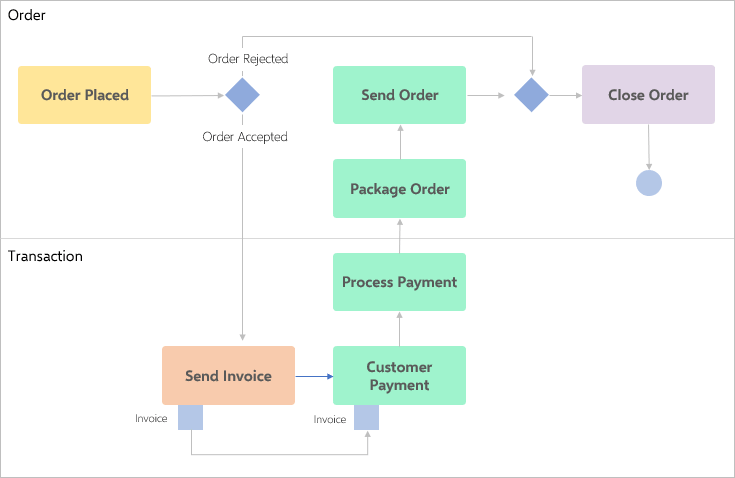
The activity means the operation in a class of the system that affects the whole system and the activity diagrams show the flow of control between these activities.
Click to create your own Activity Diagram in Excel!
5) Use Case Diagram
Use case diagrams are used to model the actors in a system, the way these actors function, and the interaction between actions. Actors are shown as stick figures and they can represent a human or an organization.
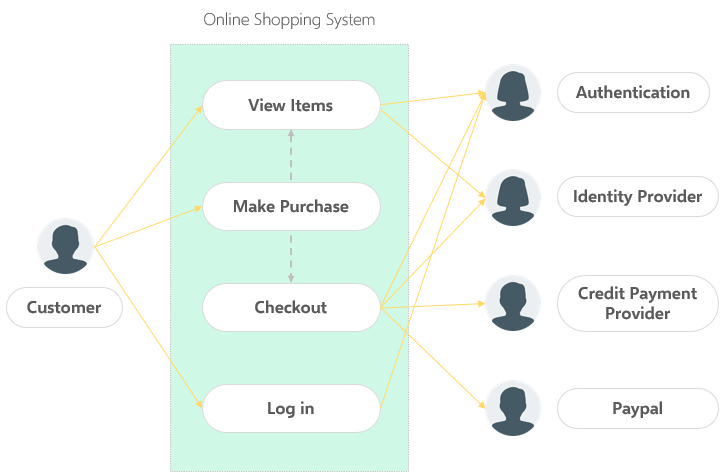
Functions are shown as verbs that represent actions and the relationship between the actors and functions is shown by straight arrows.
6) State Diagram
It is also known as state machine and state chart diagrams to display transitions. They are used to depict the systems that contain an object that behaves reactively to external stimuli and the state it is in.
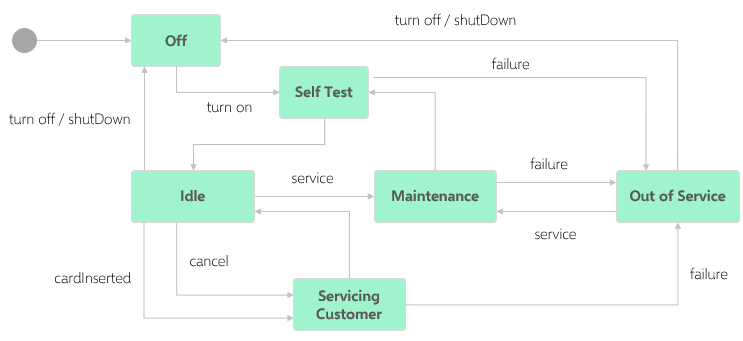
A state diagram gives information about the possible states of an object and its transition from one to another.
Recommended Reading: How to Write Standard Operating Procedures
7) Communication Diagram
Communication diagrams, also known as collaboration diagrams, are used to show the message flow between the objects and the way objects communicate with each other. They resemble sequence diagrams.

However, association connections are used in communication diagrams and while sequence diagrams are built vertically, communication diagrams are built with number schemes.
Benefits of Using UML Diagrams
- UML is a unified and universal language used by engineers from all around the world, so it ensures readability and intelligibility for any target group.
- Visual representations offer the easiest way to explain the working principle of a system completely.
- Visualizing systems helps to develop them.
- Making a model of a functioning system makes it easier to detect and prevent errors.
- Using diagrams to explain the structure of the system, processes, and interactions will help the collaborators be in rapport.
- UML diagrams support a wide range of applications.
- It shows both structural and behavioral aspects of a system.
UML Diagrams Examples:
Uml-Diagrams: The diagram below is an activity diagram, which shows the process chronologically from the top to the bottom. It is made to visualize the way a ticket vending machine works.
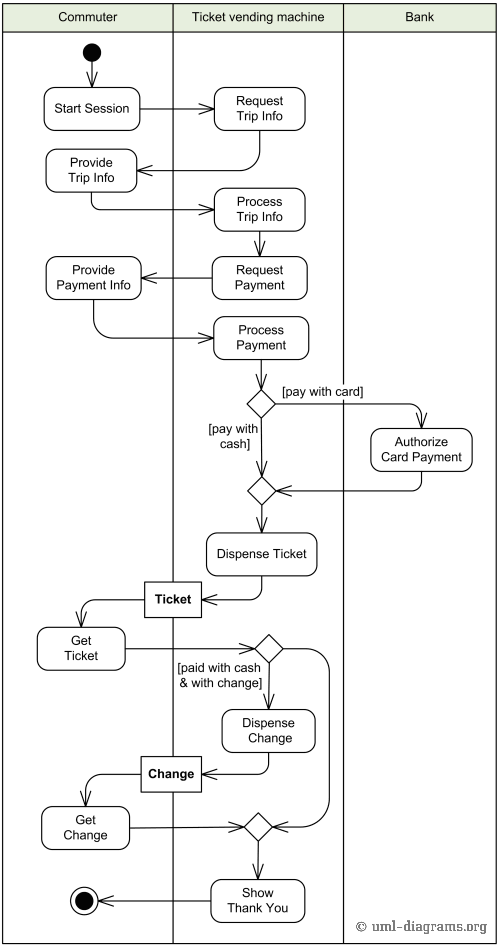
Firstly, the actor presses the button in order to start the process. Then, the machine requests the trip info. When the actor provides it, the machine requests payment according to the actor’s selection.
The actor provides the information for payment. If it is paid by cash, the machine directly dispenses the ticket and the change and shows thank you.
If it is going to be paid by credit card, the machine sends the information to the bank and the bank authorizes, then the machine dispenses the ticket and shows thank you.
The diagram below is a timing diagram. It is made to visualize the stages of Alzheimer’s disease in relation to time passing.
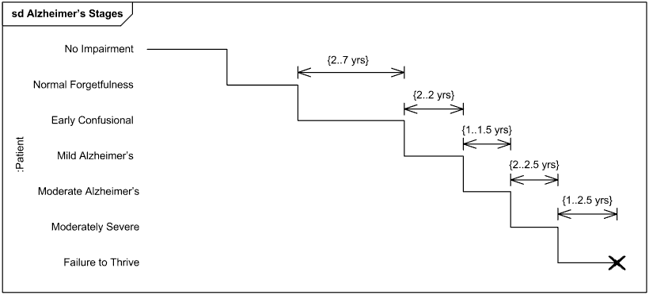
The processes are shown chronologically from left to right. By analyzing the diagram, it is possible to see each stage of Alzheimer’s and how long it proceeds.
Educba: The diagram below is a simple class diagram to show the relationship between different animals. In such a diagram, every rectangle represents a class.
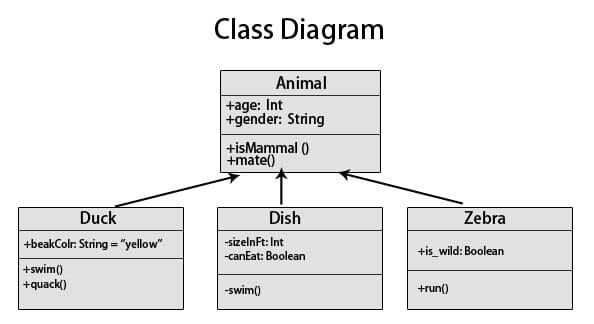
Every rectangle consists of 3 main parts while the top part represents the class’s name, the middle part represents its attributes and the bottom, its behavior.
In this example, three animals; duck, fish and zebra are shown with their attributes, and behaviors. They are linked to animal class with arrows that represent inheritance.
How to Create a UML Diagram in Excel?
The easiest way to create a UML diagram is offered by Excel. Excel is a tool that is widely used, which eliminates the learning process of another tool. The tool only requires basic computer using abilities.
Excel could be run on any computer while some software solutions are not supported by Mac computers.
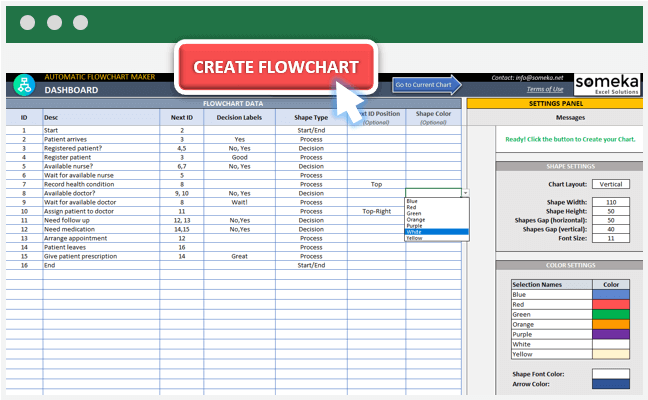
You can create a diagram using our Automatic Flowchart Maker in Excel effortlessly!
Most of the flowchart tools work by drag and drop principle which takes so much time and they are costly while Excel is highly affordable.
The only required process is keying in the data and pressing the button. You will not lose time with any redundant process. It is also quite possible to update the data and form a new diagram whenever you need to.
Once your diagram is ready, you can customize every feature of the aspect of your chart using the settings panel and view the changes immediately. You can determine the height and width of the shapes; determine the font sizes and you can change the colors.
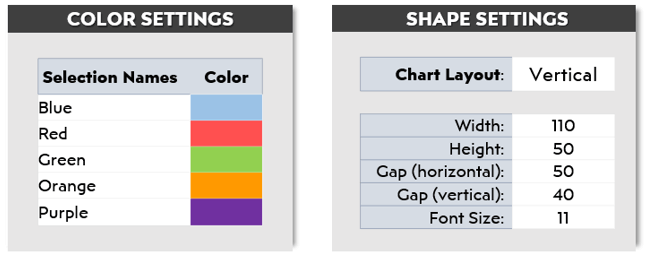
This innovative Excel tool provides flexibility to determine the layout of the diagram as vertical or horizontal. You can immediately import your diagram to a pdf file and save it on your computer and use it on any digital platform seamlessly.
FINAL WORDS:
We tried to compile everything you need to know about UML Diagram types and give you a starting point about it. UML Diagrams may be very beneficial to improve your business process by giving clear documentation.
If you would like to learn more about business processes, workflow management, you can also check How to Write Standard Operating Procedures and Flowchart Tutorial to create digital documentation for your company.
Related Posts