
How to Create a Treemap in Excel?
Do you need to display hierarchical relations, but you don’t know how? Find out how to create a treemap in Excel with this article! Table of Contents:
- What is a Treemap and when to use it?
- Pros and Cons of Treemaps
- What is the difference between a Treemap and a Decision Tree?
- What is the difference between a Treemap and a Heat Map?
- How to Create a Treemap: Methods?
What is a Treemap and When to Use it?
A treemap visualizes the hierarchical structure of anything with multiple items or articles with the use of rectangular boxes. Eminence in the hierarchy is marked by a larger rectangular size, and the categories are specified by color. If you want to demonstrate patterns and relations between data concisely and easily, a treemap might be ideal for you. Although don’t forget that treemaps only differentiate two variables meaningfully.

You can use a treemap to reflect the distinction between the proportions of branches in a website or to illustrate the dominant crops that are planted on a farm.
Pros and Cons of Treemaps

It is important to determine which type of display you will use when it comes to visualization. Any visual representation brings its own advantages and disadvantages according to your data and aim.
Pros:
- A treemap displays similarities and relations between the data in an uncomplicated way. That would provide the viewer with easy-to-recognize patterns.
- Because it offers a simple representation, treemap is very convenient for working with larger data sets.
- A treemap is useful for two-tiered data sets. It shows the hierarchy between categories, while also showing the hierarchy between sub-categories within the main categories.
- As a result of the two-tiered structure, create your treemap chart in Excel to expose anomalies in the data.
Cons:
- While treemaps are concise, they are not precise. As a consequence of large scales and simple representation, treemaps don’t offer exact scales and comparisons.
- If you have too many categories, some rectangular boxes may stay too small to display the name and other info.
- If you need to work with more than two variables, treemaps wouldn’t be ideal for you.
What is the difference between a Treemap and a Decision Tree?

These two charts are confused with each other due to their similar names. However, they are quite dissimilar, unlike their names! A decision tree is used as a guide to making decisions regarding possible outcomes, aims, costs, and alternatives. It is basically a flowchart for a particular use.
A treemap, as it is mentioned above, doesn’t have any utility for decision-making. It is about hierarchies and scales. They also don’t look alike. While decision trees have visual links between the nodes and branches, treemaps contain only rectangular-shaped boxes.

What is the difference between a Treemap and a Heat Map?

Both a heat map and a treemap uses size and color to display data, but they have distinct purposes and characteristics.
Firstly, heat maps compare categories and the corresponding data. It doesn’t reflect the hierarchy as a treemap does. However, one advantage is that you can set a heat map on a regional map as a base and illustrate the regional differences. A heat map doesn’t have to use a geographical base, it can only contain rows and columns to represent the data. The visual of a treemap is typical as you can read above. Another difference might be the fact that treemaps cannot represent negative values.

How to Create a Treemap: Methods?
We are going to show you how to create treemaps in Excel in this article. So, you can select the ideal method for you and start to create your treemap easily. We’re proposing three types of treemap methods below:
- Method 1: Inserting a Treemap Chart
- Method 2: Using SmartArt
- Method 3: Use Professional Excel Template
Method 1: Inserting a Treemap Chart in Excel
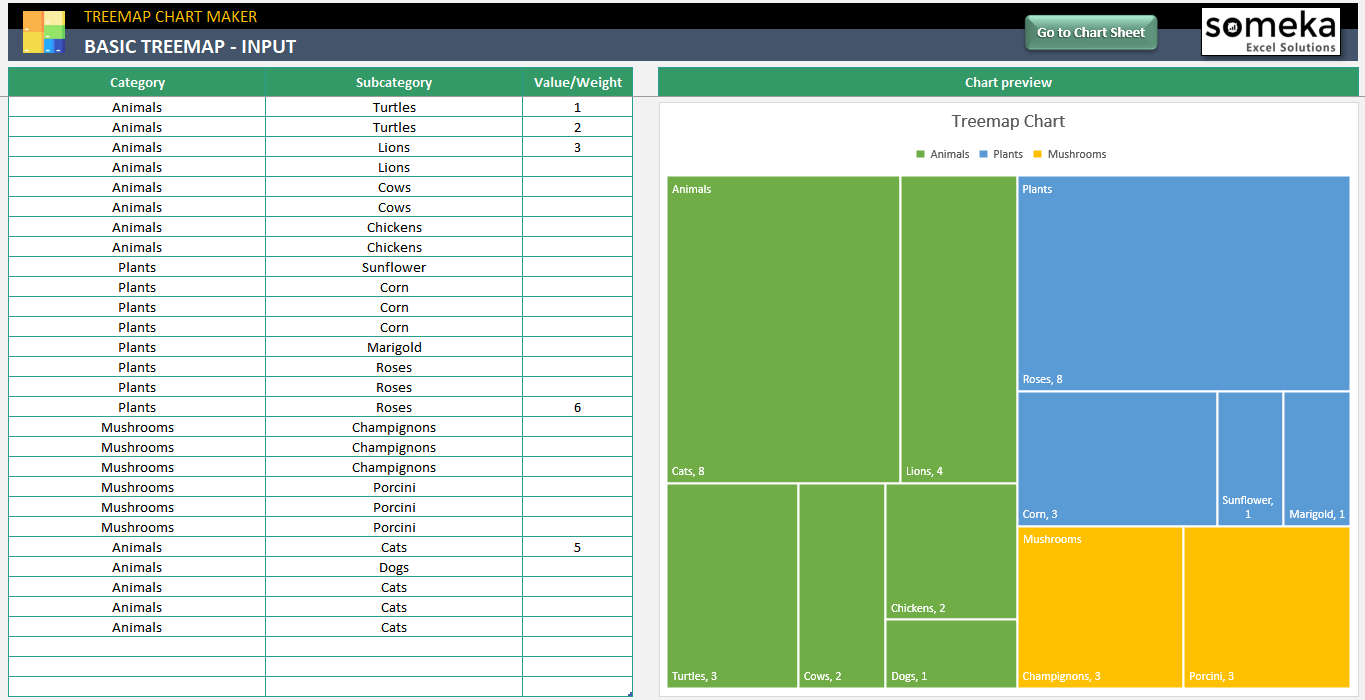
One of the easiest ways to create a treemap in Excel is using the treemap chart feature of Excel. First, enter your necessary data as a table.
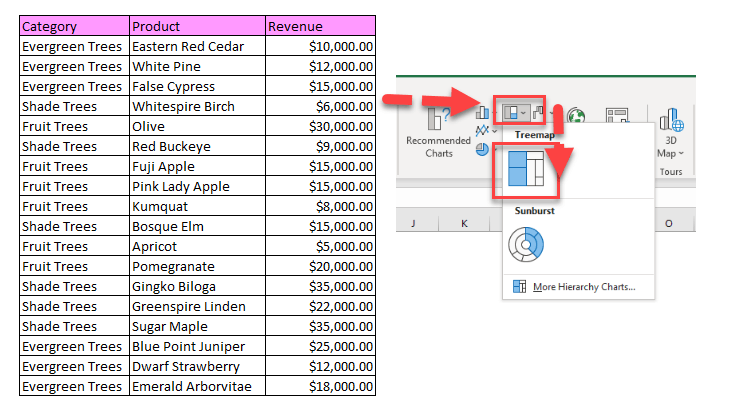
Then, click on the table and to reformat it as a treemap chart, go to the Charts sections of the Insert tab and select the “Insert Hierarchy Tab” button. On the drop-down menu, you will see the treemap option.
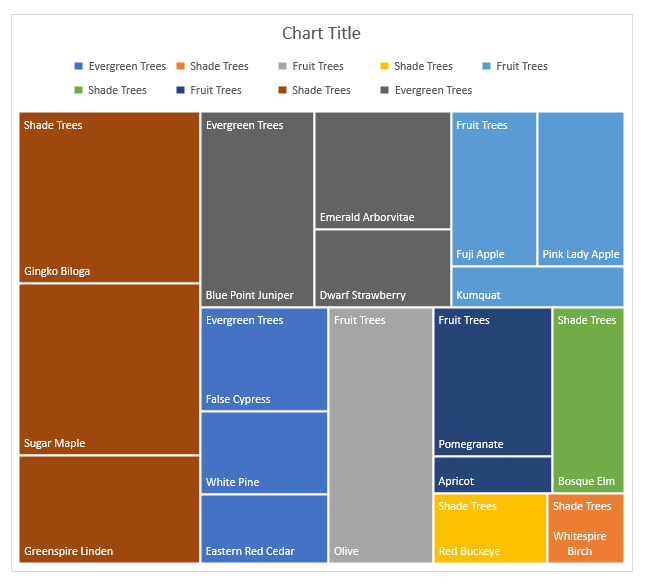
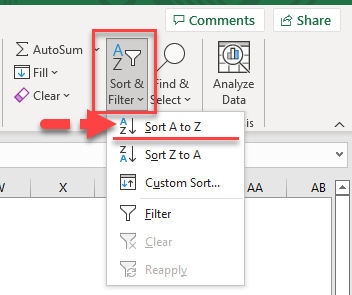
A treemap chart will appear on the sheet. However, the categories will seem messy because the table shown before was not sorted alphabetically. Therefore, there are categories with different colors and places yet under the same name. To change it, click on the category/branch column on your table, go to the Sort & Filter button on the Home tab, and select “Sort A to Z” under the menu.
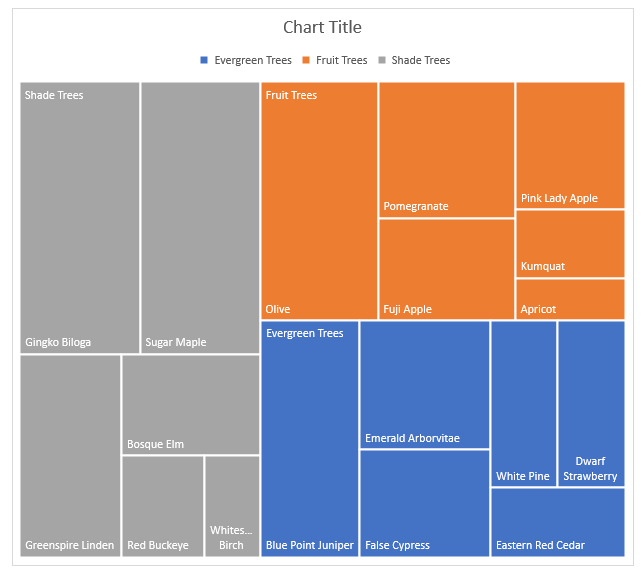
Finally, your treemap is ready-to-use. The categories will be organized. Although, don’ forget this is a basic treemap and you can still add labels and format other features of it. Next, you can learn how to customize and format your treemap.
How to customize and format your Treemap Chart?
You can format your treemap chart and customize it for your own taste and needs.
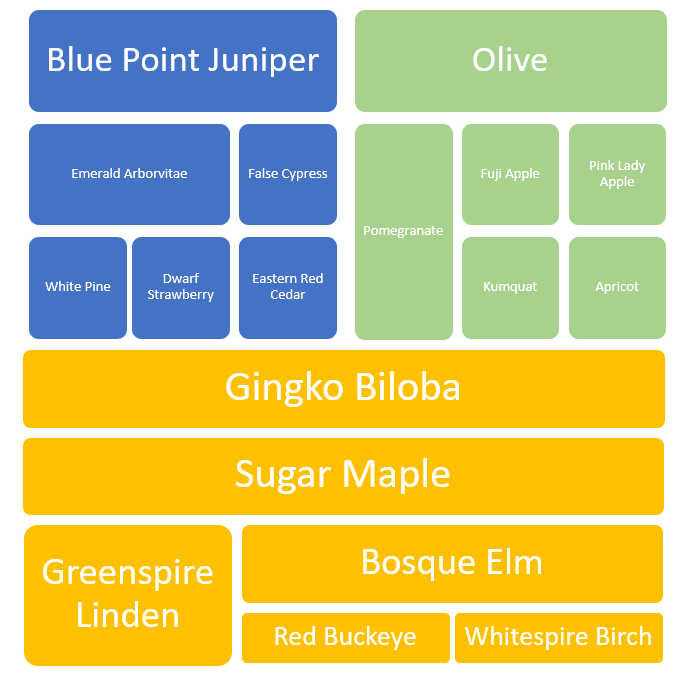
For example, you might want to add ribbons that show the categories such as below:
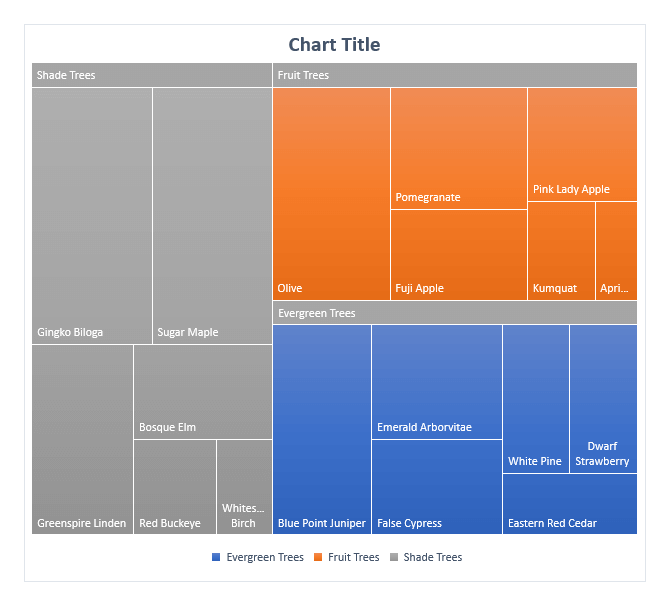
Then, all you need to do is to go to the Chart Design tab on the Excel ribbon and select Style 4 on the Chart Styles menu!
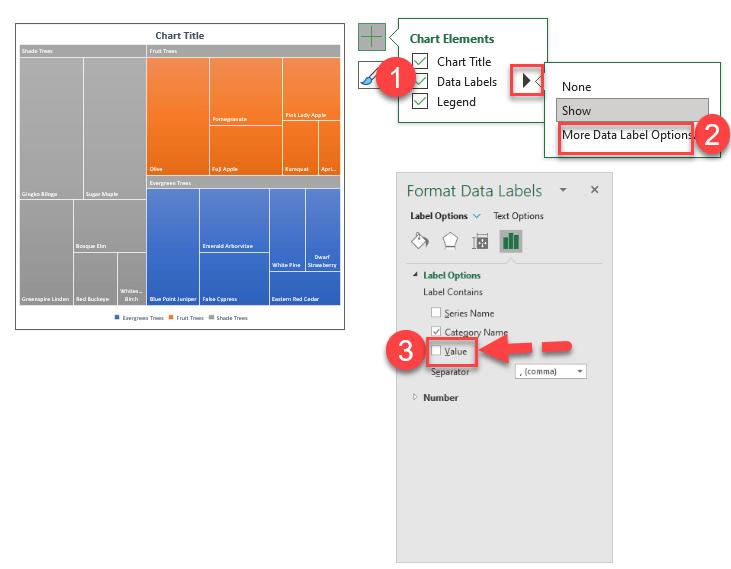
If you want to show the values of your sub-categories of the treemap, you must click on the plus sign on the side of the chart, choose Data Labels on the menu, and click on the Value option on the opening window. Values of the sub-categories will appear on the chart.
As you can see, there are several changes you can create your treemap chart in Excel. These are basic design and format changes, but one of the questions that people ask is how to add more variables to show in the label. If you want to learn the easiest way to do it, you should definitely read the next chapter!
Method 2: Using SmartArt to create a Treemap Chart in Excel
When it comes to Excel, there are many unique ways to create whatever you would like to. Whether it is a flowchart or a calendar, you can achieve making it thanks to Microsoft Excel’s multi-instrumental structure. This is also applicable for treemaps, too. That’s why we’re going to show you how to use SmartArt to create a treemap in Excel.
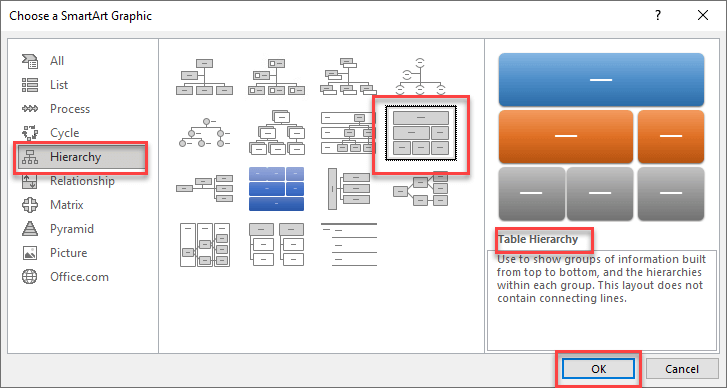
Firstly, go to the Insert tab and select SmartArt. On the window, which has been opened, choose Table Hierarchy under the Hierarchy category.
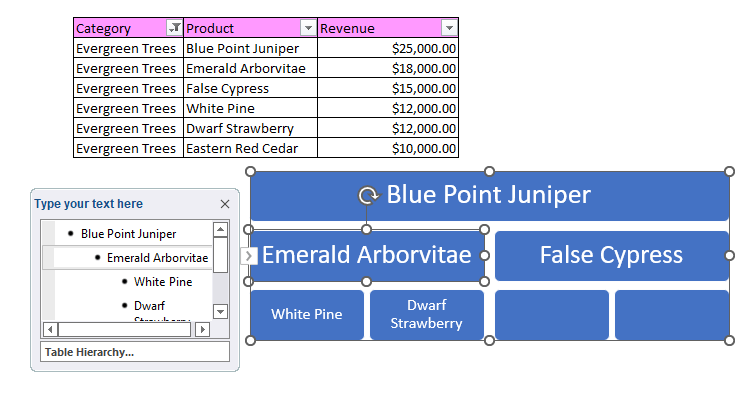
Then, start to add your data to the SmartArt table by hand. Use bigger boxes in the graphic to represent the hierarchically dominant sub-categories. You must approximate the relative size of the boxes by comparing their corresponding values to the others.
You can make every category separately by adding another SmartArt graphic after completing the last one. That will make adjusting the boxes rather easier than adding all of them on the same SmartArt graphic.
After completing all the categories, select a different color for each one of them. To do that, select all the boxes, which you want to color, right-click on them, and choose Format Shape under the menu. You can change the color of the shapes on the side window that will be opened. Your treemap chart will be ready after this.
As you can see, this is not an automated way to make a treemap. It requires too much effort and adjustment to make one small-sized chart and making one for a larger data set would be more complicated. Fortunately, there is a much more convenient way to create a treemap in Excel.
Method 3: Use Professional Excel Template
Creating a treemap in Excel is relatively easy, but as we stated earlier, treemaps are especially great to illustrate a greater data set, however sometimes the data set might be too large to handle. Customizing and formatting the treemap chart might also be a headache from time to time. To spend less time and effort, you can go for a ready-to-use Excel template!
Someka Treemap Chart Maker will help you create a treemap as quickly and smoothly as possible. In Treemap Chart Maker Template, you will find two different tools to create a treemap. The first is the Basic Treemap, which doesn’t contain many layers of sub-categories. The Advance Treemap option, on the other hand, allows you to add up to 5 sub-categories.
In the end, it is still Microsoft Excel, and you will not need to install anything extra. On top of that, the time you spend will decrease significantly.
Do not forget to watch the instructional video to learn more about the template.
You can also watch our tutorial video to learn how to create a treemap in Excel.

Consequently, we have tried to explain how to create a treemap in Excel step by step with different methods. If you have something to add or if you find any errors, please contact us.
Recommended Readings:
Related Posts


