
How to Create a Flowchart in Excel?
Do you have difficulties to creating a flowchart? Do you need guidance to start? Then this post will focus on how to create a flowchart in Excel with step-by-step instructions. Flowcharts are the visual summary of processes, displaying each step in sequential order. And Microsoft Excel provides different ways to create flow diagrams for various needs.
Different Methods
- Create Flowchart with Shapes in Excel
- Using SmartArt Graphics
- Create Flowchart with Visio Data Visualizer Add-in
- Ready-to-use Excel Templates
4 Different Methods to Build Flowchart in Excel
A flowchart is a diagram representing the sequences of a process in a step-by-step approach. We can summarize flowcharts as diagrammatic representations of a process with predefined shapes and symbols.
From engineers to analysts, many people use flowcharts for various purposes, such as documentation, system flows, algorithms, business processing maps, and many more.
Before explaining how to create a flowchart, let’s see some of the common shapes and symbols used for these charts. Using standard symbols will let people easily understand the meaning of your flowchart.
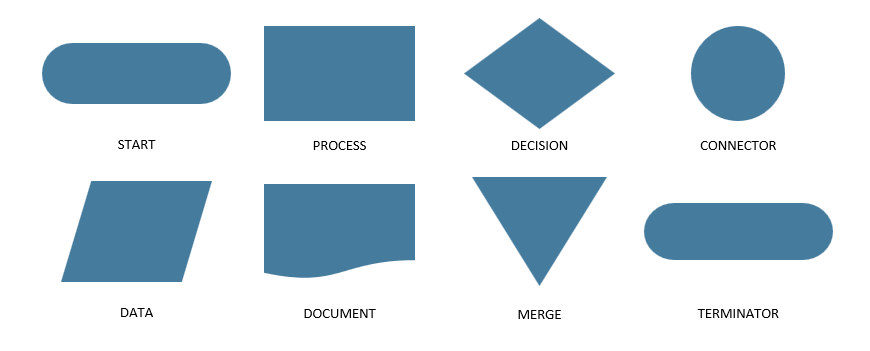
There’re many other shapes used in flowcharts. These are only the very common ones, that most people recognize.
You may build lots of different flowcharts with a different number of shapes, layouts etc. But most of them consist of the same elements, such as standardization, documentation, communication, and analiysis.
Recommended Reading: Flowchart Tutorial: Common Questions, Types, Tools and Tips!
Microsoft Excel lets you create flow diagrams in different methods.
In this section we’ll explain how to make a flowchart with:
- Shapes
- SmartArt
- Add-Ins
- Excel templates
Method 1. Create Flowchart with Shapes in Excel
This first method will help you to create a flowchart from scratch. So opening a brand new blank Excel file is enough to start your flowchart diagram.
Shapes are are individual objects in Excel, that can be edited independently. Therefore, the shape-based flowcharts are really easy to edit. One of the reasons to prefer Excel rather than Microsoft Word is also easier shape formatting in Excel.
Let’s see how to make a flowchart with shapes step-by-step.
Step 1: Adding Shapes
First of all, you will start building your flow diagram by adding shapes.
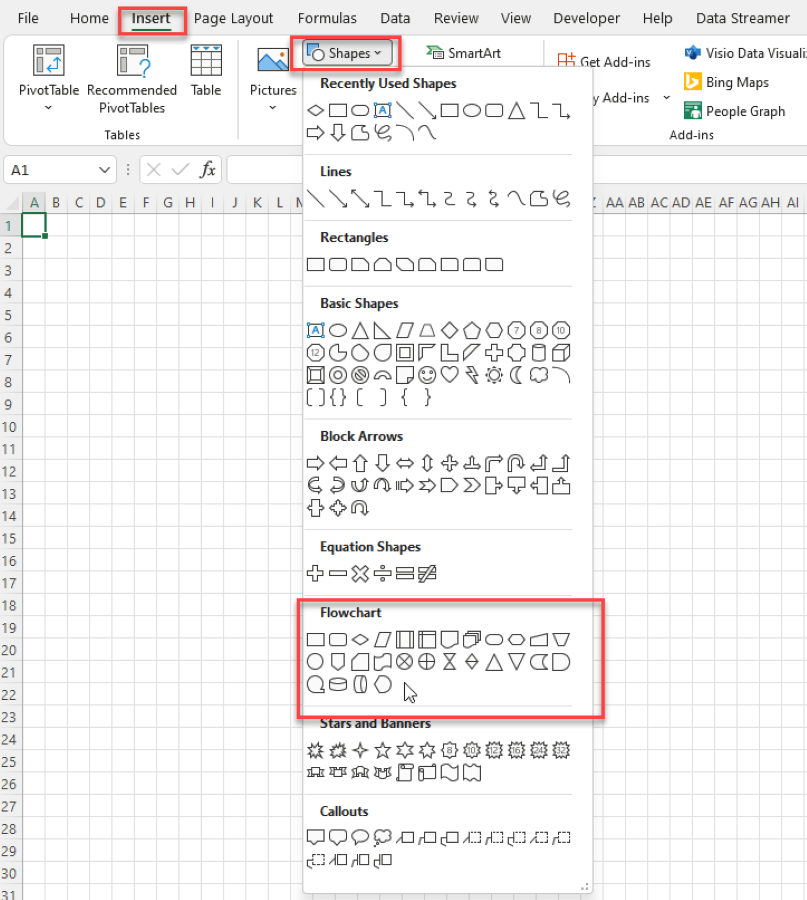
Please find the shapes gallery in the Illustrations group under the Insert tab. You’ll see a Flowchart shapes group under this gallery. Select the shapes according to your flow.
Step 2: Adding Connector Lines
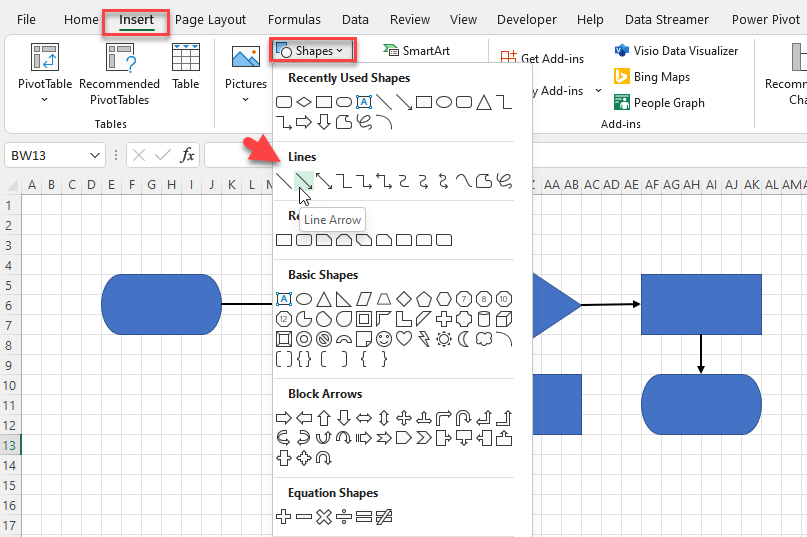
You can add arrows also under the Shapes Gallery. Just select Line Arrows to connect your shapes.
Step 3: Adding Texts
Now it’s time to add texts to your shapes to create our flowchart. Double click on the shapes and start to write your texts.
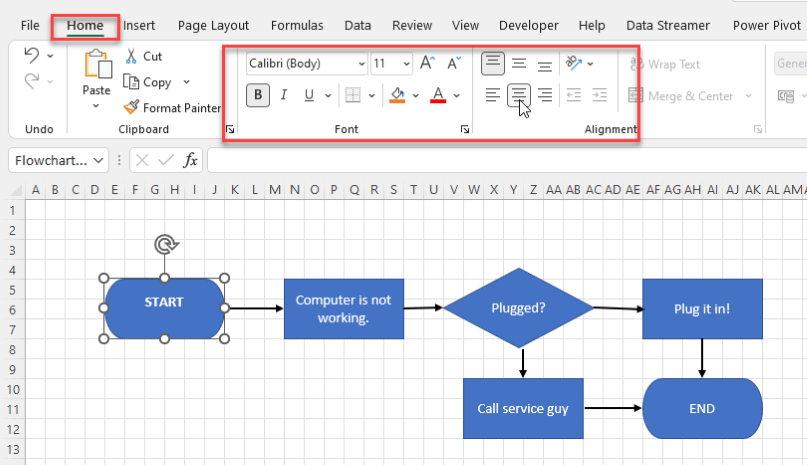
Please remember you can customize your texts with options under the Home menu.
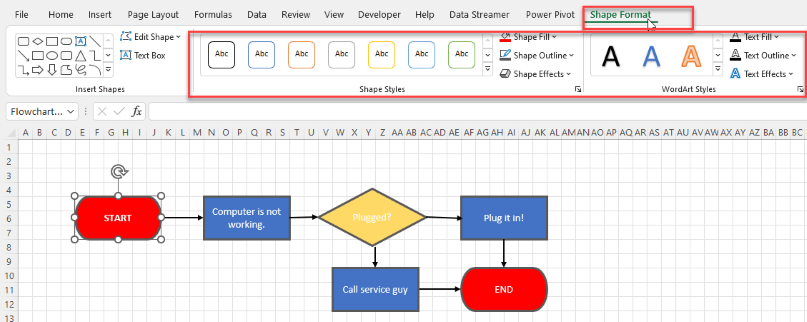
Step 4: Customizing the Shapes
One of the most important advantages of creating shape-based flowcharts in Excel is that each shape is modifiable independently. So feel free to select each shape and customize the colors, size, and fonts.
Step 5: Adding callout boxes
You can easily add callout or text boxes for your additional notes.
You will find callout boxes under Insert> Shapes > Callouts.
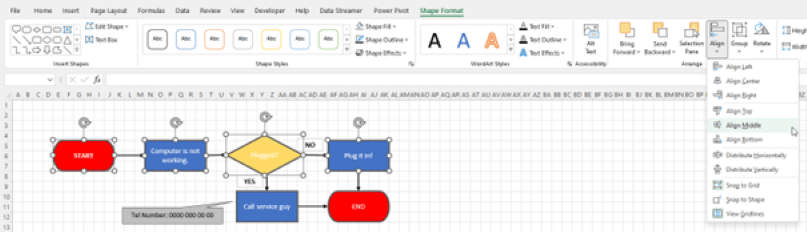
Step 6: Aligning the shapes
The last step is about aligning all your shapes.
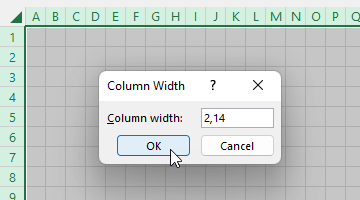
Before that, you can also hide gridlines to have a cleaner look. Go to the View tab and uncheck the gridlines option to stop displaying them.
Then select the targeted shapes, and go to Shape Format > Align.
In addition, you may align your shapes in the center or in the middle, or you can distribute them vertically/horizontally. This is totally up to your choice.
Method 2. Using SmartArt Graphics
Microsoft Office has pre-made groups of shapes for various needs, which are called SmartArt. In the SmartArt gallery of Excel, there are also options for flow chart diagrams.
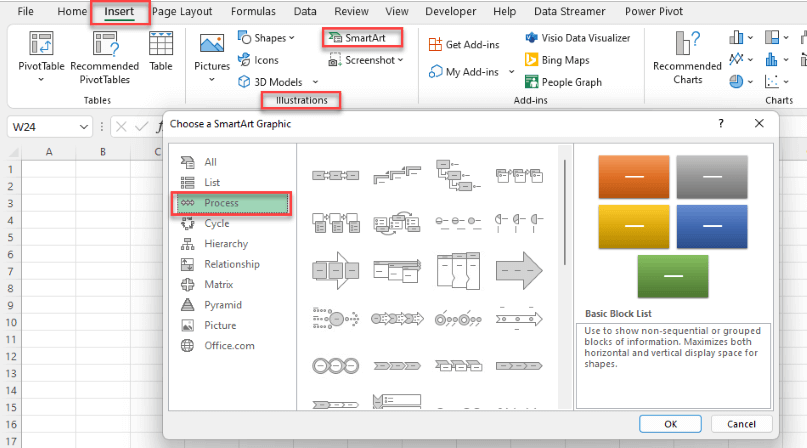
To start creating a flowchart in Excel, please open SmartArt Graphic Gallery under Insert > Illustrations > SmartArt section.
Now you can choose an option under the Process group on the left pane. In summary, these are ready-to-use process types suitable for flow charts:
Once you add a SmartArt diagram, you can easily add new shapes.
You can customize your flowchart under the SmartArt Design tab.
Method 3. Create Flowchart with Visio Data Visualizer Add-in
Add-ins are extensions that add further options or additional features to Microsoft Excel. You can increase your Excel abilities with lots of add-ins. But please be sure that you get your add-ins from trusted sources.
That’s to say, for structural diagrams like flowcharts or org charts, you can use Visio Data Visualizer Add-in.
Let us explain how to create a flowchart by this Excel add-in step by step:
Step 1: Getting the Add-Inn
You should first get the Visio Data Visualizer Add-in to use this tool.
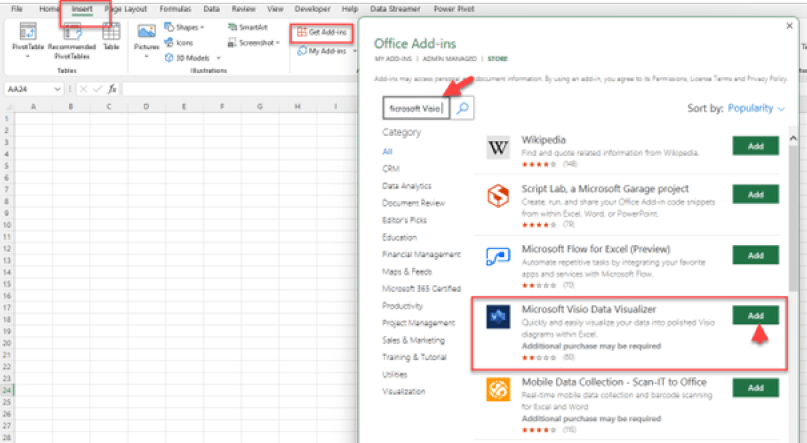
Firstly go to the Insert tab, and under the Add-ins Group, select the Get Add-Ins option.
As a result there’ll open an Office Add-Ins Window. Look for Microsoft Visio Data Visualizer under the Store Tab.
Once you’ve done with the signing-in process, the Add-In will be added into your worksheet.
Step 2: Adding flowchart diagram
Now go to Insert > Add-ins > Visio Data Visualizer and select the best layout for your flowchart.
Step 3: Data Input
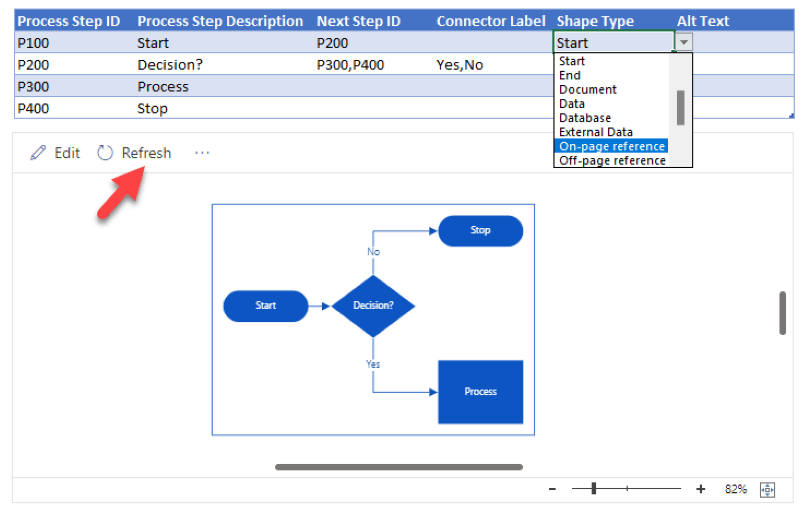
When you choose a flowchart layout, the Visio will open a table for you to input your data.
To clarify, the table consists of Process Step ID’s, step descriptions, next step ID, connector label option, and lastly the shape type. You can also add Alt-Text to your steps to create your Excel flowchart.
Step 4: Refreshing the Flowchart
After filling out your table, you need to click on the Refresh button to see your changes on the flow chart diagram. Now it’s all ready.
Above all, please note that editing your chart may need a Visio license, which is a separate purchase from Microsoft 365.
Method 4. Ready-to-use Excel Templates
Excel has a pre-designed template collection, that also includes ready flowchart templates. If you want to use a ready template from Microsoft office, you can navigate to Microsoft’s official website for templates and search flowchart here.
Certainly you can work on these templates by editing the elements.
Someka also provides a ready-to-use Automatic Flowchart Maker. If you don’t want to spend time designing, changing, or editing your flowchart diagrams, this tool will let you get what you want in seconds.
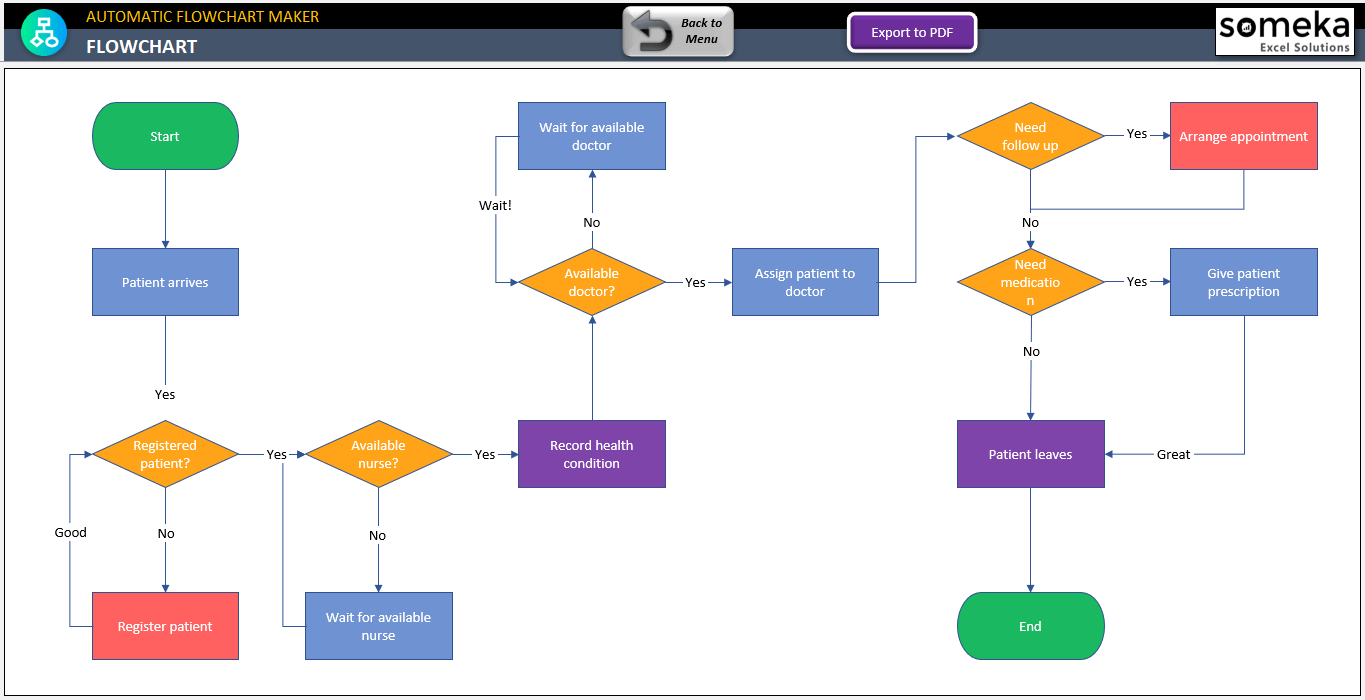
The template includes an input table, which you can update at any step of the process. The whole template is customizable with flexible shapes, colors, types, and decision label. If you’re looking for a drag-and-drop tool, you can also edit the chart.
The most important part is it’s all in Excel, you do not need to download any software. Now you can download a free version and give it a try. Do not forget to watch the instructional video to learn more about the template.
Finally, please remember that flowcharts are made for illustrating complex processes simply and visually. So try to be clear as much as possible, and do not overdesign your diagram. Using standard and common shapes will also help to create an understandable flowchart maker.

Consequently, we have tried to explain how to create an org chart in Excel step by step with different methods. If you have something to add or if you find any errors, please contact us.
Also, don’t forget to check our Excel Templates Collection. There might be a very useful tool for you:
Related Posts


