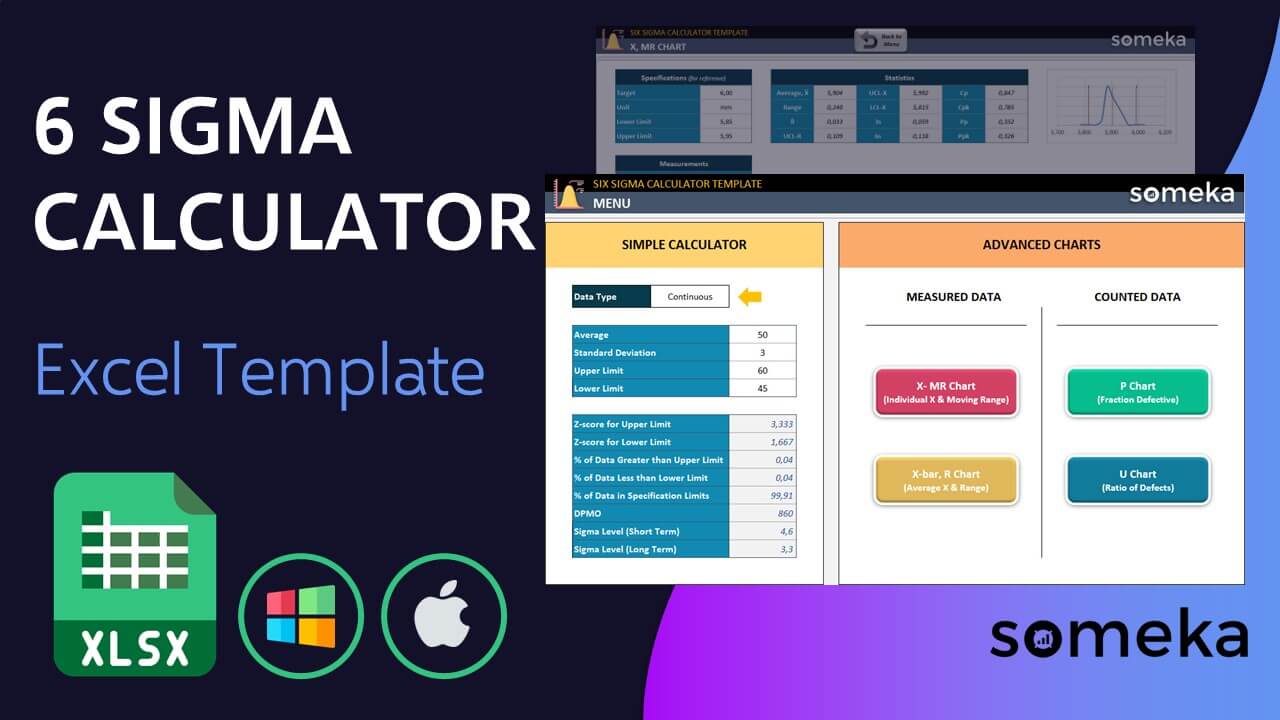
Six Sigma Calculator Excel Template
Calculate the Six Sigma level and create process control charts in Excel. Visual tool for monitoring the process behavior and variations. Ready for presentations.

TEMPLATE DESCRIPTION
Are you trying to make your business processes more efficient and improve quality without a lot of extra costs? Then look no further than the Six Sigma Calculator Excel Template! This tool is an efficient and cost-effective way to streamline processes, helping you to reduce waste and increase product value.
This easy-to-use calculator template makes it quick to evaluate complex processes to pinpoint areas for improvement, saving time and money.
To clarify, the Six Sigma Calculator Excel Template is incredibly easy to use, no matter the size or complexity of your business processes. Also, the control charts allow you to quickly visualize process stability, measure performance and make statistical analyses by calculating process capability.
In addition, helping you to analyze, interpret, and adjust processes to get maximum value out of every step.

Main sections of Six Sigma Calculator Excel Template
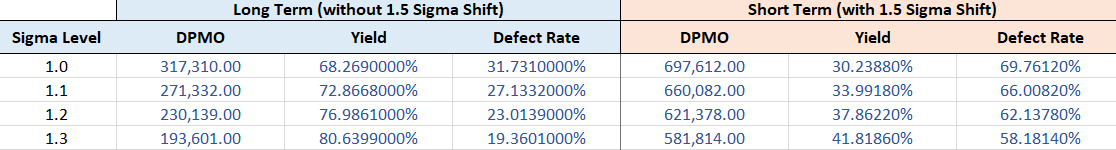
Basically, this template is made of Simple Calculator and Advanced Charts. Also, there is a Six Sigma-level reference table that shows DPMO levels used in Simple Calculator. Firstly, let’s check each of the sections.
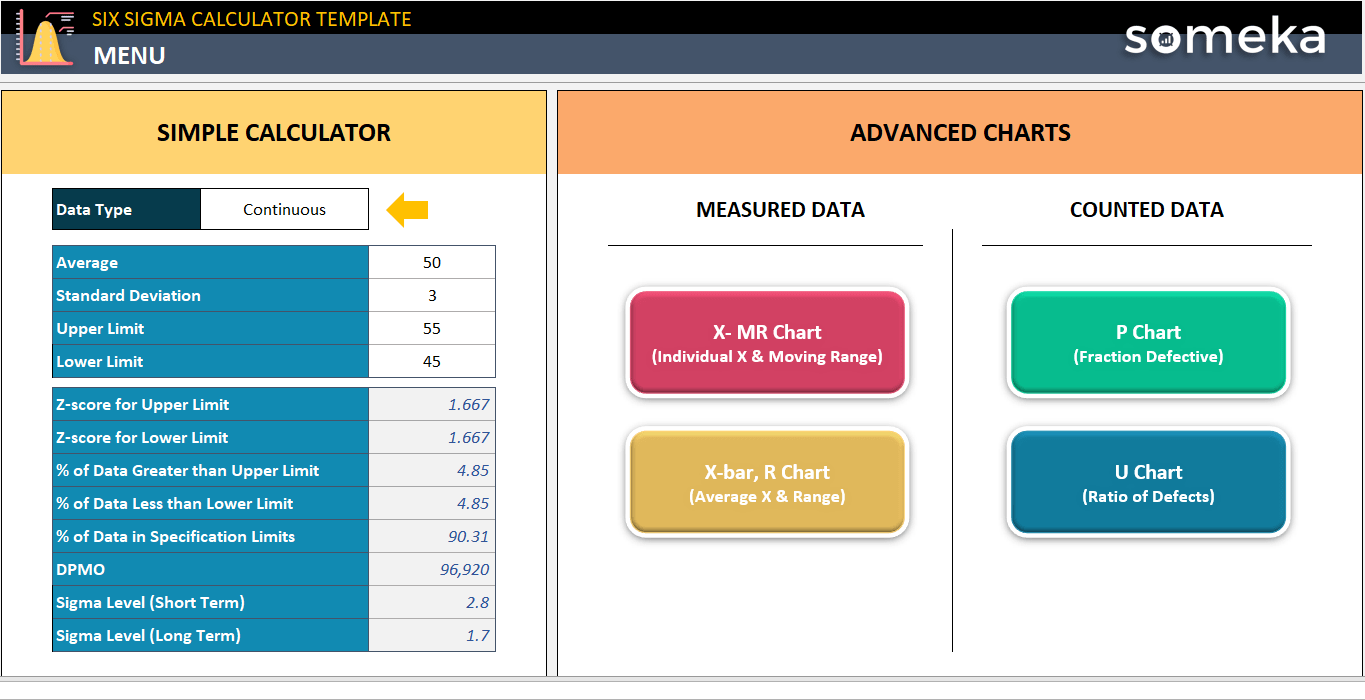
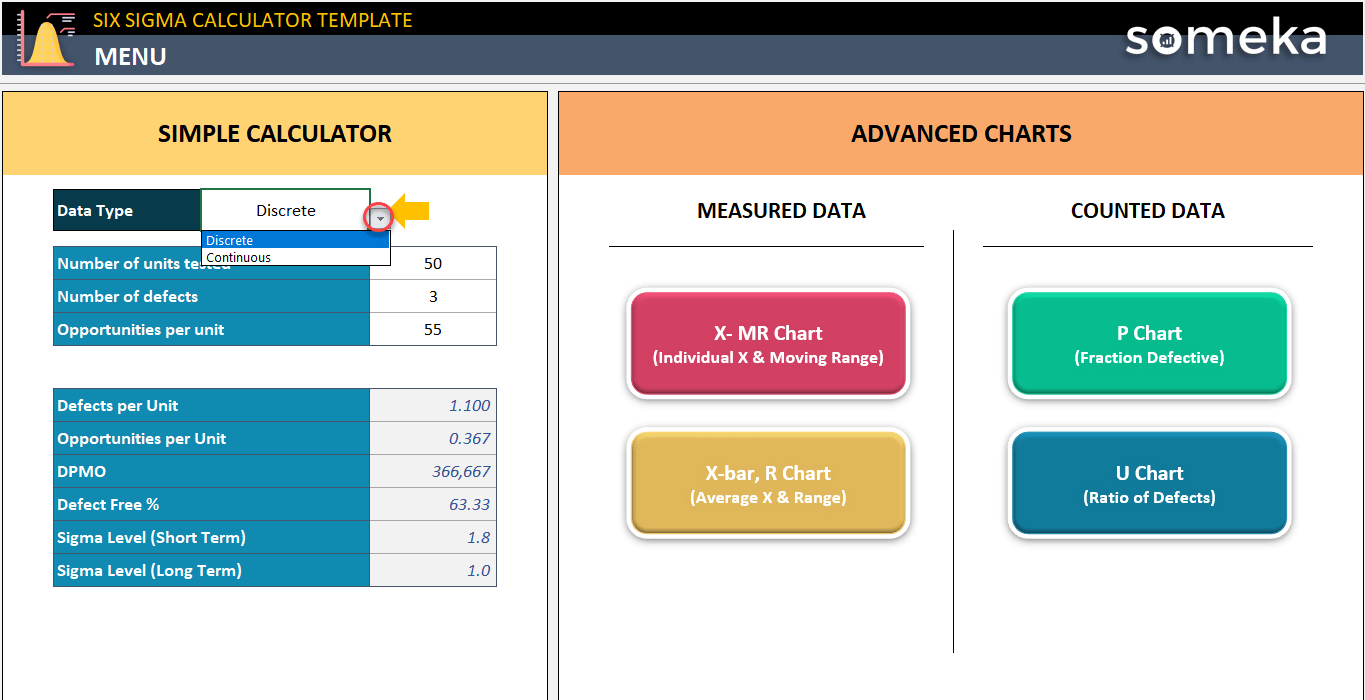
Simple Calculator:
In the menu, at the first glance, you see 2 parts: Simple Calculator and Advanced Charts.
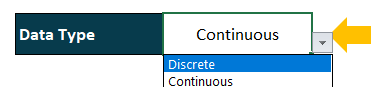
To clarify, a simple calculator has 2 tables and one drop-down menu. Above all, you can use the “Data Type” button and choose between Continuous and Discrete data types.
You can manually add some data like average, standard deviation, upper and lower limit and see the output in like Z-score, % of data, DPMO and sigma level and etc. in the simple calculator part.
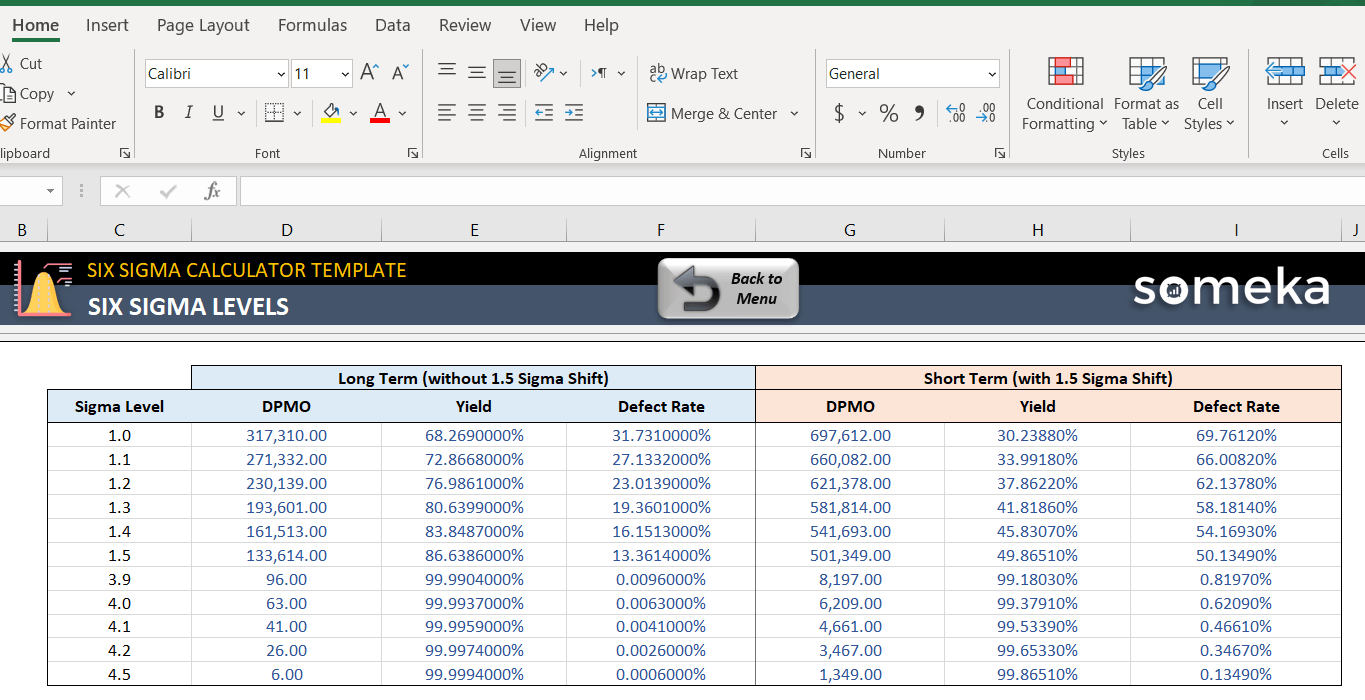
Six Sigma Levels Reference Table: A simple calculator uses the Six Sigma Level Reference Table as a reference for DPMO levels. If you have a different set of ranking for DPMO, you can change the table and the calculations will be adjusted accordingly.
Advanced Charts of Six Sigma Analyzer:
Secondly in the Advanced Charts part, you have the access to 4 different sheets. Each measured data and counted data have 2 different sheets that you can enter the data in detail and break down the whole process into small bites using different charts.
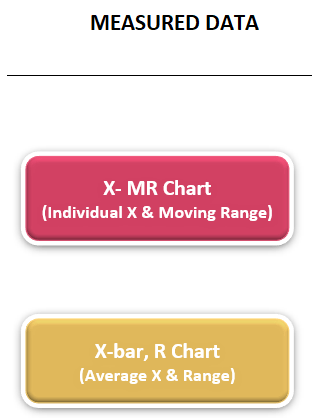
1. Measured Data:
This part consists of X-MR Chart and X-bar, R Chart.
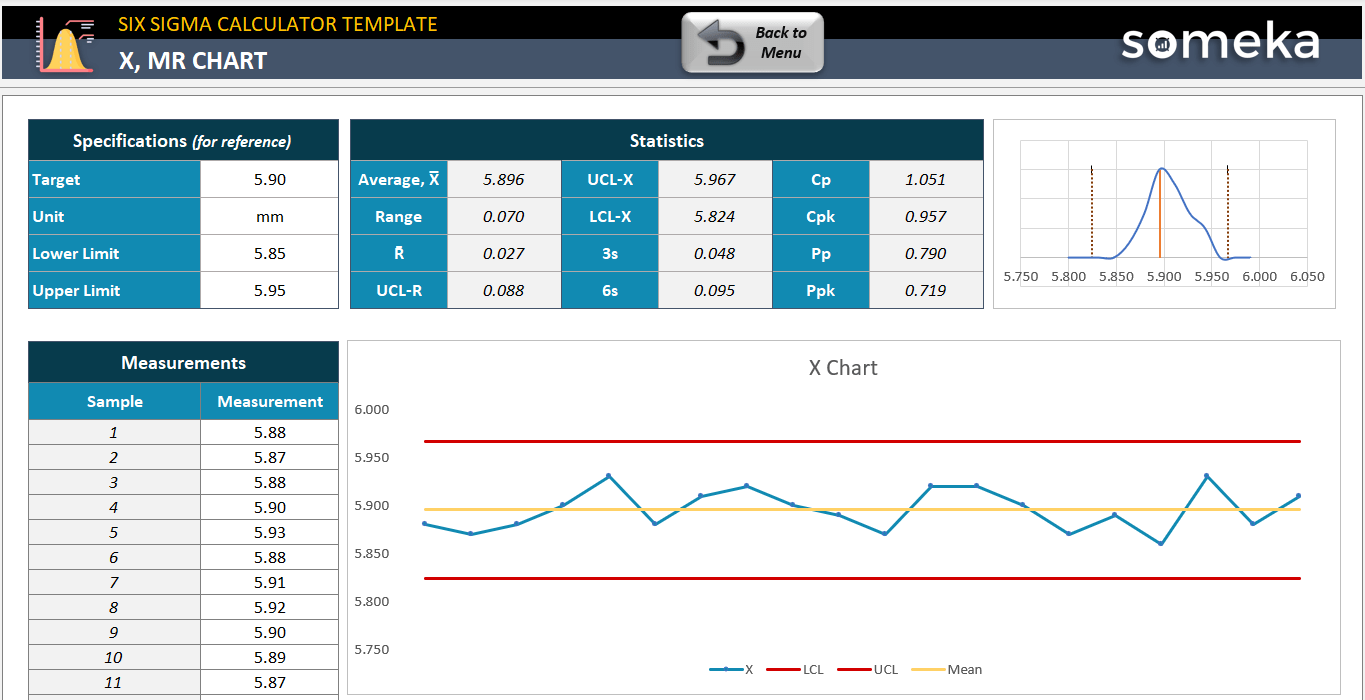
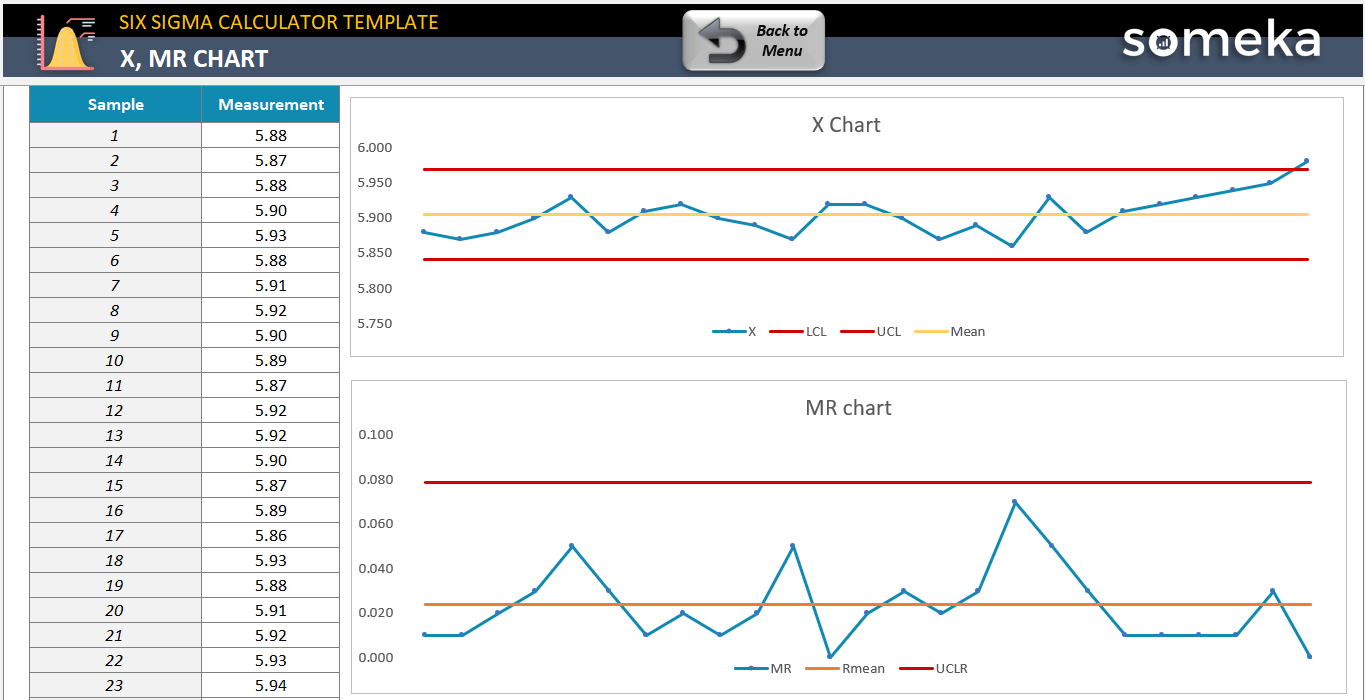
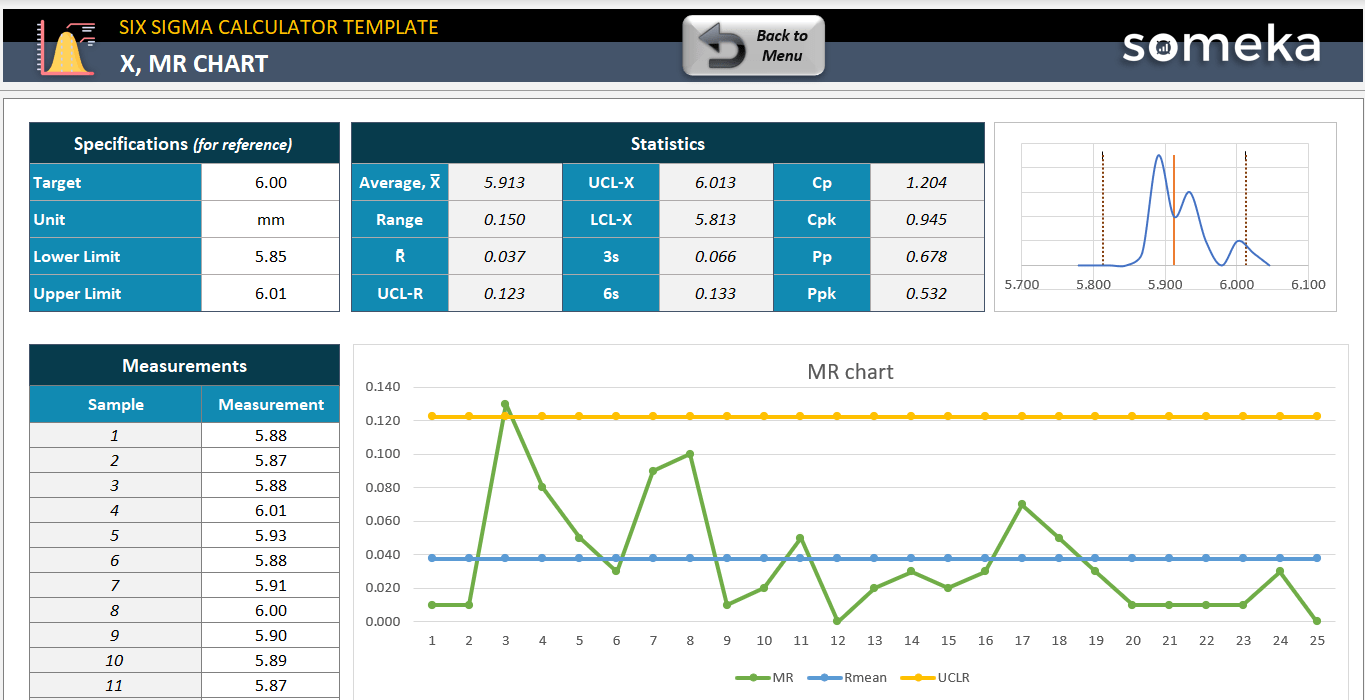
1.1. X-MR Chart
The specifications and measurements are the input parts, so you can easily add your data in related rows, then the Statics and X-chart, and MR Chart are your output sections and you can use the visualization of charts for a better understanding of the process.
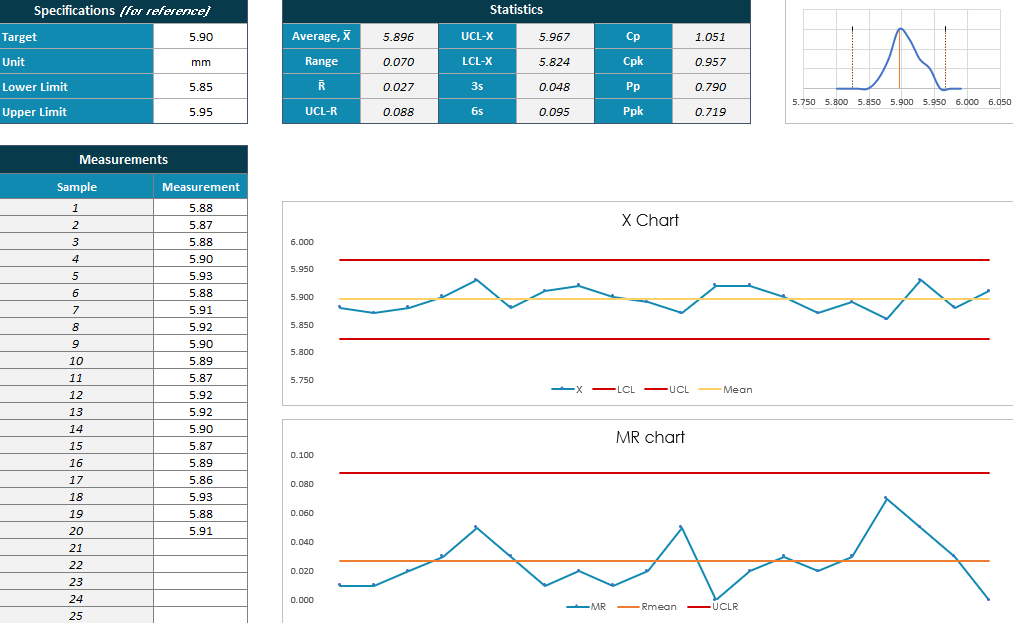
Moreover, the maximum number of data entries is 100 rows for each chart.
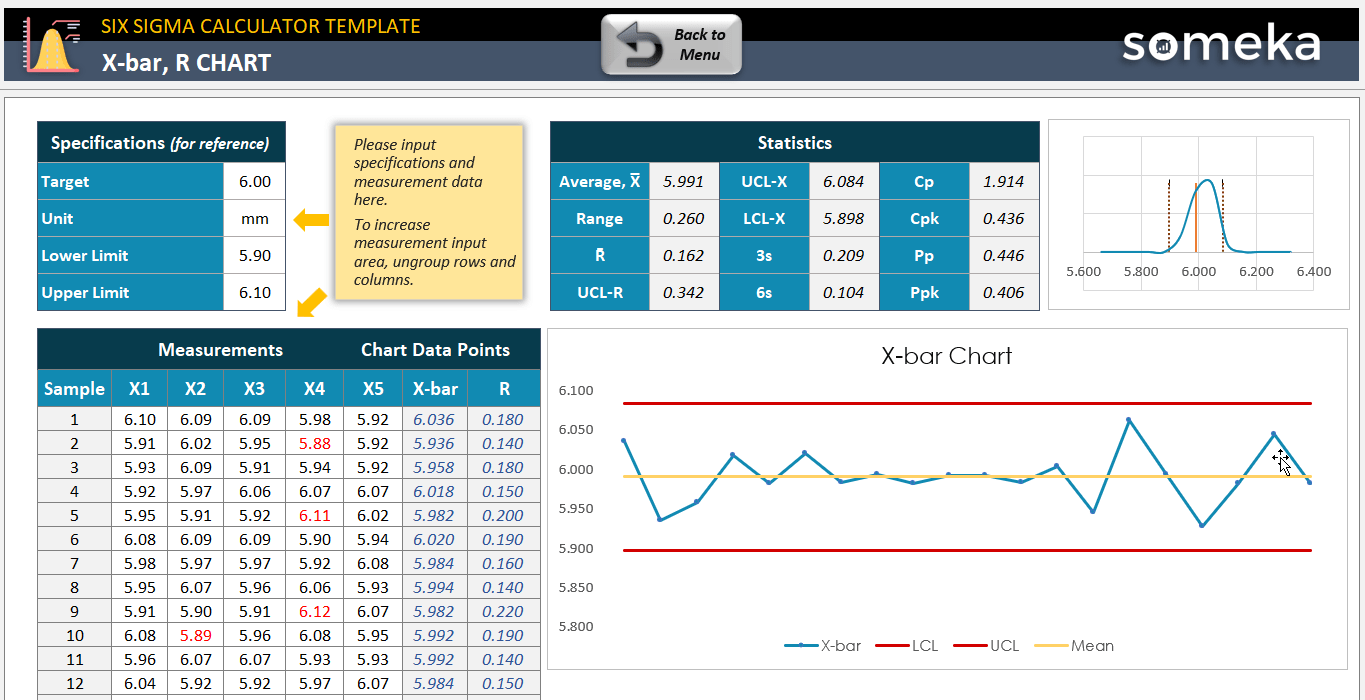
1.2. X-bar, R-chart of Six Sigma Calculator Excel Template
Secondly, when you are dealing with multiple measurements of samples in a process this chart will be useful for you.
Again, specifications and measurements are the input and the statics are the output section.
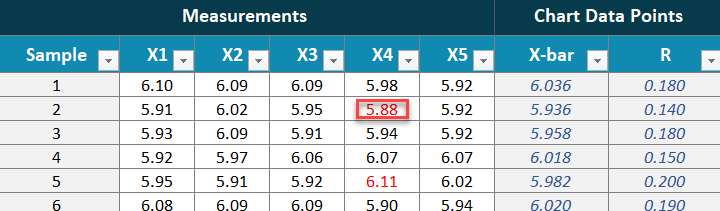
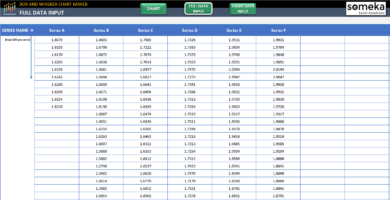
If in measurements you need more columns you can add them into 10 columns and 100 rows. Be careful that X-bar and R columns are the formulas and you cannot change them manually.
2. Counted Data of Lean Six Sigma:
In the counted data part, we can see P Chart and U Chart, let’s check each of them in detail.
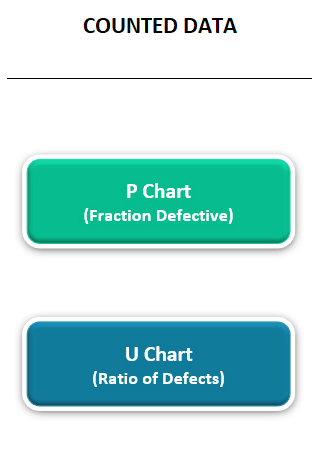
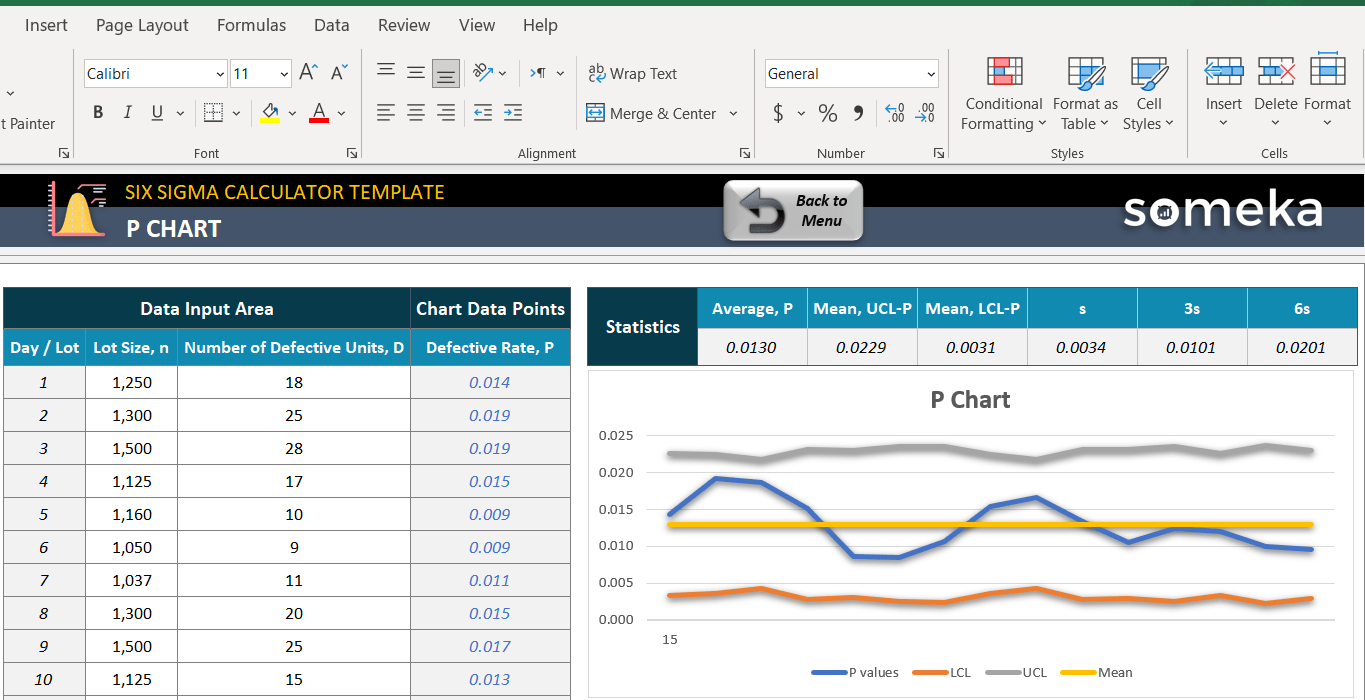
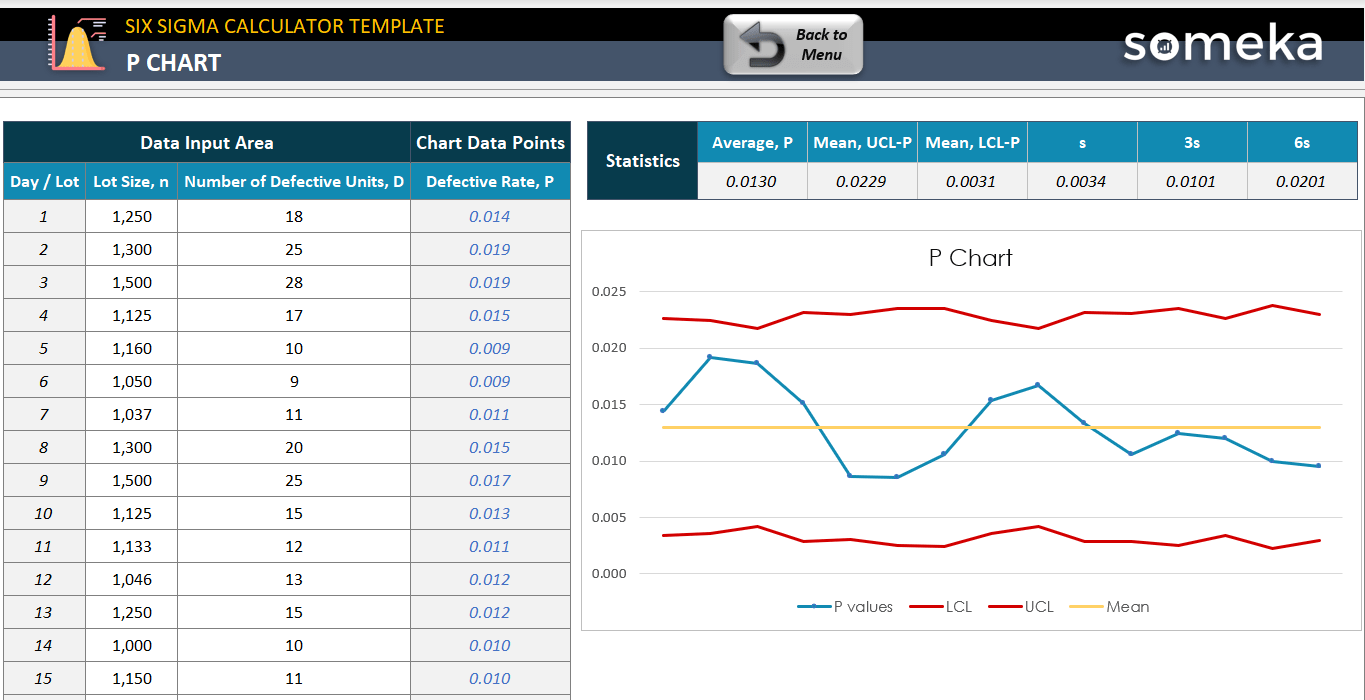
2.1. P-Chart
If you have a different number of Defective Units, you can add each of them in Data Input Areas with Lot Size, and automatically the Defective Rate will be calculated.
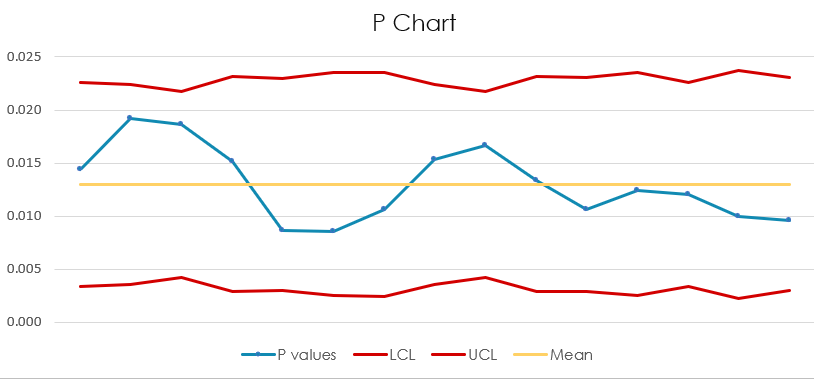
Moreover, UCL and LCL limits are different according to Lot Size, So, if the Lot Size stay constant, in the P-Chart they are linear.
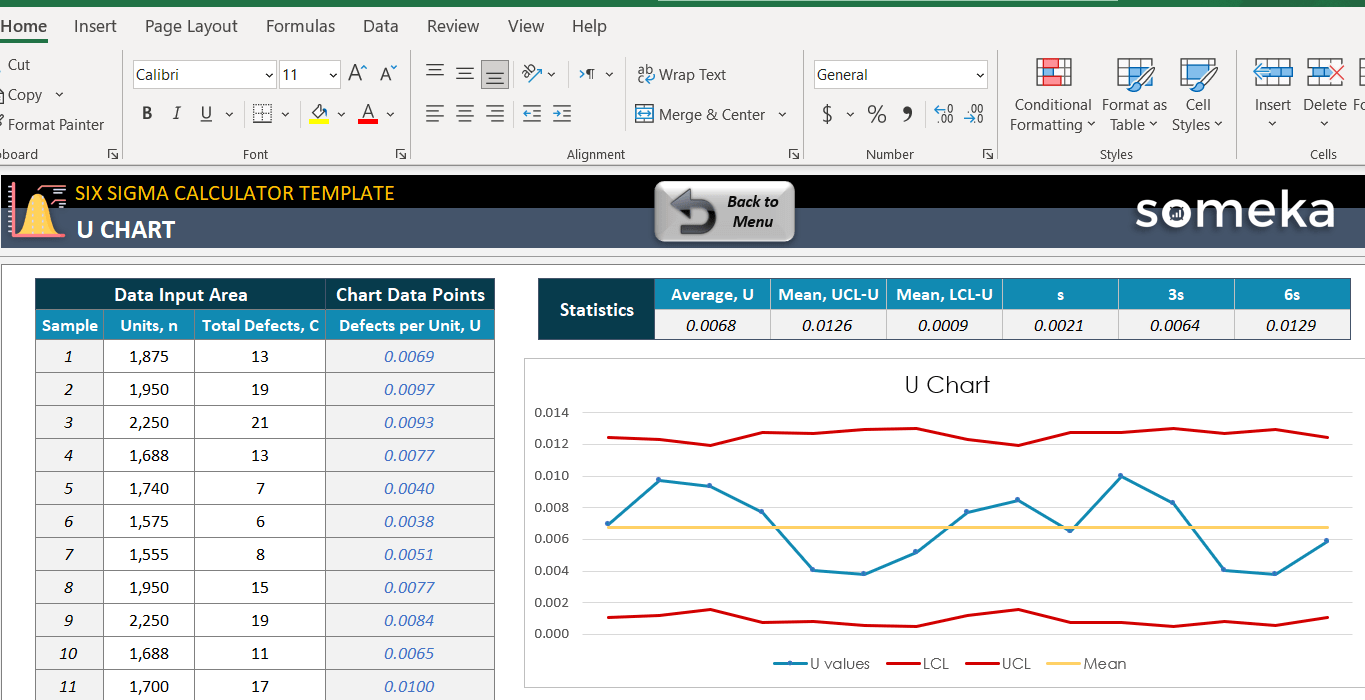
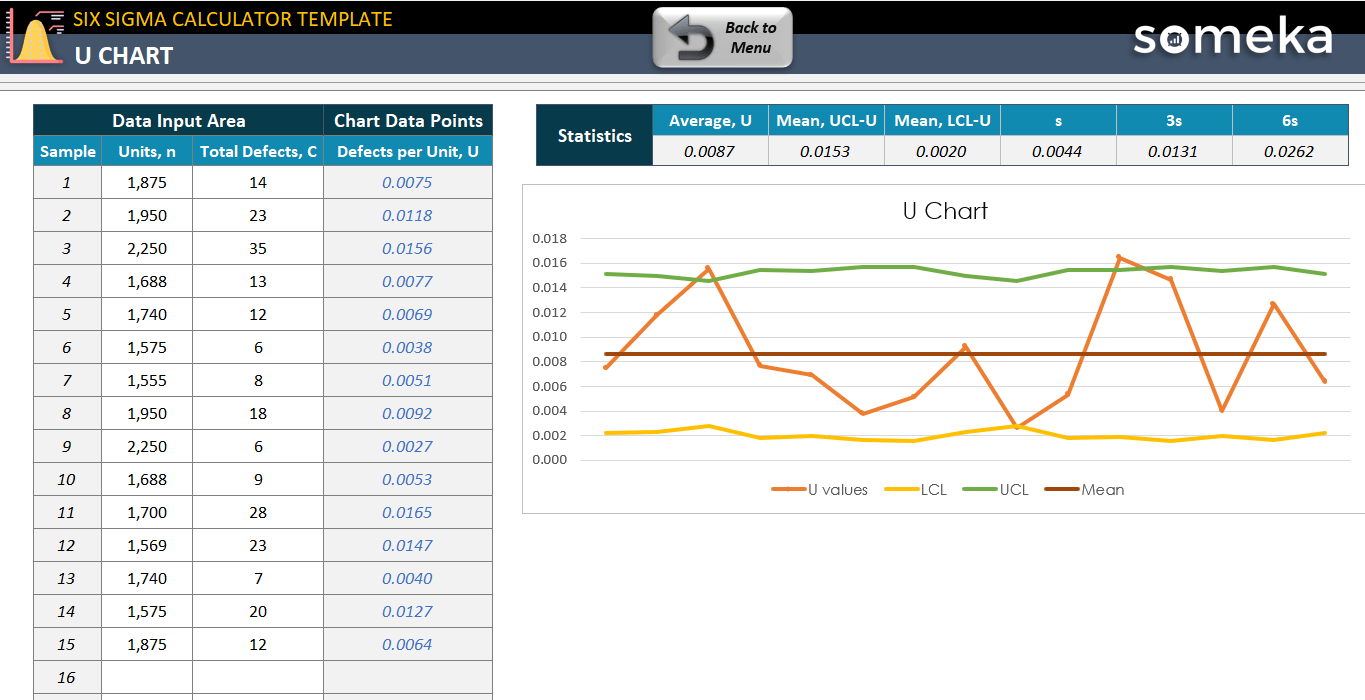
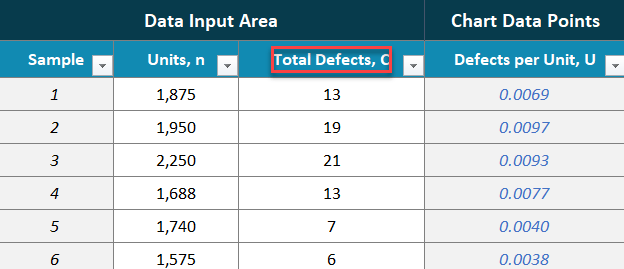
2.2. U-Chart
U-Chart is actually the ratio of defects. So, add your data to the data input area with total defects and units. Then, the statics are calculated automatically in this part of the Six Sigma Calculator Excel Template.
Six Sigma Calculator Excel Template Features Summary:
- 6 Sigma level calculator template in Excel
- Simple and advanced calculators and charts for different processes
- Dynamic charts using different colors
- Professional design and suitable for presentations
- On Sheet Instructions
- Print-Ready
- Works both on Mac and Windows
- No installation is needed, ready to use
- Compatible with Excel 2010 and later versions
- Does not include VBA or Macros
PRODUCT VIDEO
Watch the video below to see the template in action! Presentation also includes usage notes, explanations and tips & tricks about the template.
USER REVIEWS & COMMENTS
9 reviews for Six Sigma Calculator Excel Template
You must be logged in to post a review.
RELATED TEMPLATES
-
 This product has multiple variants. The options may be chosen on the product page
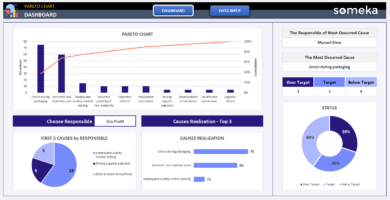
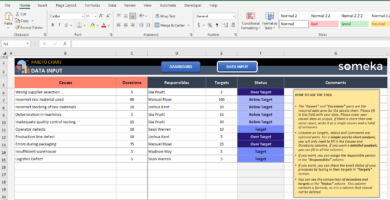
Pareto Chart Excel Template
$29.95 – $59.95Pareto Analysis tool in Excel. Input your data and visualize it with 80/20 rule. Automatic chart maker with printable dashboard. Ready-to-use.
-
This product has multiple variants. The options may be chosen on the product page
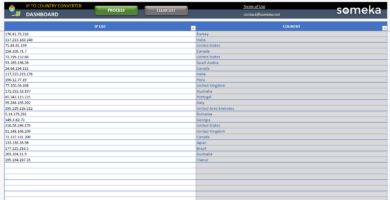
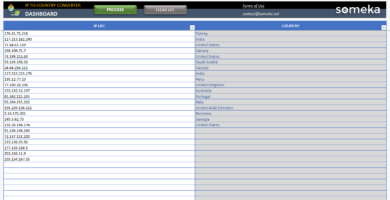
IP to Country Converter Excel Template
$29.95 – $59.95Excel spreadsheet to convert IPs to country. Bulk IP address converter. Paste your IP list and get location info in seconds. No installation needed.
-
This product has multiple variants. The options may be chosen on the product page
Forbes Global 2000 Excel List
$19.95 – $39.95Forbes Global 2000 official rankings. Top global companies list. Sales, profits, assets & market value info. Fully printable & sortable. Available in Excel.
-
This product has multiple variants. The options may be chosen on the product page
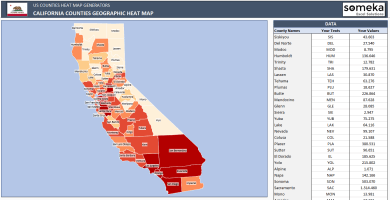
US County Heat Map Generator Excel Templates
$39.95 – $79.95Excel Template to generate heat maps for US Counties. Visualize your data in an editable spreadsheet. Copy paste shapes into Powerpoint.
-
This product has multiple variants. The options may be chosen on the product page
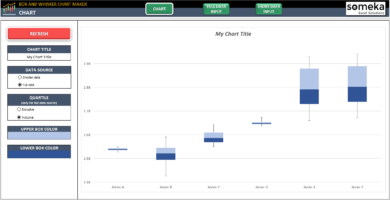
Excel Box and Whisker Plot Maker
$24.95 – $49.95Automatic box and whisker template. Create box plot diagrams with one-click. Dynamic chart and quartiles with different color options. All in Excel.
-
This product has multiple variants. The options may be chosen on the product page
Histogram Maker Excel Template
$24.95 – $49.95Excel spreadsheet for histogram diagrams. Create bar graphs in seconds. Printable dynamic charts with data split options. No installation needed.

Abrar S. –
The Excels created by Someka are incredibly helpful and simple to use! Their team is incredible!
Wiliam B. –
It is incredibly straightforward to personalize this to my specifications!
Nancy A. –
How can add more functions to check on Xbar? Any help??
Someka –
Hello Nancy,

You can quickly get the information you need by examining the X-MR Chart, in the upper left box.
Check out the following image:
If you have any further questions, please do not hesitate to contact us at contact@someka.net
James Conway –
It was simple to use for the Six Sigma method, which impressed me. Thank you for the outstanding quality!!
Christy S. Bauer –
a simple technique executed brilliantly! This template might help you save time and effort while achieving excellent results. Give it a shot and see how it can help you!
Jeanette Lopez R. C –
Excelent excel tool!!
KyleK96 –
This layout’s main characteristics! The clean lines and use of white space demonstrate the designer’s attention to detail. The end result is a visually appealing and user-friendly design.
Blair Fox –
Ok, it is nice. But I need some calculation of my raw data with a formula, and then I must add it to the template. How?!
Someka –
Hello Blair,
A file that can be edited should be provided, along with a purchased password. Unprotect your sheets and display headings to create rows and columns.

Hope it helps!
Gene H. Moser –
Hello, I really enjoy the template, but is it possible to make changes to the licence?
Someka –
Hello Gene,
We will almost certainly upgrade your license from single-user to multi-user. Please send us an email at contact@someka.net and our team will get back to you with a link to upgrade your license.