Fishbone Diagram Excel Template
Ishikawa Fishbone Diagram Maker in Excel. Printable template to define root causes. Brainstorm and add the “bones”. Ready for your presentations.


30-Days
Return
One-Time
Payment
Instant
Download
Redeem 3 Templates
Download 3 premium templates of your choice for free each month.
Continuous Technical Support
We’ll be your one-stop assistant for all your Excel & Google Sheets questions and needs.
Multi-User Environment
You’ll be entitled to multi-user licensing for your templates.
Cancel Anytime | Growing Catalogue | Continuous Updates


This template is also included in bundle with special discount! See details >>
TEMPLATE DESCRIPTION
Do you want to find root causes of a particular problem, but you don’t know how to visualize it? This Fishbone Diagram Excel Template will help you to display your root cause analysis in seconds.
A Fishbone Diagram, or in other words Ishikawa Diagram, is founded by Kaoru Ishikawa who is a Japanese quality control expert. The fishbone model is also known as the cause and effect diagram because of its main purpose. You can use this diagram to identify all the potential causes of a certain issue or event. You can categorize these causes to get effective and clear solutions.

Thus, you can brainstorm the reasons for the issue with your team members. Do not forget to encourage your colleagues to share their thoughts about the factors contributing to the occurrence of a problem.
Fishbone Diagram Excel Template Features:
Our template allows you to list 10 different main causes in each of the 6 categories.
These already existing categories are People, Machine, Method, Environment, Leadership, and Materials.
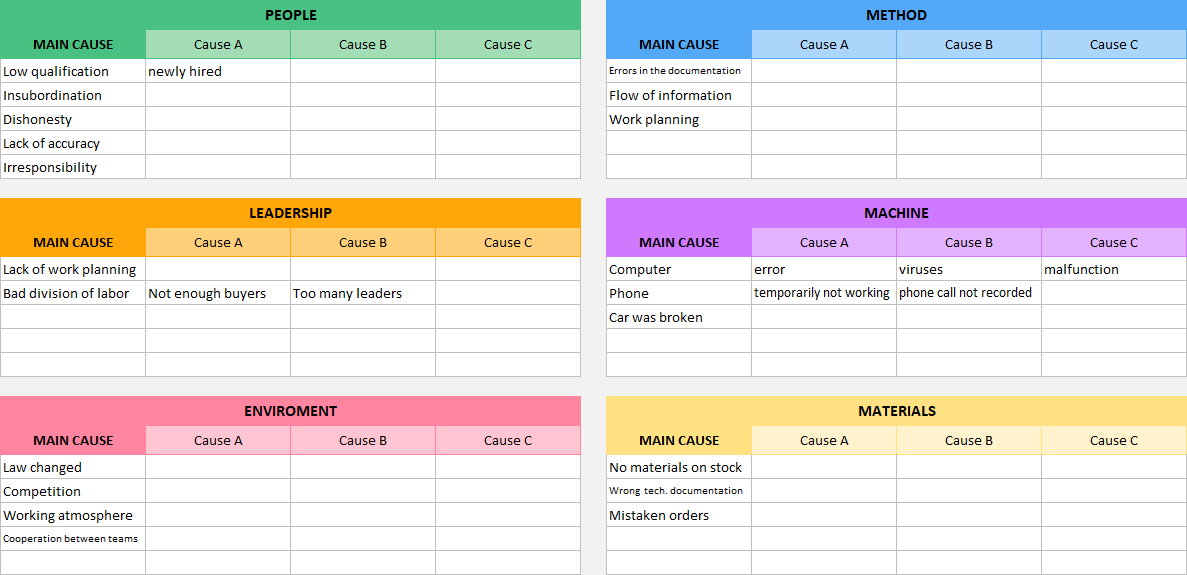
You can rename the existing category titles according to your needs and the type of issue in the diagram used. Additionally, if that is not enough, you can also add up to 3 indirect issues to Cause A, Cause B, and Cause C sections. These sections are related to each identified main cause.
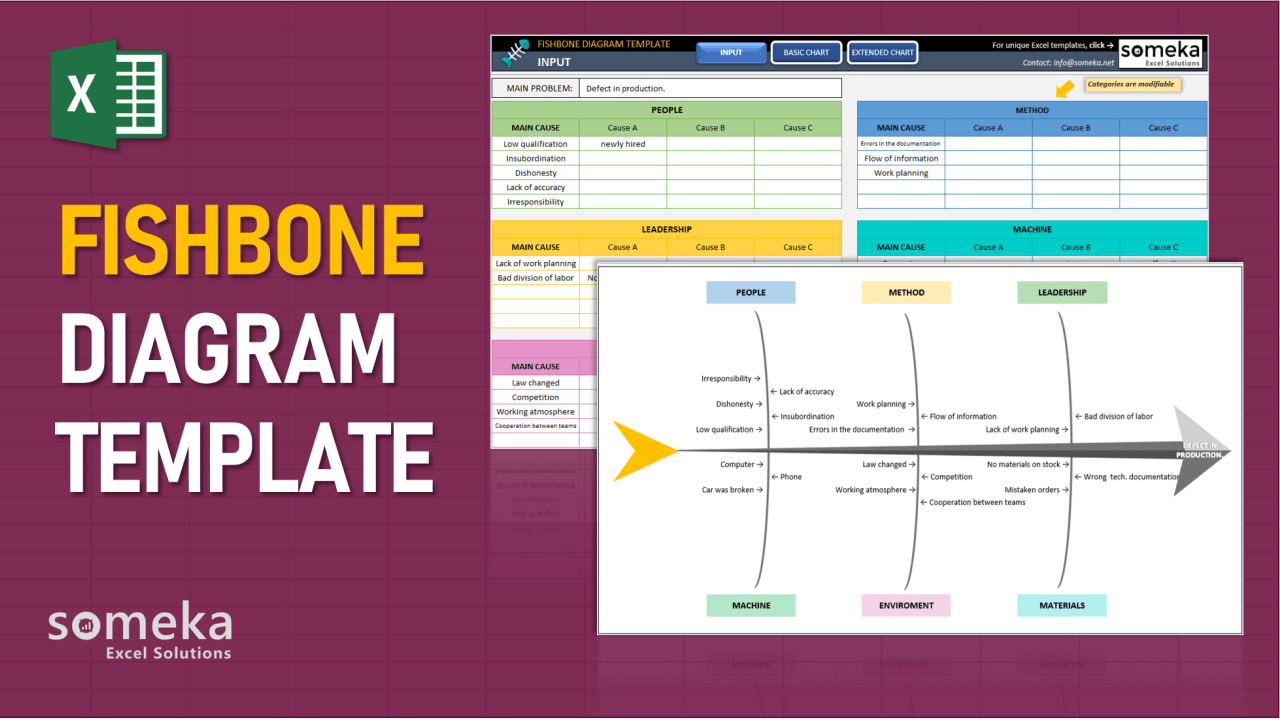
There are 2 types of Ishikawa Fishbone diagrams on this template. The first one is a basic diagram in which you can clearly see your causes and arrange them easily. The second one is extended chart which is designed to focus on bullet points of the causes. It is good for understanding the cause in a better manner and solving it part by part until the problem is solved.
Why should we use a Fishbone Diagram?
When you focus too much on the problem itself, you may not see the exact root causes. But, you should reveal the minor issues first to get the big picture. This fishbone diagram can help you not only catch all of the reasons, but also how, and when they occur.
If you would like to get effective solutions by creating this diagram, please try to involve all parties such as teammates or colleagues. When possible, please make sure your team agrees with you about the exact definition of the problem first. Then, just start to add new causes on your Excel Fishbone Diagram Template.
After that, you should correctly identify the categories or areas the main issue is involved in. Now, you can let the contributors list the points they experienced about the issue separately per each category.
While creating a list, all of you should ask some questions to find the exact reason. The best question is “why?” to reach the root cause of the problem.
After collecting the list from each contributor, you should check if all the list goes to the correct categories.
After you identify and fill up all the problems, now you can click on the buttons above to see the whole diagram. The basic chart demonstrates only the main causes in each category. It is much clearer and more compact. But, the extended chart also contains the indirect causes you have previously written about.
You can choose the one that suits you better. Both diagrams are printable and easy to use!
Fishbone Diagram Excel Template Features Summary:
- Do some brainstorming and find the root causes in Excel
- Create a cause and effect fishbone analysis
- Full print ready
- Informational notes included
- No installation needed. Ready to use.
- Works both on Mac and Windows
- Does not include VBA code or Macros
- Compatible with Excel 2007 and later versions
PRODUCT VIDEO
Watch the video below to see the template in action! Presentation also includes usage notes, explanations and tips & tricks about the template.
FREQUENTLY ASKED QUESTIONS
USER REVIEWS & COMMENTS
10 reviews for Fishbone Diagram Excel Template
You must be logged in to post a review.
RELATED TEMPLATES
-

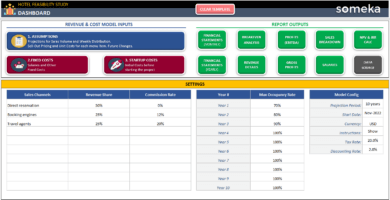
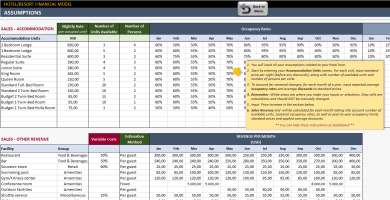
Hotel Feasibility Study Excel Template
$0.00 – $199.95Hotel Financial Model Excel Template will allow investors or business owners to make financial projections and decide on their investment projects.
-
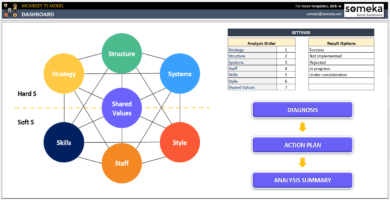
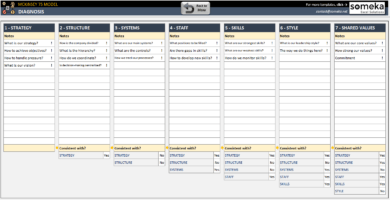
McKinsey 7S Model Excel Template
$0.00 – $59.95Excel spreadsheet to use McKinsey 7S Framework. Clearly analyze relationships between key business elements. Fully printable and ready to use.
-
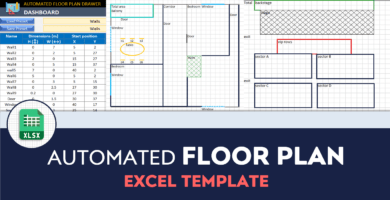
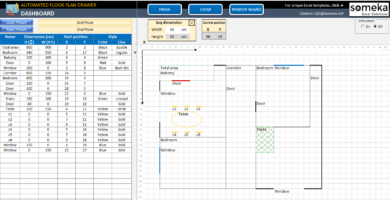
Floor Plan Creator in Excel
$0.00 – $69.95Automated floor plan drawer in Excel. Easy-to-use template to draw floor plans for your home, office, or restaurant. Ready to print.
-
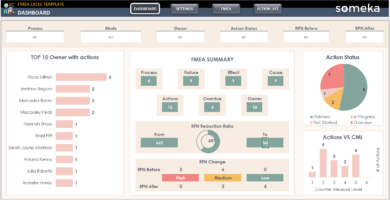
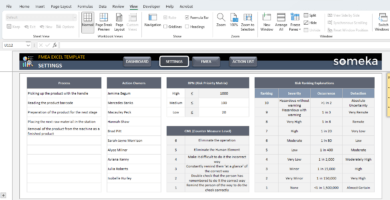
FMEA Excel Template
$0.00 – $69.95Risk analysis tool in Excel. Detect failure modes and plan preventive actions with FMEA model. Dynamic dashboard included. All print-ready.
-
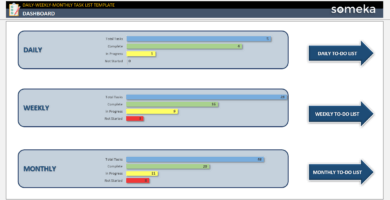
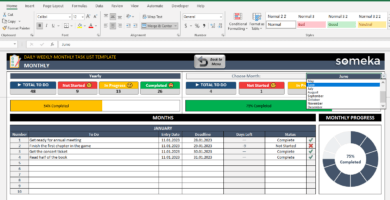
Daily-Weekly-Monthly Task List Excel Template
$0.00 – $69.95Excel Task List Template on a daily, weekly, monthly basis. Save your headspace and keep track of your to-dos easily. Works in Mac & Windows.
-
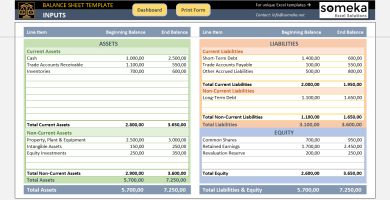
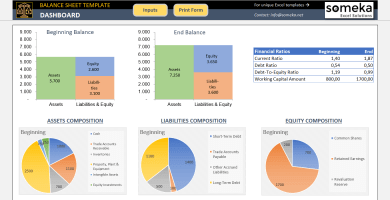
Excel Balance Sheet Template
$0.00 – $59.95Balance Sheet Template in Excel spreadsheet. Automatic dashboard with charts and financial ratios. Easy-to-edit & ready-to-print. Export to PDF.
David J. –
It is a must to have in business and startups. thanks for making it with this good price.
Melody CH –
I wish there was an online version of thus template available.
Someka –
We apologize, but unfortunately, there is currently no online version of this fishbone diagram available. You can check out other templates with online versions at the provided link.
Jerry Almeida –
Usually, I don’t leave comments for businesses, but this template was what was promised in the whole description. Thank you for the good visuals.
Maryam A. –
it is so amazing. I used it on my MBA class.
Ronan –
thanks it was a useful and startighforward template. How many main causes I can add in to my template?
Someka –
Hello NeelShah, Thanks for your feedback.
You can add approximately 10 different main reasons for each category.
I hope this helps you.
Yasin EJAZ –
How I can change my license? thanks for help;
Someka –
Hello, we have 2 kinds of licenses, Single User and Multi-User, we explained here.
Please contact us with the E-mail that you purchased from us and we can discuss how we can upgrade it to Multi-User.
Hope it helps.
Our support email: is contact@someka.net
Varun –
This is cool template to work with, I like that the fishbone is automatic and shows everything I add in other sheet.
Belle Deb –
Hi,
I purchased the modifiable version of Fishbone Diagram, but I am not able to modify it. I would appreciate your help.
Best
Someka –
Hi Belle,
After purchasing modifiable versions of our templates you may self-customize them according to your particular needs.
To make modifications, you have to first unlock your sheets and workbook with the password we send with the purchase. To learn more about unlocking please click here.
Hope this helps!
Jordon –
Really cool template thanks guys but I have seen “export pdf and png” buttons in your other products. I wish this product had this convenience.
Someka –
Hi Jordon,
Thanks for the feedback, we have noted this for future updates.
Now, to export pdf please follow these steps.
Go to the File tab.
Go to the Save a Copy tab.
Select PDF as the file type.
Press the Save button.
Hope this helps!
Wayna –
nice that there are basic and extended chart options