The Definitive Guide To Trading Journal: 5 Most-Asked Questions!
Do you need a trade journal definition with key concepts and a clear step-by-step guide? Then keep reading this comprehensive guide to trading journals.
This post will answer five main questions on trading journals:
- What’s the Definition of Trade Journal?
- How Can You Make Your Own Trading Journal?
- What Should Be Included in Your Trading Journal?
- Which Metrics Should You Use in Your Trading Journal?
- How Can You Calculate Your Trading Profit and Loss in Excel?
What’s the Definition of Trade Journal?
A trading journal is the most essential tool for a trader or a broker. You can log all of your trade details and track your progress. Trading journals help traders to identify their weaknesses in their trading process. They can also make their trading and exchange process more consistent while keeping you (the trader) acknowledged and responsible for your spending. And also, if you want to plan and decide upon the best strategy for trading, trading journals are for you!

How Can You Make Your Own Trading Journal?
There are actually two types of main software for professional brokers: A trading program and a trading journal software. First, let’s take a look at the trading program in which traders and brokers operate all of their transactions.
Trade, Exchange and Transaction
These programs allow the trader or the broker to deal with all of their financial exchanges. You do all of your ‘trading’, hence, the name. Every action, transaction, exchange and trade you make goes through here. It is the basis and the most important tool for trading since it becomes impossible if there is no software to connect the two parties. This software can be a broker program or agency software as well.
These programs deal only with numbers. The decrease of currencies, the increasing rates of stocks, companies’ net worth and their shares’ worth… They are all shown here for you to look at and make your transactions. However, this program is not good at achieving a key element in trading: Analysis.
These applications are not designed to show you the data in a comprehensive and somewhat ‘fancy’ way. They do show you how much you buy or sell and how much you will be paying or will be paid. But they do not bother with detailed charts and graphs in order to make their platform more presentable. And they have two logical reasons for not heavily focusing on illustrated analysis tools. Simply put, they are not programmed to do that. They have much more important purposes.
Main Purposes of Trading Programs:
Among them we can say:
- They are built in order to provide every trader and broker on their platform a secure transaction.
- They need to protect every customer, client, broker, trader, buyer and seller’s information and details.
- Provide fast exchanges and trading.
- Responsible for backing up their servers.
- Their servers and platform cannot be down.
No matter what the situation is their website, mobile application and the ability to trade must go on. Because if their platform goes down because of unexpected traffic, that means the platform and also, every broker in that platform will lose money during the period in which the site is down.
They are not interested in data visualization that much. Even though there are media companies which provide some visualized tools, they are not satisfying professional brokers and traders.
Let’s say, they attempted to create and apply a visual analysis tool in their platform. It will always be impossible to satisfy every customer’s needs. Every trader’s needs are different, that is why there will be always something lacking for many brokers in the platform. They have to build incredibly detailed and customizable software in order to meet every trader’s requirements on the platform. And that is just not easy, that is impossible. However, if the traders can create their own analysis and record their own progress in their own journal, then, they will be able to satisfy their needs. Because they will be in charge of what to put in and how to do so. And this brings us to the other type of software traders use.
Creating a Trading Journal
These programs allow the trader to create their own analysis based on their own trades, exchanges and transactions. As it is mentioned above, they help brokers to log, keep track and store their trades. They also aid you to look for the big picture and adjust your actions for your financial future.

Traders want to record their trades, perform elastic analyses and see what financial trends they bring with them. These actions are best done in spreadsheets and the best known and used spreadsheet software is Microsoft Excel.
Excel is the right choice for you to create your trading journal. Most of the trading programs provide you with your own transaction history. If you look for it, you can find the data on how much you spent, how much you made a profit, how much stock you bought or sold; every little transaction you made is recorded and provided to you as your account activity. If you use Microsoft Excel in order to create your trading journal, the only thing you have to do is take this information and put it in an Excel spreadsheet. You can start your analysis process without putting every data of your every process manually.
Creating a trading journal can take time and it is not an easy task to do manually. But before sitting down and starting to create your trading journal, you should consider and decide on the elements and sections you want to include in the document. These are important decisions to make. Because it can determine your progress on how good or bad you are doing and also potential future plans.
What Should Be Included in Your Trading Journal?
Even though there are some ‘must-have’ factors in your data, you should consider detailing in your trade journal definition. Actually, there is not a universal standard you can take notes from. Because every trading journal is and will be different since every trader and their needs are different. In addition to that, a trading journal changes significantly depending on the stock type, amount, exchange rates and a market’s movements.
The ‘must-have’ information can include Volume, Price or Unit Price and Date. One of the most interesting and useful data you can analyze in your trading journal is Profit Trends. For example, you can create a formula in Excel to calculate how much profit you made from each of the transactions you made. And in time -this can be daily, monthly or yearly- you can see the decrease or increase on it and adjust your financial decisions and strategy.
Or you can download a third-party template and let this Excel template do these actions for you. A trading journal template can provide incredible visual graphs and charts based on the analysis it conducts. It can be as detailed as you want, providing Account Codes, Security Codes and Commission sections in order to make your trading process easier and faster. A third party Excel template such as Someka’s Trading Journal Template, which you can find more information below, can help you to better your transaction analysis process in Excel.
Which Metrics Should You Use in Your Trading Journal?
You should decide on these metrics without any emotion, prejudice or opinion. Due to the fact that any manipulation of these metrics and the data related to them can give inaccurate results. That is why it is very important to take your time and research which metrics you want to include in your trading journal or not to include.
In order to better understand trade journal definition, here are some of the most used metrics to give you an example:
Main Metrics:
- Net Profit: Whether you enter your daily, monthly, quarterly or annual profit, you should get hold of your net profit information and put it in the trading journal. Every profit you gain from any of your trades is important, but seeing the net total profit can help you to analyze all of your trades.
- Net Loss: The net loss of your trades, also known as net operating loss, is to be included when (or if) your expenses and your spending exceed your income and/or revenue. Your losses are as important as your wins, they can be even more important. By analyzing your net loss, you can change your future plans. Then, it is possible to adjust where you invest in or spend your money.
- Winners: This metric shows all of the stocks, trades, shares, companies or cryptocurrencies that you invested in or bought and made a profit on it.
- Losers: Again, do not be afraid to note your losses as well. You can learn from them in your future financial actions and transactions.
- Average Win: You can also evaluate and write down your average win rate from any of your trades.
- Average Loss: You can also see the average loss rate from the analysis of the trades you did not make a profit from.
- Turnover: In this metric, you can enter the data on the amount of stock traded during a specific period of time. This period of time can be a day, a week or even a decade, it depends on your choice.
Other Important Metrics:
- Commissions: All of the commissions you had to give to different platforms which occurred during transactions will be noted in this section.
- Gross Profit: This section shows the profit you make after it deducts the spending you have done. It is common in your income statement or if you have a business or a company, in the company income statement.
- Profit/Loss Ratio: You can analyze your profit-to-loss ratio on each of your trades.
- Win Rate: You can always lose or win from trades. This win rate shows you the percentage which you made a profit from a trade.
- Expectancy: Trading expectancy calculates the typical profit you can make from each of your trades.
You can also use additional trading alert service to foresee the possible changes on your portfolio.
Start Creating Your Trading Journal!
As the trade journal definition is a very general concept, every trader or broker’s creating process can be different. However, some of the steps you can find below will guide you while creating your own trading journal.
- Choosing a software: If you want to use a basic data processing software with no learning curve, do not hesitate to open up a worksheet and start creating your trading journal in Microsoft Excel.
- Entering your data: Every trading journal starts with your raw data. You can manually enter trade details. Or much more efficiently, you can export your transaction history from your broker.
- Keep recording your current trades: You do not have to confirm and start analyzing your data as soon as you entered it. If you are in the middle of multiple transactions or purchases, or you know that you will buy or sell trades in the near future, you can wait for them. Then just put that raw data into your spreadsheet.
- Consolidating your data: When you are sure that you have enough amount of data, confirm them. Because this information will determine your success. That is why consolidating your data is an important step that you should not forget.
- Creating a trade log: By entering formulas in order to analyze and get accurate results, you would be creating a trade log. Here, every transaction is calculated, filtered and sorted for analysis.
- Establishing charts and graphs: You can choose to look at your trades rather than reading them as well. In Microsoft Excel, you can create detailed, customizable and efficient charts and graphs based on your analysis.
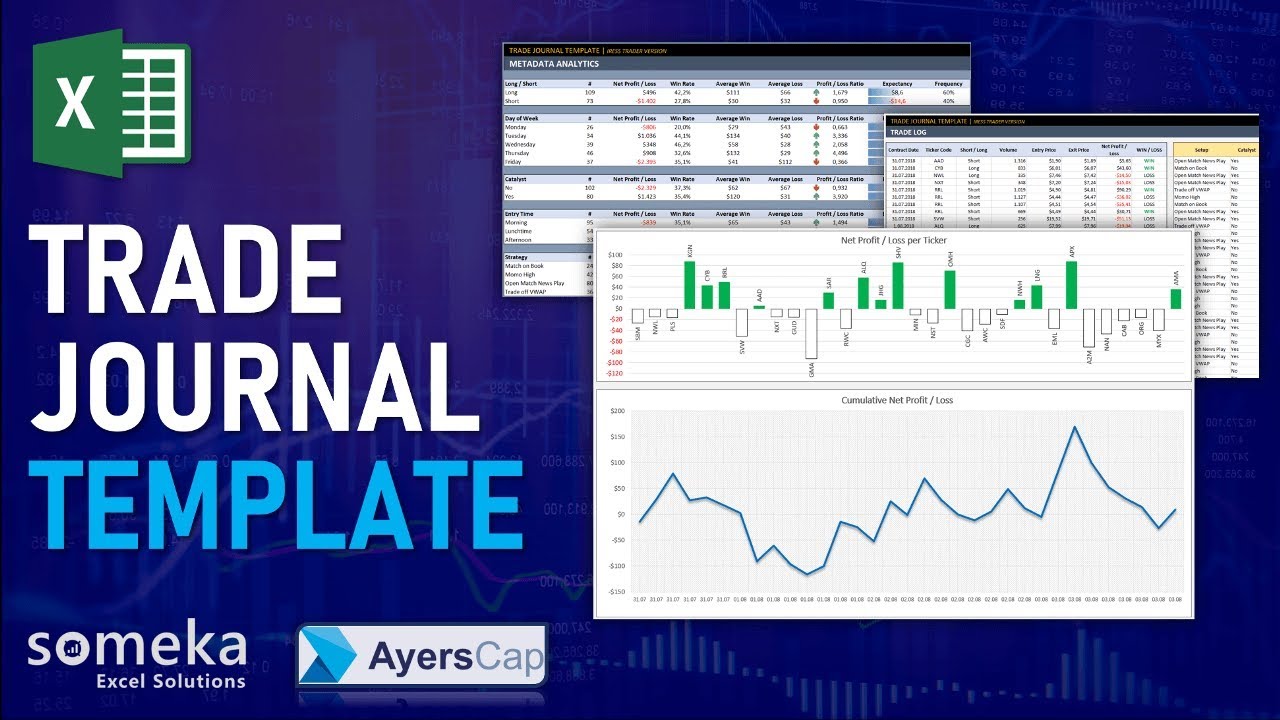
Trading Journal Template:
As you can clearly see, creating a trading journal is a hard task with crucial steps to follow. If you are not sure about how you can write formulas or analyze your raw and processed data, you can always download and use a template in Microsoft Excel.
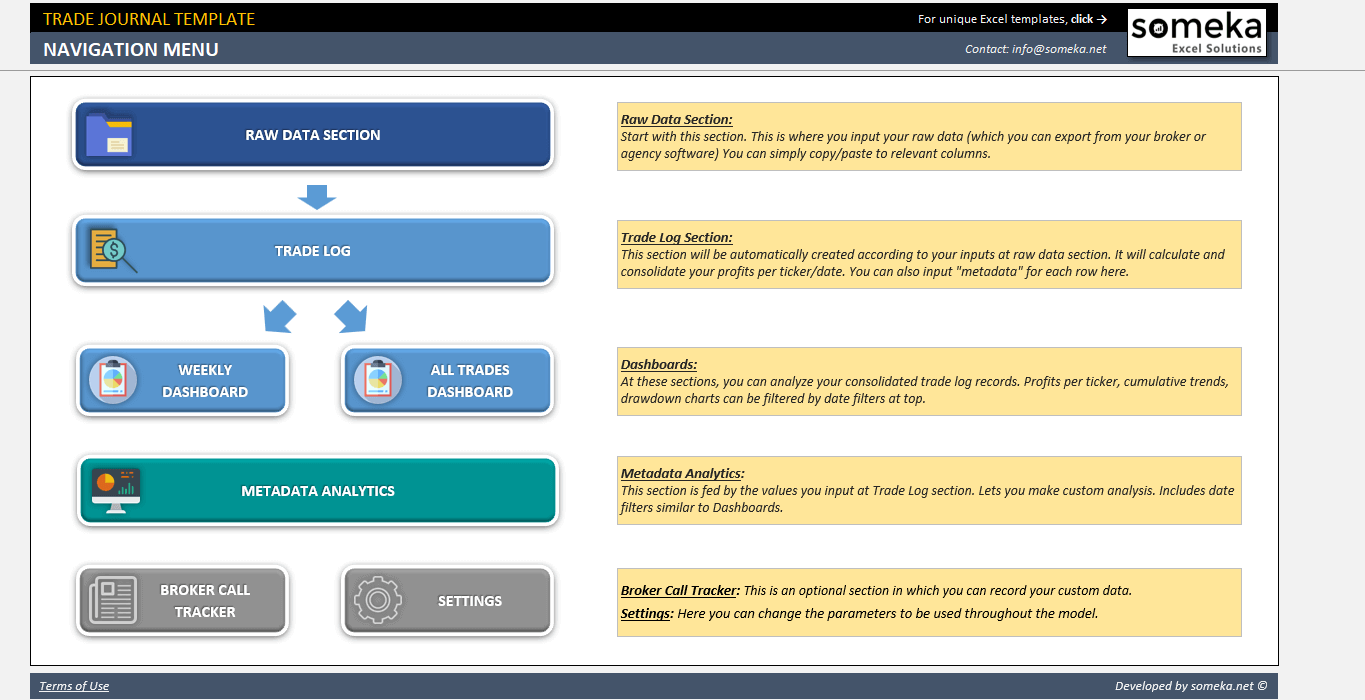
Someka offers a Trading Journal Template which can be used by casual traders and also professional brokers as well. It is specifically designed to follow those steps which are mentioned above.
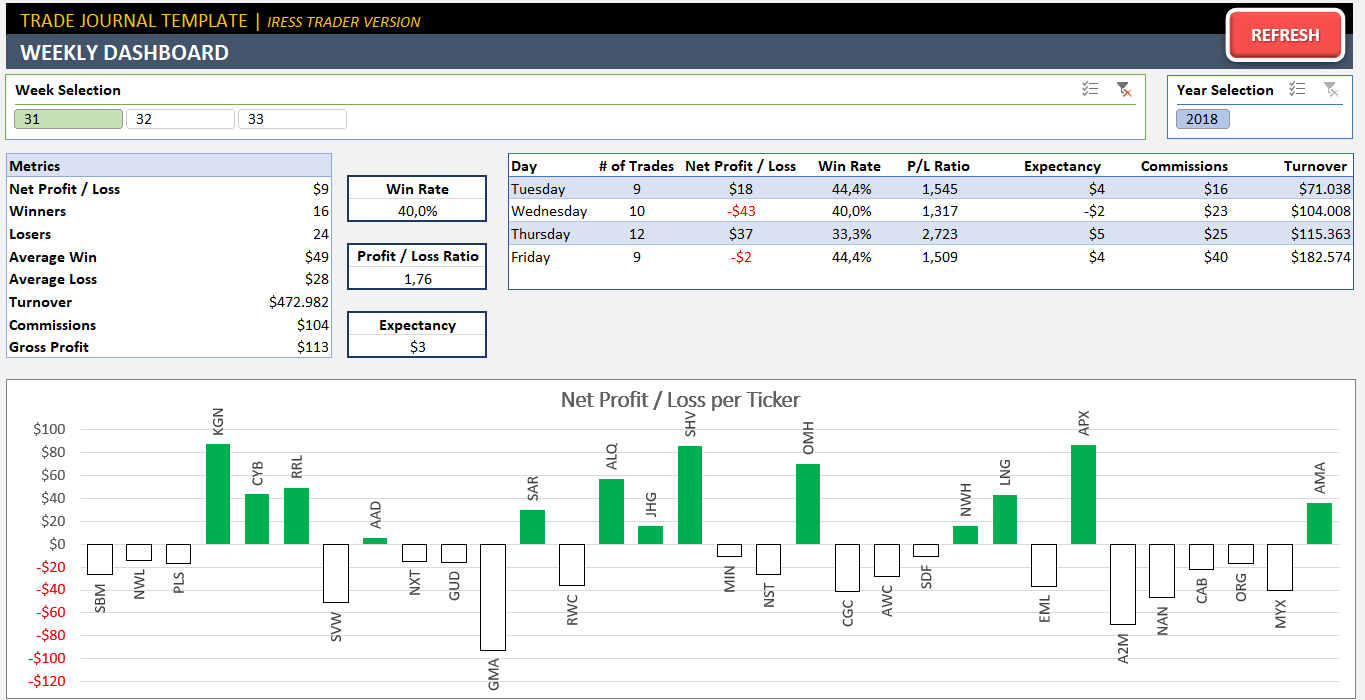
It has a Raw Data section for you to enter your trade information manually or export it from the agency software of your choice and paste it. Also, it has a Trade Log section in which the data from the Raw Data section is fed and analyzed for you. If you want to look at your daily, weekly or monthly transactions, Weekly & Monthly Dashboard provides you the ability to see the big picture of your trades. If you want to also look at the detailed metrics of your transactions, you can do that as well in this section! The All Trades Dashboard section shows you the net profit and loss (with your cumulative net profit or loss).
Besides the trade journal definition, if you want to learn more about this template, please don’t forget to watch our tutorial video:
The template itself is highly customizable and offers some incredible visual graphs and charts for you to clearly look at your trades’ analyses. Unlike its online competitors, it works like a built-in tool in Excel; there is no need for installation of complicated software. And also, it is compatible with both Mac and Windows devices.
How Can You Calculate Your Trading Profit and Loss in Excel?
This process basically uses this logic. If you deduct the cost of your trade from the profit you made, that is your gross profit. The logic is fairly simple; however, this process gets a little bit complicated when the amount of money you spent on buying a stock fluctuates. In addition to the trade journal definition above, an example can help you to understand this concept better:
Let’s say you are investing in a stock called X. In your first transaction, you bought 10 X stocks and you paid $5 for each of them. Then in your second transaction, you bought 20 X stocks; however, you paid $8 dollars for each of the stocks. The question is this: If you sell these 30 X stocks, each for the price of $7.5, would you be able to make a profit out of it?
In order to answer this question, you can use the Weighted Average or Weighted Sum mathematical method. You can calculate the average price of the X stock and compare it to your $7.5 sell. Let’s do the math: (10 x 5 + 20 x 8) / 30 = 7.
This means the average price of the X stock is $7. By comparing to your selling price of $7.5, you can clearly see that you will make a profit from your X stock purchase.
Keeping Track of Your Stock Trades:
Creating and consistently using a trading journal is the essential way to keep track of your stock trades. By storing all of your buy-sell information, tracking financials, it also balances your risks. While you plan your future decisions according to analyses, you can also manage the risk in your trading. Therefore, a trading journal is not only for tracking your stock trades but also for improving the risk management in your trading as well.
Microsoft Excel enters the picture when you export your trades data from your broker or agency software. These programs provide you with your data in the .csv, .txt or sometimes even in the .xls (or .xlsx) format. You can gather up this raw data and paste it into a spreadsheet in Microsoft Excel. And then, all you have to do is follow the steps provided to you above in the previous chapters. It is completely up to you how a detailed or a basic trading journal you want to create. You can use Excel in order to create a simple analysis with a pivot table on how much profit you made from your trades. On the other hand, you can also create a detailed framework featuring all the metrics mentioned in this blog post.
FINAL WORDS
This post explains the trade journal definition and shows how to create your own.
If you do not want to spend that much time creating your trading journal, you can always use a template. These templates (such as Trading Journal) go through these steps themselves instead of you. The template creates the formulas, applies them to your raw data, creates an analysis and inserts customizable charts. You can save time, sit back and watch the trading journal template work its magic in Microsoft Excel!
Recommended Readings:
Related Posts


