Break-Even Analysis in Excel: Comprehensive Guide to Calculate your Break Even Point
Here’s a comprehensive guide to discover Break Even Analysis Excel formula, method and examples.
Table Of Content
1. What is Break-Even Analysis?
2. Components of Break-Even Analysis
3. What’s the Break-Even Analysis Formula?
4. How to Calculate Break Even Analysis in Excel?
5. When will you use Break-Even Analysis?
6. How to Lower Your Break-Even Point
7. The Benefits and Limitations of the Break-Even Analysis
8. Conclusion
Of course, every business goal is to make a profit. But the first step into generating revenue is earning as much as you have spent. You have to get to the point that you have covered your costs and you are not going to fail in this business. You need to break-even. Then, and only then, you will be able to make a profit. In order to realize and figure out if you can or did break even, you need to conduct a break-even analysis.

Let’s get into what exactly is the break-even analysis, which components does it consist of, and what is the basic formula for the analysis.
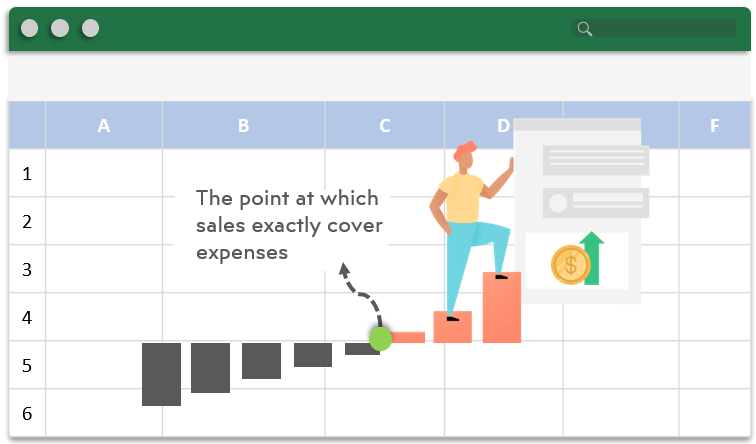
1. What is Break-Even Analysis?
This type of analysis became basically a financial tool in order to determine if a service or a company could be profitable for the company. The results of this analysis show the number of sales your company has to, first, break-even and then, make a profit.
Keep in mind that ‘breaking even’ and ‘making a profit’ are not the same things. If you are in a situation where you broke even, you did not make any money. On top of that, you did not lose money during this endeavor. Your sales only equaled your overall costs. We’ll try to demonstrate this with Excel break even analysis.
And ‘making a profit’ is what your business makes on top of your break-even point. You cannot start making a profit from your services or products before you have reached the break-even point. Calculations, accounting processes, and financial decisions must be taken for both of the situations. Additionally, every little cost, as well as every dollar your make, should be taken into account.
2. Components of Break-Even Analysis
If we are talking about profitability, we should take into account many elements and build our analysis on a multi-component structure.
But, what are the main components of the break-even analysis?
- Fixed costs
- Variable costs (Semi, Direct and Indirect Variable Costs)
- Revenue
Let’s check them one-by-one:
Fixed Costs
Fixed costs are each individual spending that stays largely the same. No matter the level of production you have and no matter the quantity of your output is, your fixed costs will be mostly unaffected.
Fixed costs are among the manual inputs for your Excel break-even analysis.
What are the examples of fixed costs?
- Taxes
- Interest (for investments, loans, etc.)
- Salaries of employees
- Rent
- Bills (energy, water, food supplies, etc.)
- Marketing and advertisements
- Research and development
- Administration and management
In time, the fixed costs can increase or decrease depending on the economy and the GDP of the country that the organization is located.
On the other hand, these costs can also change situations related to investments. For example, building an additional facility, renting a warehouse, or hiring more employees can be regarded as an expansion of fixed costs.
Variable Costs
Variable costs are directly related to the level of production. These costs are affected depending on the output level of the products. These variables also separate in themselves as “direct variable costs” and “indirect variable costs”. Before explaining the difference between the two; first, let’s give some examples for general variable costs.
What are the examples of variable costs?
- Raw materials
- Manufacturing costs
- Processing costs
- Packaging costs
- Fuel (for transportation or for machinery in factories)
- Commissions or payments for intermediaries
a) Direct Variable Costs:
These types of variable costs are the expenses in a straightforward connection with the volume of production. If the level of production increases, then the direct variable costs rise as well. And if the production level decreases, then the direct variable costs will diminish.
So, you can easily track this with your break even analysis in Excel.
For example, an increase in the number of raw materials and the energy that the machines run in will directly affect the increase in costs.

b) Indirect Variable Costs:
These types of costs are not directly caused by the level of production; however, they can alter due to the change in the output volume. These costs can include the maintenance of the machinery, care and cleaning of the facilities, and labor costs.
c) Semi Variable Costs:
Now, these are the ones in between. They are somewhat fixed in nature and paid no matter what but at the same time, they can increase if the business grows enough.
Let’s give some examples: If you are a local clothing store or you have a small number of shops around a small area, you might not need to spend money on transportation. However, if your business is doing well and you want to expand to other areas. As your business grows, you need to invest in additional departments, the extra number of employees, warehouses for more storage and also, transportation (which you did not need when your business was smaller).

3. What’s the Break-Even Analysis Formula?
So, before diving into Excel break even analysis, let’s look at the basic formula for the calculation and its components.
This formula below calculates the number of units or products to need to sell if you plan on breaking even:
Break-Even Point:
The break-even point (or BEP, in short) is the result that the break-even analysis calculates. It is an overview of your business. It shows how your company can break even and also can make a profit while looking at the fixed costs and the contribution margin.
Contribution Margin:
This component of the formula is actually another formula in itself:
As you can see from the formula, it actually represents an excess of money. If you deduct the variable cost per unit from the sales price, you can calculate y what you earn from each of the units (products). It is what is leftover from each unit after they are sold (or potentially sold). The contribution margin can also be called ‘unit margin’ as well.
Break Even Calculation Example:
A restaurant that is serving food, no matter how big or small it is, is going to have different types and amounts of costs from a technology company specialized in mobile apps.
So, let’s look at a small example so that it would be basic enough. Let’s start with a small restaurant that only sells tacos:
Calculating variable costs:
First, you need to calculate its variable costs. For that, you need to dissect and list the prices of each item per meal. The restaurant has delicious chicken tacos, so let’s look at the ingredients that make them:
- Tortilla: $0.30
- Chicken: $0.70
- Canola (frying) oil: $0.50
- Tomatoes: $0.50
- Cheese: $2.00
If you add up all the items, a single taco’s variable cost comes up to $4.00.
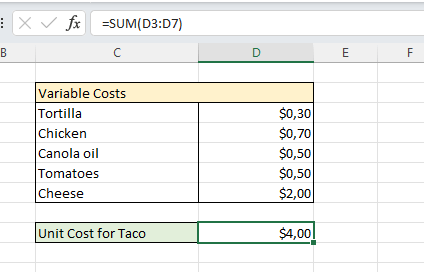
The owner of the restaurant has to sell each taco for a price higher than $4.00 in order to make a profit out of them.
Calculating Fixed Costs:
Now, let’s examine the fixed costs of the restaurant:
- Salaries of the employees: $1,000
- Rent: $2,000
- Utilities: $500
- Advertisements (such as leaflets, local tv or newspaper ads): $500
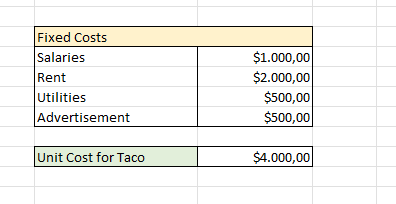
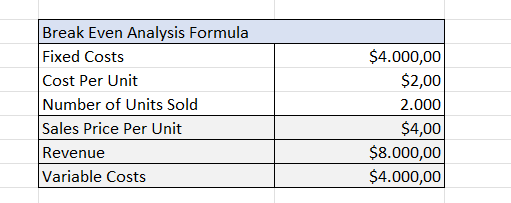
The total fixed costs of the restaurant come up to $4,000.
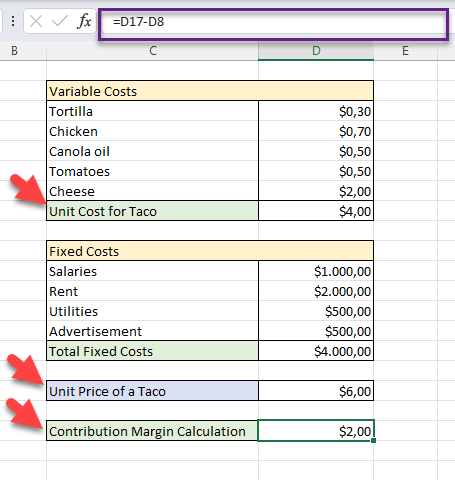
Calculating Contribution Margin:
Now, you need to calculate the contribution margin (which is the sales price of a taco minus the variable costs of a taco). The owner of the restaurant priced the tacos at $6. Therefore, the contribution (unit) margin comes up to $2.
Calculating Break-Even Point:
Now, you have to figure out the break-even point, how many tacos does the restaurant has to sell in order to cover all of its costs:
$4,000 / $2 = 2,000
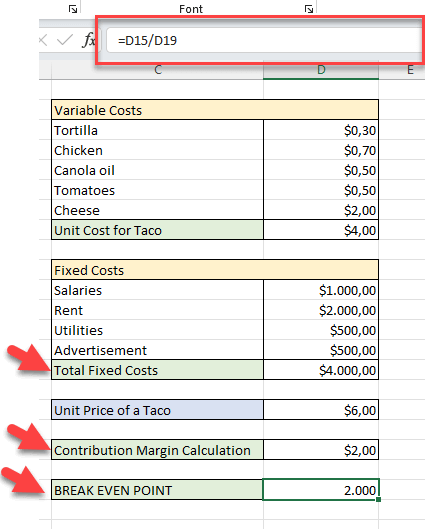
Only to cover its monthly fixed costs, the restaurant has to sell 2,000 tacos. And thus, the break-even point for the restaurant is calculated at 2,000.
Recommended Reading: How to Make a Financial Plan in Excel Before Opening a New Restaurant
Of course, as it was mentioned in the previous chapter of this blog post, as the business grows, you need to invest more in the business as well. So, you have to always know and keep track how much you are spending and for what you are spending that amount.

4. How to Calculate Break Even Analysis in Excel?
Firstly, the written formula can be quite confusing, even if you have the numerical data to put together. An example might help you figure out your plan and strategy as well. However, keep in mind that every industry is different.
So, there are four ways to calculate break-even analysis in Excel:
- Goal Seek Function
- Using Formulas
- Calculating break even point with charts
- Someka Break-Even Analysis Template
Let’s look at them one-by-one:
4.1. Excel Break Even Analysis with the Goal Seek Function
First of all, the Goal Seek feature is among the Excel’s built-in data analysis tool, and now we’ll use this tool to calculate our break-even point:
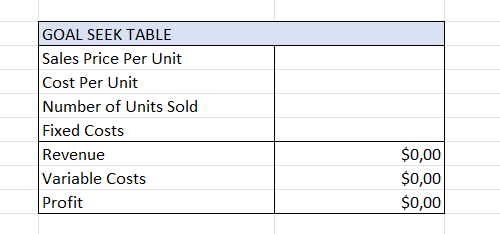
Step 1: Preparing your data
You will need the sales price per unit, the number of units sold, the cost per unit, and the fixed cost information in order to conduct this process.
Gather up all the data, create a basic table, and put them on a list. Also put the revenue, variable costs, and profit cells; but leave them empty because you are going to calculate them as well.
Step 2: Calculations
In order to calculate them apply these formulas:
- For calculating Revenue = Sales Price Per Unit * The Number of Units Sold
- For calculating Variable Costs = Cost Per Unit * The Number of Units Sold
- For calculating Profit = Revenue – Variable Costs – Fixed Costs
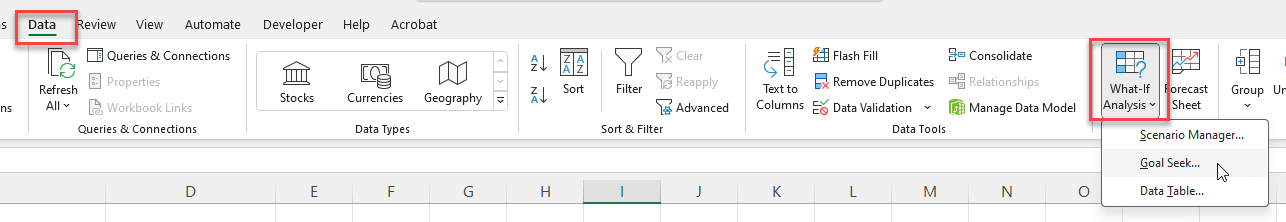
Step 3: Start Goal Seek Analysis
After you have filled the table you have made with the information you calculated, click Data from the toolbar. Select What-If Analysis and click on Goal Seek.
Step 4: Goal Seek Options
The Goal Seek option will open up a window and you will be entering the cell numbers.
- Enter the cell number for your Profit in the Set cell
- Enter 0 in the To value as
- Enter the cell number for your Sales Price Per Unit in the By changing cell
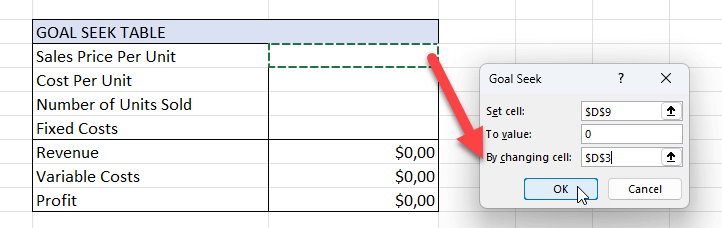
Click OK now.
Step 5: Approve the goal seek solution
Another window will appear to show you the information you have entered as the Goal Seek Status box.
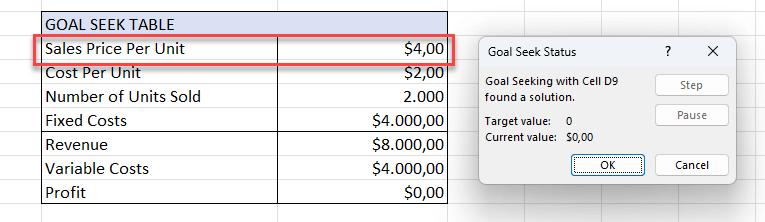
Check the data and click OK again.
4.2. Excel Break Even Analysis with Formula
Secondly, you can use the formulas below in order to calculate the sales price per unit, revenue, and variable costs:
- For calculating Sales Price Per Unit = Fixed Costs / The Number of Units Sold (and) + The Cost Per Unit
- For calculating Revenue = Sales Price Per Unit * The Number of Units Sold
- For calculating Variable Costs = The Number of Units Sold * Cost Per Unit
4.3. Excel Break Even Analysis with a Chart
Also, you can create break even analysis chart to find your exact profitability turn point. This strategy of calculating the break-even point actually consists of many steps for you to follow closely and carefully in Excel. It includes Legend Entries (Series) section and editing Horizontal (Category) Axis Labels.

Thus, you can use this technique if you want to start from scratch. And from scratch means by manually putting every piece of information and one by one selecting them to create a line graph.
You can choose to use this complicated way of performing a simple break-even analysis and spend so much amount of time.
4.4. Someka Break Even Analysis Template
Definitely, your business’ revenue and cost assumptions construct the spine of your feasibility studies. So we provide you with a ready-to-use tool:
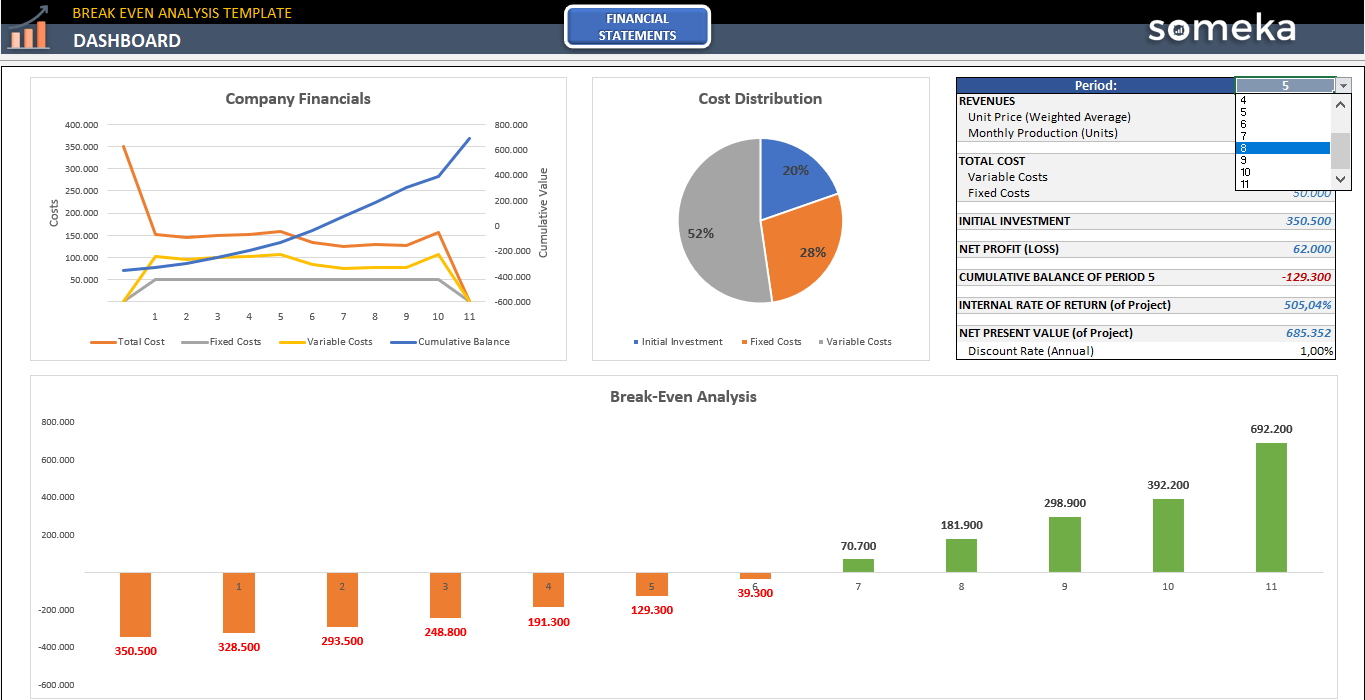
– This is the Dashboard section of Someka Break Even Analysis Excel Template –
The template itself includes two sections:
- Financial Statements
- Dashboard
The Financial Statements section is the spreadsheet you put the numerical data regarding your business. Your revenues, total cost, net (general) profit, and net profit per unit are calculated automatically.
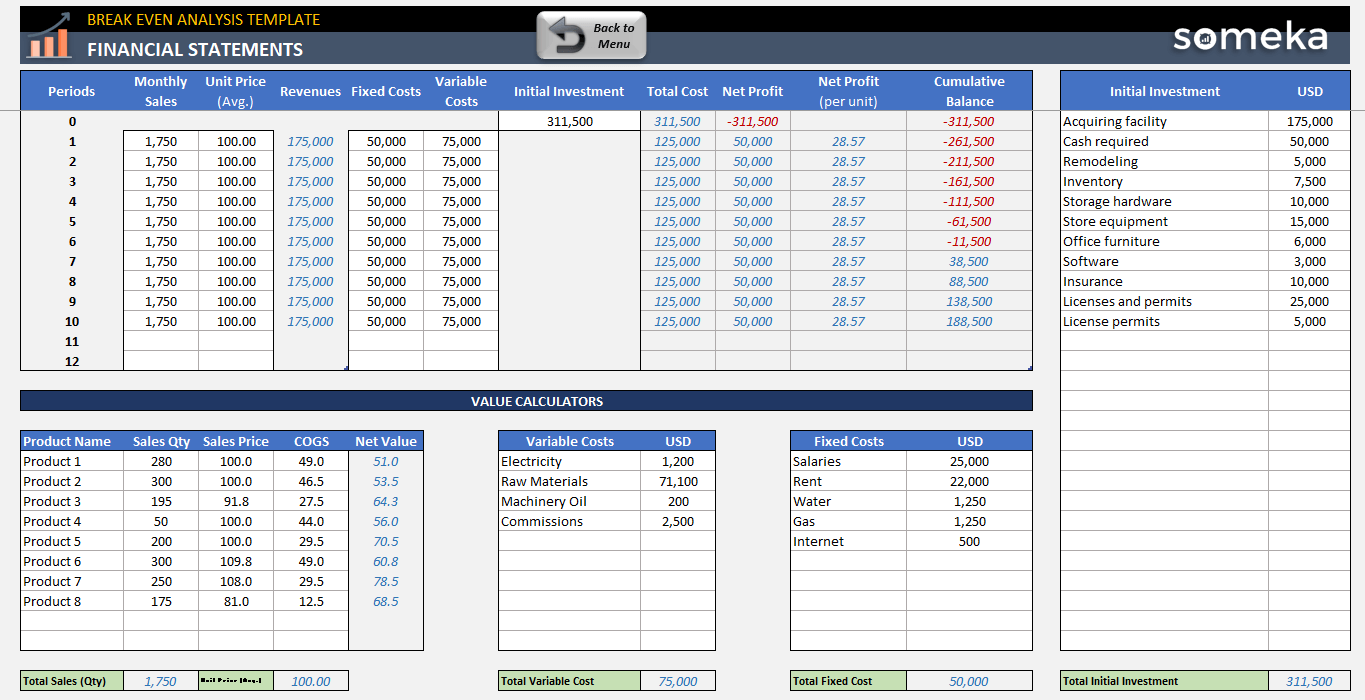
– This is the main input area of Break Even Analysis Excel Template by Someka –
The Dashboard section gathers up all the information you have provided and turns them into visual representations of your break-even analysis for your business. It displays a Line Graph for the general financial details of your organization.
It also visualizes a Cost Distribution Chart which holds the information for Start-up Costs, Fixed Costs, and Variable Costs. And additionally, a Bar Chart to showcase your profit and future financial assumptions.
So, key features of Someka Break Even Analysis Excel Template:
- Ready-to-use
- Professionally designed
- Printable and editable
- Visual analysis
- Instant download
5. When will you use Break-Even Analysis?
If you are a business owner or a manager of a business, there will be countless times that this process will be useful. You are gathering information about how much of your product you need to sell and also what price you need to sell that product in order to break even.
The result of this analysis will provide an overall picture of the finances of your business and your profit margin. So, below are some times that would be best if you consider applying the process of a break-even analysis for your business:
-
When you are making financial plans
Your financial plans and strategies consist of forecasting your costs, profits, expenses, and each loss and gain in general. Therefore, performing the break-even analysis is one of the best first steps you can take when you are establishing your financial plans for your business. The results of these analyses not only help you create a budget for your operations but also keep track of your gains and losses.
-
When you are planning on an expansion of your business
By creating a new service or a product and adding other stores or facilities to your business is an investment. And these expansions deal with -at first- breaking even and covering all the costs via sales. So, the break-even analysis also comes in handy in these situations as well.
-
When you need to adjust your pricing
Product pricing is one of the most important areas that you need break even analysis.
Your services or products might be too expensive or not expensive enough, and both of these situations can cause harm to both your business spending and revenue. You might have to lower your prices in order to stick out among your competitors. These changes in price have to be done by having the results of (at least) a break-even analysis.
-
When you are deciding on the future of your business
If you are the owner or a manager of a business, company, or organization, you will be given the task of answering critical questions and deciding on crucial matters. These overwhelming decisions can become more easily taken if you have the results of a break-even analysis regarding the organization.

6. How to Lower Your Break-Even Point after break even analysis in Excel?
First, let’s explain why it is important to lower your break-even point, before getting into the how.
It is important to lower this point because the lower it is, the easier it gets for you to reach the break even point and therefore, to make a profit.
Now, let’s examine the strategies on how to lower your break-even point:
a) Reducing the fixed costs
You can reach the break-even point and make a profit easier and quicker if you spend less on a monthly basis. Moving to a location where you can spend less on rent, getting rid of unnecessary utility expenses, and removing inadequate employees can diminish your fixed costs and can allow fewer sales to reach your break-even point.

b) Increasing the contribution margin per unit
If you can increase the excess money you get from each unit, you can also lower your break-even point. In order to do that you need to reduce the variable cost per unit. Lesser what you spend per product and keep the sales price the same, so you can lower the break-even point and can make more profit.
c) Increasing the sales price
Sure, it is not the ideal option; but it is still one of the strategies you can lower your break-even point. If you stand by your product and the number of demands would not dramatically change, you can raise the sales price per unit. You can establish campaigns and ‘special offers’ while increasing the sales price, you can introduce new features (which do not cost that much).

7. The Benefits and Limitations of the Break-Even Analysis
The break even analysis is an incredibly useful and helpful tool for the times mentioned above in the previous chapter. However, it does come with its limitations as well. These limitations should not be looked at as ‘harmful’ features of a break-even analysis. These are merely some things the break-even analysis cannot do.
Let’s start with the benefits of it:
Benefits:
- The results of the analysis can provide more information and make it easier to understand that said information, respectively.
- A break-even chart offers the visual representation of the relationship between the costs, level of production, and revenue.
- The analysis helps the management to find the profitability of each of the products and the profitability of the business in general.
- You might miss some of the expenses or just disregard them as unimportant. The analysis can help you gather up every little expense and not miss any of them.,
- The whole concept can help you set targets for revenue.
- The results of the analysis can put crucial and necessary useful data on every decision you make.
- It can help you price your services or products or make correct adjustments for them.
- It gives you complete cost control.
- And perhaps the main benefit, it makes you realize how to cover all your fixed costs.

Limitations:
- Every cost (even if they are fixed costs) can vary depending on the type of business, country, or culture of the business is located or the period of time.
- And there lies perhaps the biggest limitation of the break-even analysis. There is no mention of time anywhere in the analysis and even in the chart version. Even though all the assumptions are made on a monthly basis, you cannot see the weekly fluctuations of the finances, seasonal changes, or yearly updates.
- The other limitation in regards to time is the lack of future considerations. As it was mentioned, you can make forecasts by looking at the break-even analysis. But nowhere in the process does the analysis feature any information about the future. It always deals with expenses and investments for the present moment.
- You cannot figure out the level of demand for your business. It does not include any information about what your sales can be or how many people are interested in buying your product. You only see how it needs to be in order to break even.
- It is a fairly simple formula and a concept. It is not quite comprehensive; therefore, you should not expect detailed and extremely informative results.
- The break even analysis shows you the costs and the potential revenue of your products and your business. There is no mention of any competitors or competitions between your competitors in regards to the sales price, unit cost, revenue, or size.
8. Conclusion
Brea-even analysis is one of the first techniques to perform in financial analysis. As it’s a quick and simple method, all size of businesses make break even analysis to find their profitability point.
And, Excel is the most common spreadsheet for this kind of financial calculations. In this article we have summarize the concept of break-even point and explain break even analysis in Excel with different methods. Also, you can download the free template for break even analysis for a more quick, easy and professional solution.
Recommended Readings:
How to Create a Profit and Loss Statement in Excel? Step-by-Step Guide
Related Posts


