How to Make a Balance Sheet in Excel? Detailed guide to understand financial statements
In this article we’ll explain how to make a balance sheet in Excel with a detailed guidance and also information about balance sheets.
Table Of Content
1. Free Balance Sheet Template in Excel
2. What’s a Balance Sheet?
3. What are the Main Sections in a Balance Sheet?
4. How to Make a Balance Sheet in Excel?
5. How to Read a Balance Sheet?
6. Why We Need Balance Sheets?
7. Balance Sheet vs. Income Statement
8. Key Takeaways
1. Free Balance Sheet Template in Excel
If you want to start using a balance sheet template immediately, you can download our Balance Sheet Excel Template from our portfolio.
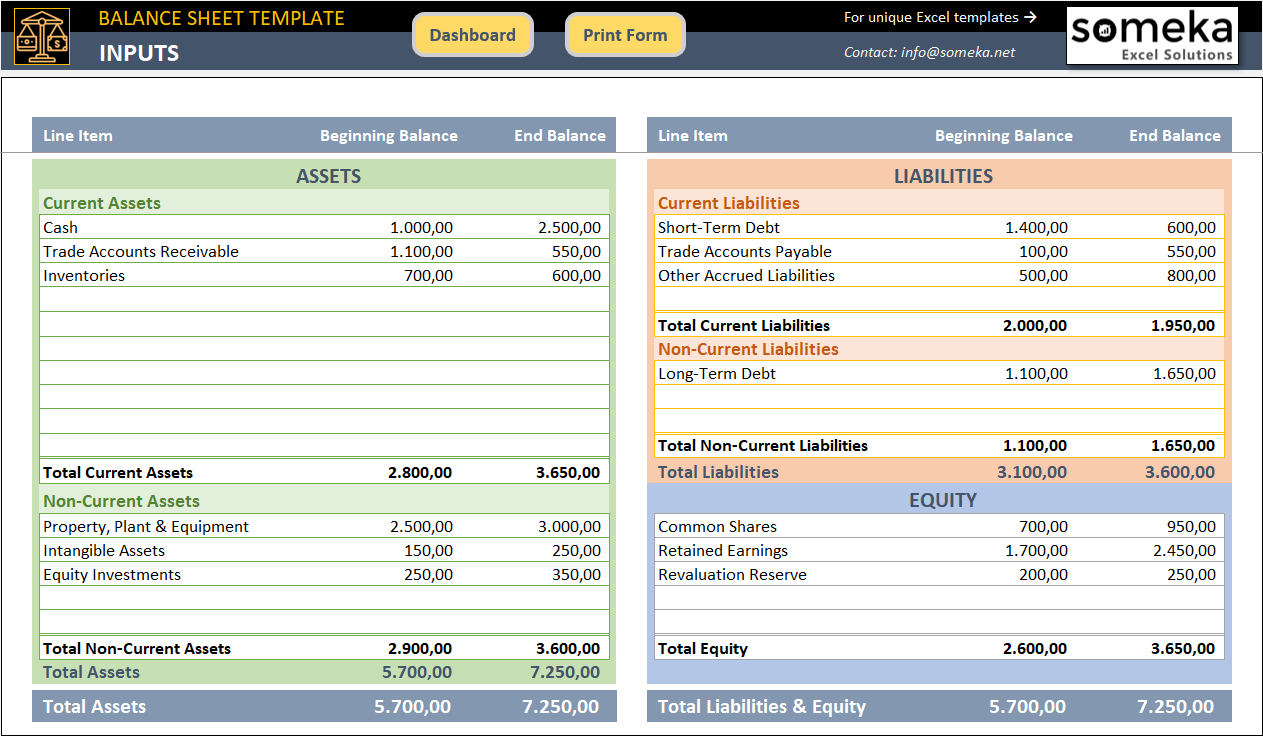
– This is the main table of Someka’s Balance Sheet Excel Template –
This template includes:
- Balance Sheet Input Table
- Balance Sheet Print Form
- Analysis Dashboard
2. What’s a Balance Sheet?
A Balance Sheet is one of the general-purpose financial statements (the other two are the Income Statement and Cash Flow Statement) that companies present to their shareholders. Small and middle-companies do it annually, and bigger ones do it quarterly.
Although unincorporated businesses are not normally required to prepare balance sheets, it is often beneficial to do it. In this article, we will refer to both incorporated and unincorporated businesses as ‘companies’.

A Balance Sheet is a ‘snapshot’ of the company’s financial situation at a certain point in time, normally at the end of the fiscal year. It answers three important questions:
- How much of value the company owns?
- How much it owes to its creditors?
- How much money would left for the company’s shareholders, if the company sells off all its assets, and pays off all its debts?
3. What are the Main Sections in a Balance Sheet?
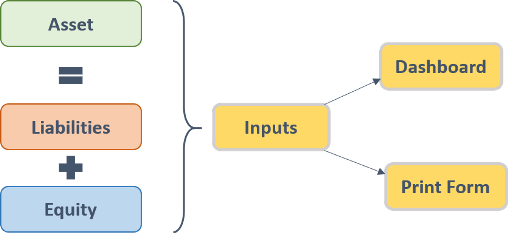
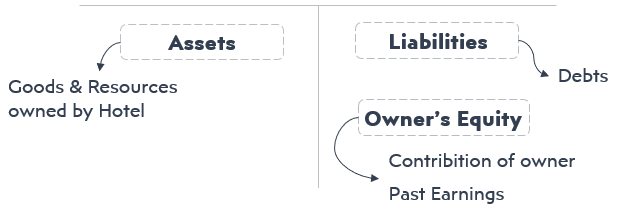
In order to understand the logic of balance sheet, we should first get the main idea of the three main sections: Assets, Liabilities and Equity
Assets:
Things of value that the company owns are called Assets.
Although most assets are tangible, certain intangible items, such as, for example, money owed to the company by its customers, are considered assets, as long as it is probably that the company will be able to collect them from the debtors.
These are typical examples of assets:
- Cash: petty cash, money in bank accounts, short-term certificates of deposit;
- Accounts Receivable: money to be received from customers for goods sold or services provided by the company;
- Inventory: merchandise, goods manufactured for sale, materials;
- Prepaid Expenses, for example, rent paid upfront;
- Fixed Assets: property, machinery and equipment, trucks, cars and vans, and similar valuable long-term items.
Depending on the nature of their business, some companies may hold other classes of assets as well (marketable securities, financial investments, intangible assets, work in progress).

Liabilities:
Money that the company owes to its creditors is called Liabilities.
Liabilities may arise from formal agreements, statutory requirements, or business customs and usual practices, as long as it is probably that the company will be required to spend money to settle the liability.
Typical examples of liabilities are:
- Accounts Payable: money owed to the company’s suppliers for goods and services purchased from them;
- Loans repayable, and interest payable on them;
- Wages and salaries payable;
- Taxes payable;
- Prepayments received from customers.
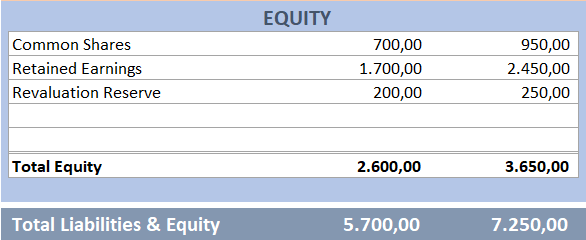
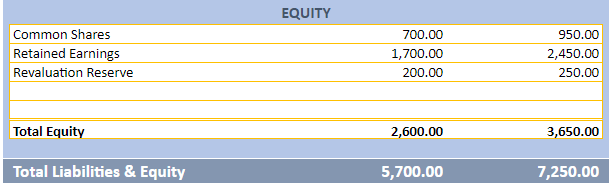
Equity:
What is left of the company assets’ value after deducting liabilities is called Shareholder Equity. Sometimes it is referred to as Net Assets.
Although Shareholder Equity is a residual value, it is also broken down to several items. Typically, it encompasses the following:
- Share Capital: money paid in by the shareholders in exchange for equity shares. In the case of the sole entrepreneurship, it is money provided to the business by its owner;
- Retained earnings: earned net profit not yet distributed to shareholders;
Shareholder Equity may include other items as well, such as revaluation and other reserves, and additional paid-in capital.
4. How to Make a Balance Sheet in Excel?
Normally, it is your accountant or bookkeeper who should prepare a balance sheet for you. However, if you are an owner of a small business, in most cases you will be able to do it yourself.
Step 1: Determine a reporting date
Except for rare special cases, financial statements must be prepared at the end of the last day of your fiscal year.
You probably will be preparing the balance sheet in some time after the reporting date; however, you must present the items as they existed at the reporting date, not at the date when you are preparing the statement.
Step 2: Write down all your assets along with their values
If you maintained regular records, you can simply take respective figures from your books. Even if you did not, you still should be able to list your assets, and assign values to them
Value your inventory at the price you paid to buy them, or, if you are unable to trace back the purchase, at the price you would have paid to purchase such items. However, you should not value fixed assets, such as machinery, equipment and motor vehicles, at the purchasing price.
Because these items gradually lose their value over time, due to wear and tear, and obsolescence, value them at the price you would be able to sell them for in present condition.
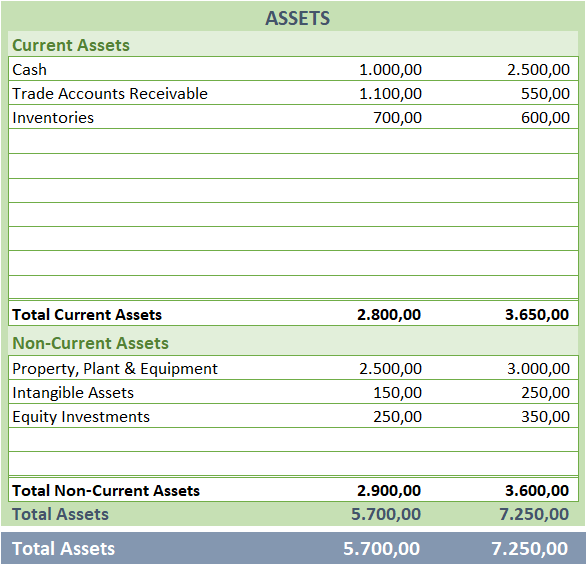
Sort all your assets into two categories:
Step 3: List all your obligations that existed at the reporting date
Although it may seem quite straightforward, there are traps that you ought to avoid. Do not forget to include in liabilities taxes which are payable in arrears.
For example, sale tax or income tax resulting from your operation prior to the end of the reporting period are normally payable after the reporting date. Nevertheless, you must include them in liabilities at the date of the balance sheet.
Similarly, wages that were paid shortly after the reporting date still must be presented in liabilities at that date.
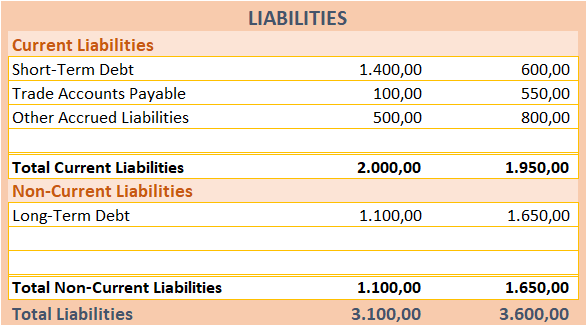
Similarly to the assets, sort all your liabilities into two categories:
Step 4: Calculate total value of all assets and liabilities
If you put them into Balance Sheet Excel template, it will be done automatically. A difference between total assets and total liabilities provides a value of Shareholder Equity.
Although you may stop at this point, it is advisable to break down Shareholder Equity into specific items.
At very least, you should separate invested owner capital from retained earnings to see whether, and how much, the company’s capital increased over initial shareholder investment.
Step 5: Make a printable form
You’ll need a sleek-design Balance Sheet Statement to share with company stakeholders, board members, lenders, authorities, or other third parties.
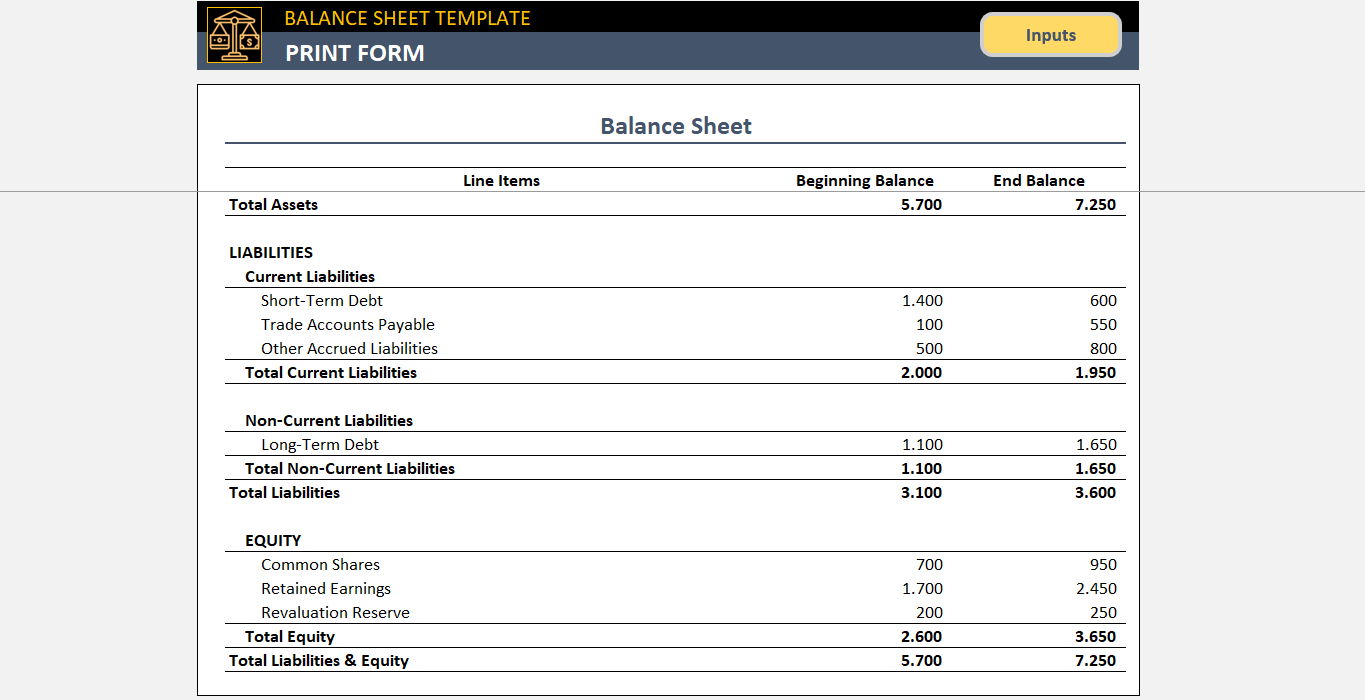
– This is from Balance Sheet Excel Template by Someka –
The values on this printable form are all coming from the balance sheet input table. This is mostly an outcome of your financial numbers.
5. How to Read a Balance Sheet?
As we have said, a Balance Sheet is a valuable source of information about the company’s financial situation.
The reading of financial statements may differ from company to company.
We have listed below some very common key points, but we also recommend you to check your industry benchmarks while analyzing any financial data.
Shareholder Equity
First, look at the Shareholder Equity value. It must be positive, and ideally more that the value of shareholder investments (the sum of common shares and additional invested capital). If it is less, it may be due to accumulated losses, or over-distribution. In such a case, you should decide whether additional investment is necessary to cover the losses. In some cases, there may be legal obligation of shareholders to compensate the company for over-distribution.
However, if Shareholder Equity becomes negative, it means that the company cannot repay all its debts using existing assets, and will soon go bust, unless the shareholders put in additional money to keep the company afloat.
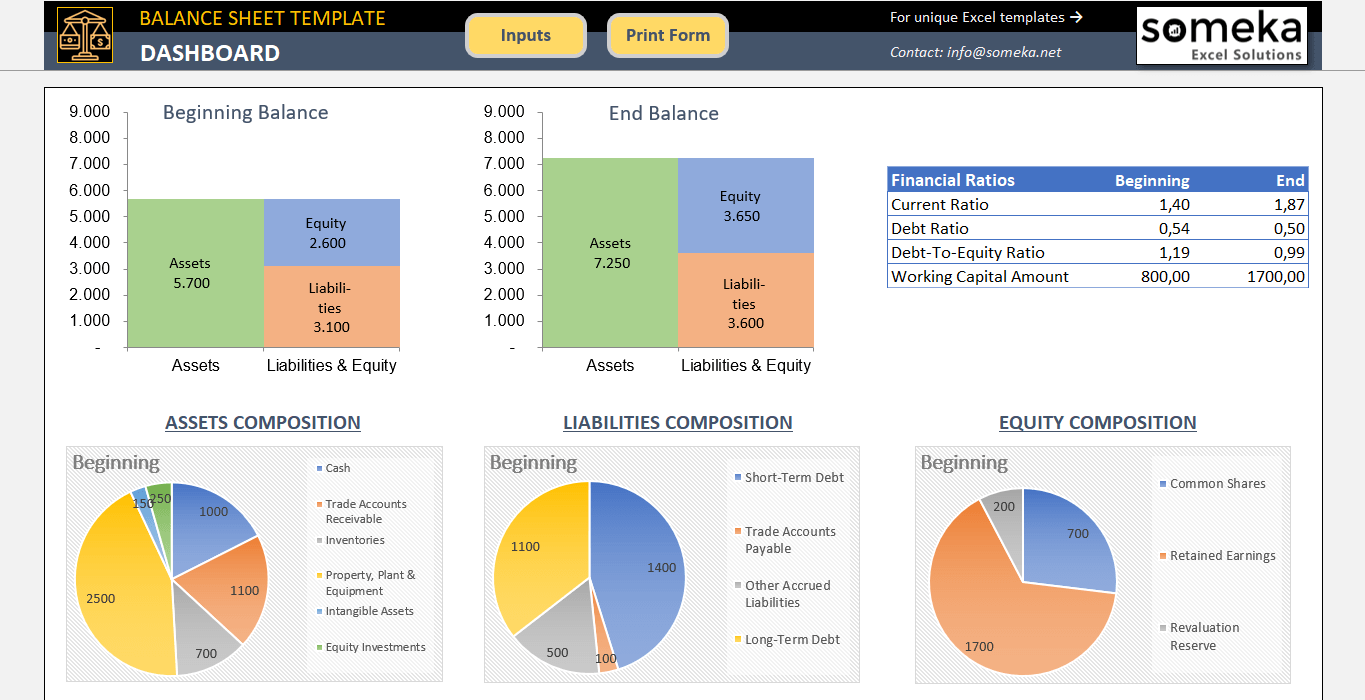
– This is the Dashboard of Someka Balance Sheet Template with auto-calculated analysis and ratios
Current Ratio
Next, look at the metric called the Current Ratio. Divide total value of current assets by the total value of current liabilities.
This ratio should be more than 1, ideally 1.2 or more. It means that the company is liquid, i.e. well able to pay their short-term obligations out of existing current assets.
If Current Ratio falls below 1, the company, though not outright insolvent, experiences difficulties in paying their current debts. However, too high ratio is not very good either. The Current Ratio exceeding 3 indicates that the company holds excessive assets that most probably are used inefficiently.
Debt Ratio and Debt-To-Equity Ratio
Next two metrics are the Debt Ratio and the Debt-To-Equity Ratio, both indicating degree of financial risk associated with using debt for financing the company’s operation.
The Debt Ratio shows what share of the company’s assets is financed by debt; normally, it should be 0.7 or less, but this may vary for different industries. The Debt-To-Equity Ratio shows how heavily the company’s financial position is leveraged, i.e. how much of debt, as compared to equity, the company uses to finance its operation.
Acceptable financial leverage for most industries varies from 60/40 (Debt-To-Equity Ratio 1.5) to 70/30 (Debt-To-Equity Ratio 2.33), and may be even 80/20 (Debt-To-Equity Ratio 4) for capital-intensive industries such as development.
6. Why We Need Balance Sheets?
As a business owner, how can you benefit from having a balance sheet prepared on a regular basis?
- Firstly, it provides you with a quick snapshot of your business’s net assets, i.e. how much you own, and how much you can pay to yourself as dividends.
- Secondly, it is easy to evaluate from balance sheet important financial metrics, such as Current Ratio and Debt (Debt-to-Equity) Ratio, indicating how healthy financially your business is.
- Thirdly, by comparing balance sheets at different reporting dates you will be able to detect trends in your business and take timely action, if necessary.

7. Balance Sheet vs. Income Statement
As balance sheets and income statements are usually mixed up, we want to include a separate section here.
What is the difference between the Income Statement and Balance Sheet?
Both are so-called general-purpose financial statements, i.e. standard financial statements intended primarily for a company’s shareholders. This is the only similarity though.
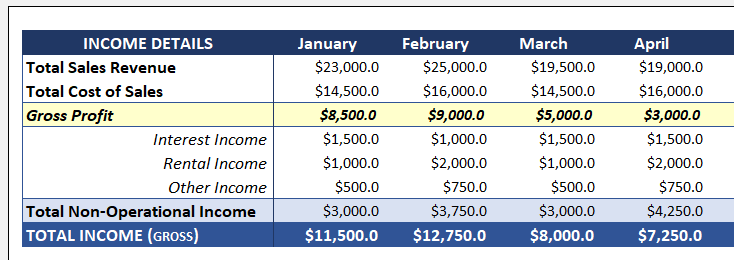
While a Balance Sheet is a snapshot of the company’s financial position at a certain point in time called the reporting date, an Income Statement helps us to understand what happened to the company between successive reporting dates. It answers the following questions:
- How much of sales revenue and other income the company earned between two reporting dates (this is called the reporting period);
- How much of cost associated with sales of goods and services the company incurred during the reporting period;
- How much other expenses, such as general, administrative, and marketing expenses the company incurred;
- How much it cost for the company to pay for its debt (interest expense);
- What is the gross profit before tax, how much of income tax the company paid, what is its net profit that can be distributed to the shareholders, or used to expand its business.
Both the Balance Sheet and the Income Statement are widely used by financial analysts to assess how robust the company’s business is. If you only want to track some of your income and expenses, then you may use specifically prepared templates.
How do you prepare an Income Statement from a Balance Sheet?
You cannot. This is because of the different nature of both statements, as discussed above.
If, for example, you look at two pictures of the same person, ten years between them, you definitely will be able to tell certain changes. However, it is not probably that you will be able to say definitely what happened to that person during that time.

The same with financial statements.
Let’s explain this with an example:
Suppose, accounts receivable, as shown in the balance sheet at the previous reporting date, were $1000, and now they are $500. Can we learn anything from these figures? No, because there could be a number of scenarios leading to the same outcome. These are just a few of them:
- The company sold nothing, but collected $500 from its customers;
- The company sold nothing, and wrote down $500 of uncollectable receivables;
- The company sold goods worth $500, and collected $1000 from its customers;
- Turn on your imagination to produce more.
Where profit and loss show in the Balance Sheet?
A Balance Sheet shows accumulated annual profits and losses in a single position called the Retained Earnings, which is part of Shareholder Equity.
Each time a company gets profit, it increases the balance of retaining earnings in the Balance Sheet by the amount of net profit, less distribution to shareholders.
Each time a company incurs loss, it decreases the balance of retaining earnings in the Balance Sheet by the amount of the loss.
How do you record loss in the Balance Sheet?
It is simple. Loss is presented as a negative amount in place of profit. However, if you previously recorded positive retained earnings, it will become negative only after losses completely offset accumulated profit. Diminishing balance of retained earnings in the Balance Sheet may indicate that the company incurs a loss; however, it may be due to the distribution of previous years’ profit as well.
Is the Balance Sheet prepared first?
It depends.
Nowadays, most businesses, even the smallest, use accounting computer software to keep their records. If all transactions are registered correctly and timely, a full set of financial statements can be produced by the software instantly.

In the past, however, many small businesses, especially those relying heavily on cash transactions (small groceries, pubs, etc.), only kept records of cash receipts and payments. Probably, some of them still do. To properly calculate their net earnings, they needed to adjust cash receipts and payments by the change of inventory balances during the reporting period.
Thus, they made a count of their inventories at each reporting date, and then those numbers went into the calculation of profit. Therefore, yes, they needed to prepare a balance sheet first.
8. Key Takeaways
In this article, we have explained how to make a balance sheet in Excel with step-by-step guiding. Furthermore, we give business insights to help you understand the real nature of the balance sheets. And lastly, we have also made a comparison between balance sheets and income statements.
Here are the key takeaways:
- Balance Sheets are picture of your financial state at a certain point of time.
- Microsoft Excel is maybe the best tool to create balance sheets
- You can create balance sheets in Excel with calculations and formatting
- Using a ready Balance Sheet Template will save you time and energy
Recommended Readings:
How To Create a Cash Flow Statement in Excel?
How to Create a Profit and Loss Statement in Excel? Step-by-Step Guide
20 Most Asked Excel Job Interview Questions for Financial Analysts
Related Posts


