26 Most Important R&D KPIs and Metrics
If you want to accurately measure your Research and Development performance but don’t where to start, we collected all the necessary R&D KPIs and metrics for you!
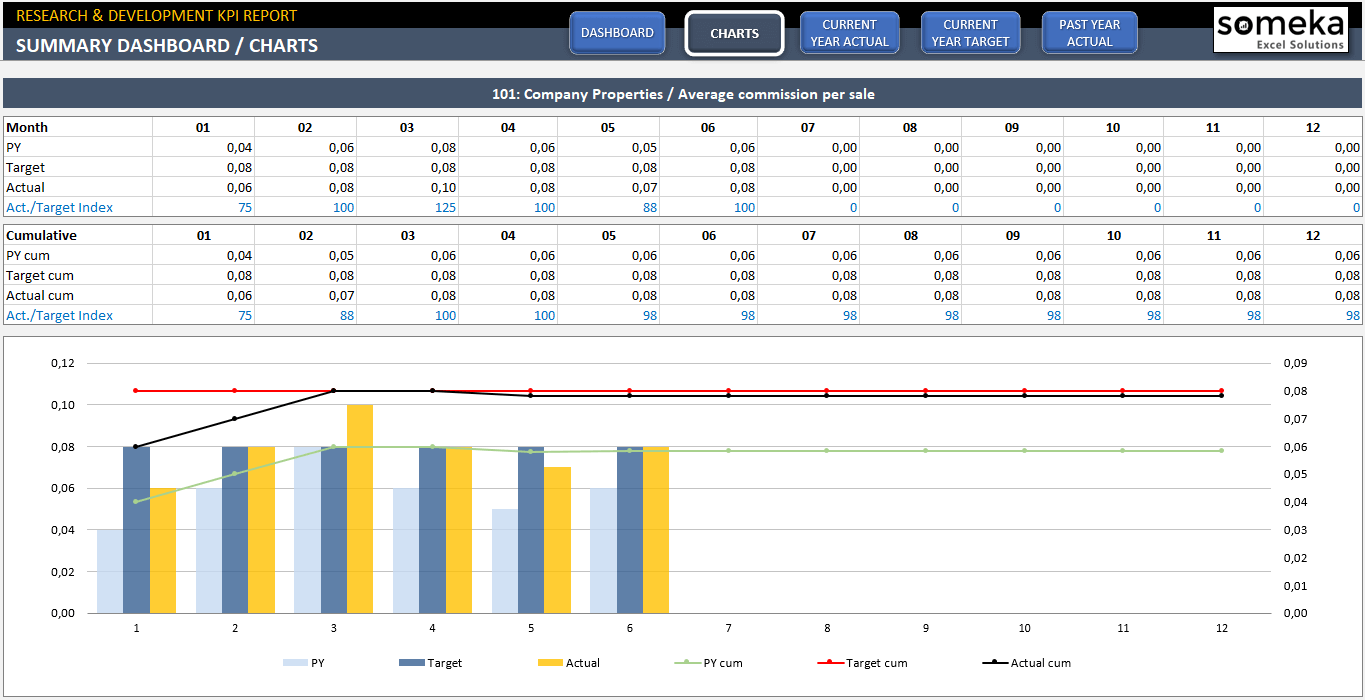
Also, we are proud to present our R&D Dashboard templates if you need to make the analysis and recording within you Research and Development department. But first, you can learn more about the R&D key metrics!
What is KPI in research and development?
Research and development KPIs or key performance indicators are used to determine the performance of research and development departments in businesses.
Why should you track r&d KPIs?
You should track research and development key metrics to have a clear point of view about the state of your R&D department. That way, you can improve and anvance your R&D department in an organized manner.
What are the most important KPIs in r&d?
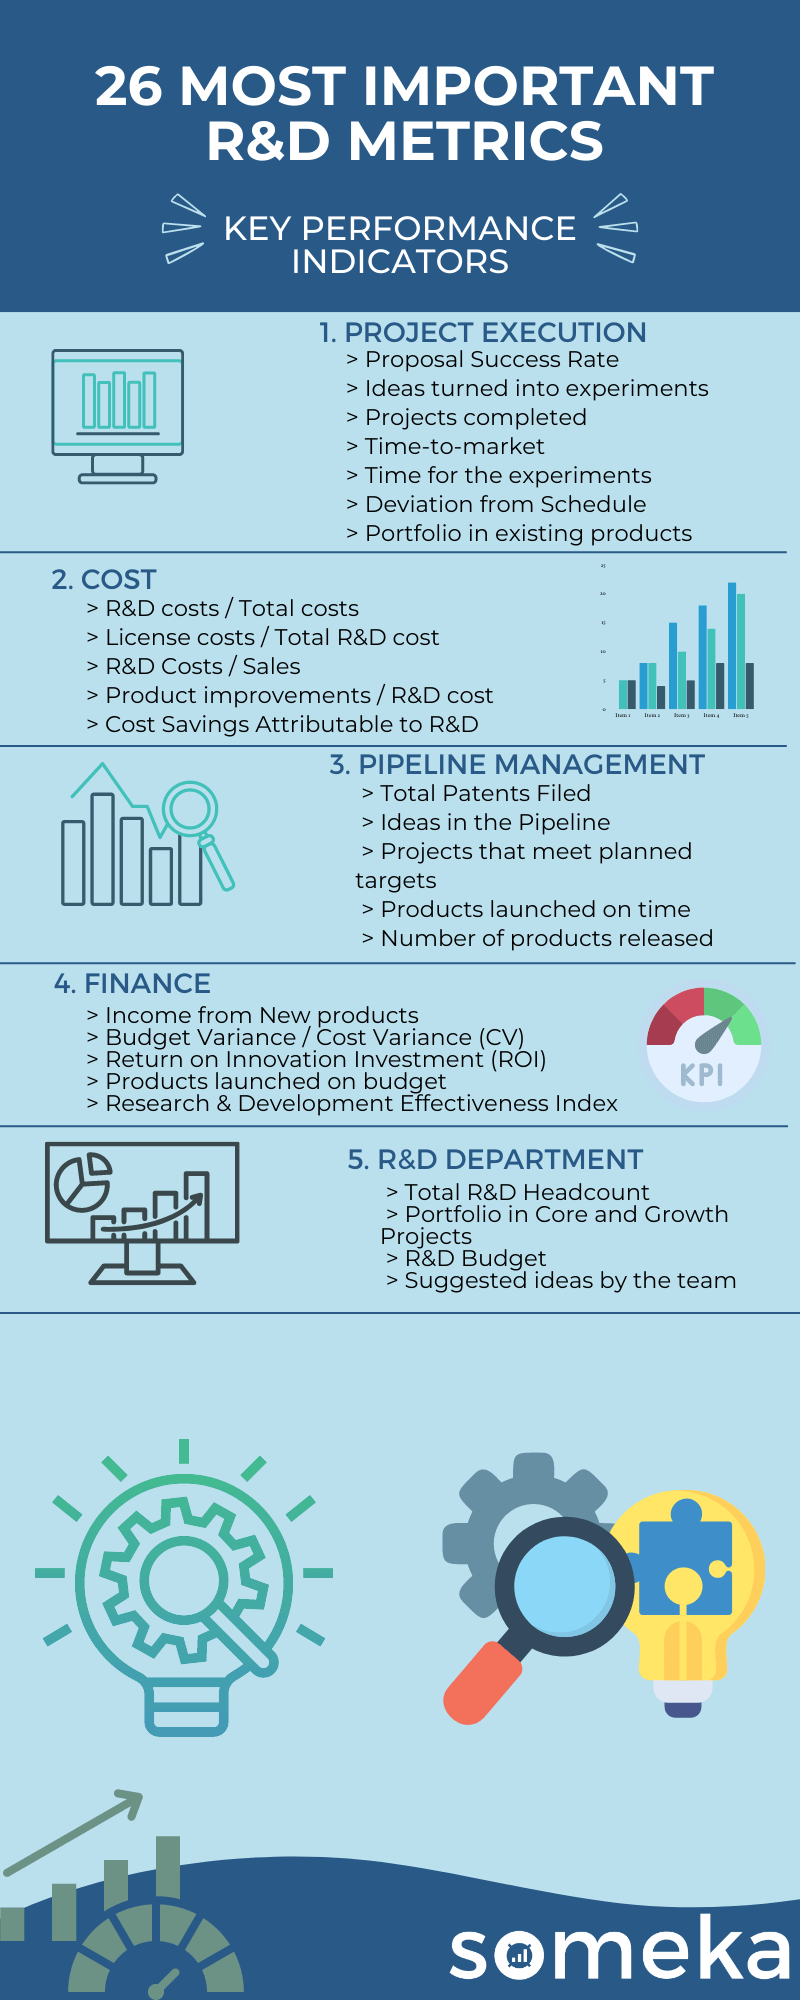
Research and development departments deal with different issues in each other company, so there are various metrics you can use. However, you can see the top 26 research and development KPIs below to get a better idea.
Research and Development Metrics

1. Proposal Success Rate
R&D Metrics / Project Progress / Work Effectiveness
Description:Percentage of grant applications that successfully received funding and can go further with the R&D.
Calculation Method / Formula:number of applications that were accepted and got funds / number of all applications
Should be High or Low?:The higher % the better. Otherwise there is needed extra work time on creating or redefining ideas.
2. Ideas turned into experiments
R&D Metrics / Project Progress / Work Effectiveness
Description:This shows of how many ideas within some period of time went into the experimental phase. It depends on how many ideas there is; has granted funds and if the R&D team is managing the time given properly.
Calculation Method / Formula:number of ideas within some period of time went into the experimental phase / number of ideas that were supposed to be in the experimental phase within specified period of time
Should be High or Low?:If the % is going down it may indicate not enough resources in people or equipment.
3. Projects completed
R&D Metrics / Project Progress / Work Effectiveness / Time Management
Description:Shows the ratio of completed within all started projects. But in case there are some changes, or the grant funds are frozen or for some other seasons the project cannot continue it can have influence on the completion ratio. This metrics allows you to track if you have enough resources and capability to open more tasks and manage to stay on time with the work planned.
Calculation Method / Formula:completed projects / all planned projects
Should be High or Low?:If the % is going down it may indicate not enough resources in people or equipment or some changes in a project or requirement that may close the project not completed.
4. Time-to-market
R&D Metrics / Project Progress / Work Effectiveness / Time Management
Description:This metrics stands for how quickly your company plan and execute the projects. It is the duration from Phase 0 to Market Release. Average number of days per project
Calculation Method / Formula:It can be calculated as simple average: Cumulative number of days of all finished projects / number of projects
Should be High or Low?:If the time to market exceed planned days, it can give some indication about incorrect assumptions or some unexpected problems
5. Time for the experiments
R&D Metrics / Project Progress / Work Effectiveness / Time Management
Description:This is metrics shows time spent only for the experiment phase. That time can be very different depending on a sector of the R&D department. The unit of time may be measured in Days as default, but it can be also adjusted for your needs.
Calculation Method / Formula:cumulative experimental time of number of projects / number of projects
Should be High or Low?:If the time goes over a target this may indicate problems that weren’t predicted in the planning phase.
6. Deviation from Schedule
R&D Metrics / Project Progress / Work Effectiveness / Time Management
Description:This metrics measures how accurate planned project schedules are. And may indicate if there is some need for changing the system of planning or find some bottleneck of the process.
Calculation Method / Formula:(Actual Time to Make – Planned Time to make) / Planned Time to Make.
Should be High or Low?:Based on the equation if the value is below zero it means the projects’ time are overcalculated and probably the time evaluation should be restructured. The same if the value goes above zero but it means the predicted time probably was too small for the available resources.
7. Portfolio in existing products
R&D Metrics / Product Investment / Budget Management
Description:Percentage of R&D Budget which keep the existing products.
Calculation Method / Formula:Cost of sustaining the exisiting products / total R&D budget
8. R&D costs / Total costs
R&D Metrics / Product Investment / Budget Management / Cost
Description:This metrics shows what is the percentage of exactly the R&D cost among Total Costs of the R&D department. (or among total cost of the company)?
Calculation Method / Formula:R&D cost / Total cost of R&D dept.
Should be High or Low?:This is just an orientation information.
9. License costs / Total R&D cost
R&D Metrics / Product Investment / Budget Management / Cost
Description:Shows how big part of Total costs is License Costs.
Calculation Method / Formula:Licence cost / Total cost od R&D dept.
Should be High or Low?:This is just an orientation information.
10. R&D Costs / Sales
R&D Metrics / Product Investment / Budget Management / Cost / Sales / Performance
Description:It shows the ratio between money spend on R&D and the money earned from Total Sales
Calculation Method / Formula:Total R&D cost / Total sales
Should be High or Low?:First of all, R&D cost should not be higher than total sales, but also the higher difference there will be the higher profit will be observed
11. Product improvements / R&D cost
R&D Metrics / Product Investment / Budget Management / Cost
Description: Shows how big part of R&D costs is Product Improvements.
Calculation Method / Formula:Improvement Costs / R&D Costs
Should be High or Low?:This is an orientation information. There might be some target to reduce that cost, but it depends on the characteristics of R&D projects.
12. Cost Savings Attributable to R&D
R&D Metrics / Product Investment / Budget Management / Cost / Savings
Description:This metrics helps to calculate the cost savings because of the R&D Department’s improvements. Cost savings in given period of time.
Calculation Method / Formula:Might be calculated by (time needed to compleete some task before – time needed after improvenents) * workinghour cost in some period of time
Should be High or Low?:Based on that measurement we can measure how long it will take to “pay back” the cost of improvement.
13. Total Patents Filed
R&D Metrics / Cost / R&D Investment / Product Investment / Brand Value
Description:This metrics shows the number of patents waiting to be approved by the patent institution.
Should be High or Low?:If the patents are unique or it is predicted that they will bring income higher than cost of keeping patent itself then the higher number is better but the target should be set based on how much valuable they can be.
14. Ideas in the Pipeline
R&D Metrics / Project Progress / Work Effectiveness
Description:It helps to track the number of ideas that were completed and put in a schedule in an assumed time or period.
Should be High or Low?:Target depends on the R&D sector and taken period of time.
15. Projects that meet planned targets
R&D Metrics / Project Progress / Work Effectiveness / Time Management
Description:It helps to track the number of projects which follow to the plan schedule in each time or period.
Should be High or Low?:Target depends on the R&D sector and taken period of time.
16. Products launched on time
R&D Metrics / Project Progress / Work Effectiveness / Time Management
Description:This metrics shows how many projects were completed and launched out of the planned to be completed in that given period.
Calculation Method / Formula:number of projects completed / number of sheduled projects to be completed
Should be High or Low?:If the % is much lower the assumption in scheduling should be checked.
17. Number of products released
R&D Metrics / Work Effectiveness / Products / Brand Value
Description:Shows how many products were released in a given time.
Should be High or Low?:Target depends on the R&D sector, time and value per product.
18. Income from New products
R&D Metrics / Products / Revenue / Sales / Profitability
Description:New products (which might not be yet noticed by all the target customers) sales value among total sales in percentage.
Calculation Method / Formula:new product sales value / total incom from all product sales
Should be High or Low?:It can help to plan in future some steps to make the product more visible from the beginning.
19. Budget Variance / Cost Variance (CV)
R&D Metrics / Budget Management / Financial Performance / Revenue / Cost
Description:This metrics shows how accurate is your planning the project costs and how well you manage the budget during the time of project life from the beginning until Market Release. The percentage in the end of project shows what is the percentage of assumed at the beginning cost. If the value comes close to zero long before the end of the project it may show that the budget evaluation was wrong.
Calculation Method / Formula:Earned Value – Actual Cost
Should be High or Low?:If the conclusion is: below 0 – you are behind the schedule; 0 – you are on schedule; above zero – ahead of schedule.
20. Return on Innovation Investment (ROI)
R&D Metrics / Revenue / Budget Management / Financial Performance / Investment
Description:This metrics can help to predict if the investment in the new product was worth the cost and how long it might take for money return.
Calculation Method / Formula:( Profits of New Product or Service Sales) / (Expenditures Generated in Creating these New Products or Services)
21. Products launched on budget
R&D Metrics / Budget Management / Product Investment / Work Efficiency
Description:This metrics shows percentage of new services or products that has been finished within expected budget. It shows how accurate is the cost projection.
Should be High or Low?:If the metrics should be as close as possible to 100%, if it is much lower it may indicate wrong budget planning or lots of unexpected changes that were not included in the calculations.
22. Research & Development Effectiveness Index (RDEI)
R&D Metrics / Work Efficiency / Revenue / R&D Investment / Profitability
Description:It shows how the profit generated by new products compares to total R&D expenses. Success of product vs development efforts.
Calculation Method / Formula:Profit from New Products / R&D Sending
23. Total R&D Headcount
R&D Metrics / Employee Management / Budget Management
Description:Number of employees in the R&D department.
Should be High or Low?:The target should be based on projections and which direction company is going, what is the budget for hiring.
24. Portfolio in Core and Growth Projects
R&D Metrics / Project Progress / Work Effectiveness / Cost
Description:This metrics is the percentage of Projects that will not be completed even though company has already invested in them.
Should be High or Low?:It will have strong negative or positive impact on the growth and prosperity of the company.
25. R&D Budget
R&D Metrics / Budget Management / R&D Investment / Cost
Description:This metrics is the budget of the company intended for the R&D Department.
Should be High or Low?:May depend on the target and the direction of the company.
26. Suggested ideas by the team
R&D Metrics / Work Effectiveness / Product Investment
Description:That is a number of ideas which the R&D Department came up with during some period of time.
Should be High or Low?:In general, the more ideas the better, but the quality of ideas has an impact on further work and eventual success.
Below is the summary of R&D KPI metrics:
Most Important KPIs for Different Industries
If you are interested in other industries or departments and their performance, you should learn more about their KPIs via our related articles!
Related Posts


