
23 Most Important Healthcare KPIs & Metrics
Is your health organization tracking the correct healthcare KPI? Moreover, what are key performance indicators for healthcare and why are they important? As Someka, we’ve been providing Healthcare Dashboard templates for years and here, we have curated a list of the most used healthcare KPIs you should track. But first, let’s start with the fundamentals.
What is a healthcare KPI?
In general, KPI stands for Key Performance Indicator. A healthcare KPI is a well-defined and measurable metric to track in order to improve the quality of patient-related services. In the healthcare industry, there are many metrics (such as hospital metrics and other related key metrics) you should analyze and optimize to improve the processes.
Why should you track healthcare KPI and metrics?
Healthcare is a very demanding industry and patient-related services/processes should be improved on a daily basis. Especially to understand a hospital’s success, you should be tracking and improving the most important healthcare KPIs regularly.
What are the most important healthcare KPI and performance metrics?
There are lots of metrics and key performance indicators in healthcare. So, choosing the right ones to focus on is critical. During our consulting studies for years, we’ve dealt with hundreds of different healthcare KPIs. Then we worked on the data, eliminated and consolidated the metrics, and listed down the 23 most used healthcare KPIs to track.
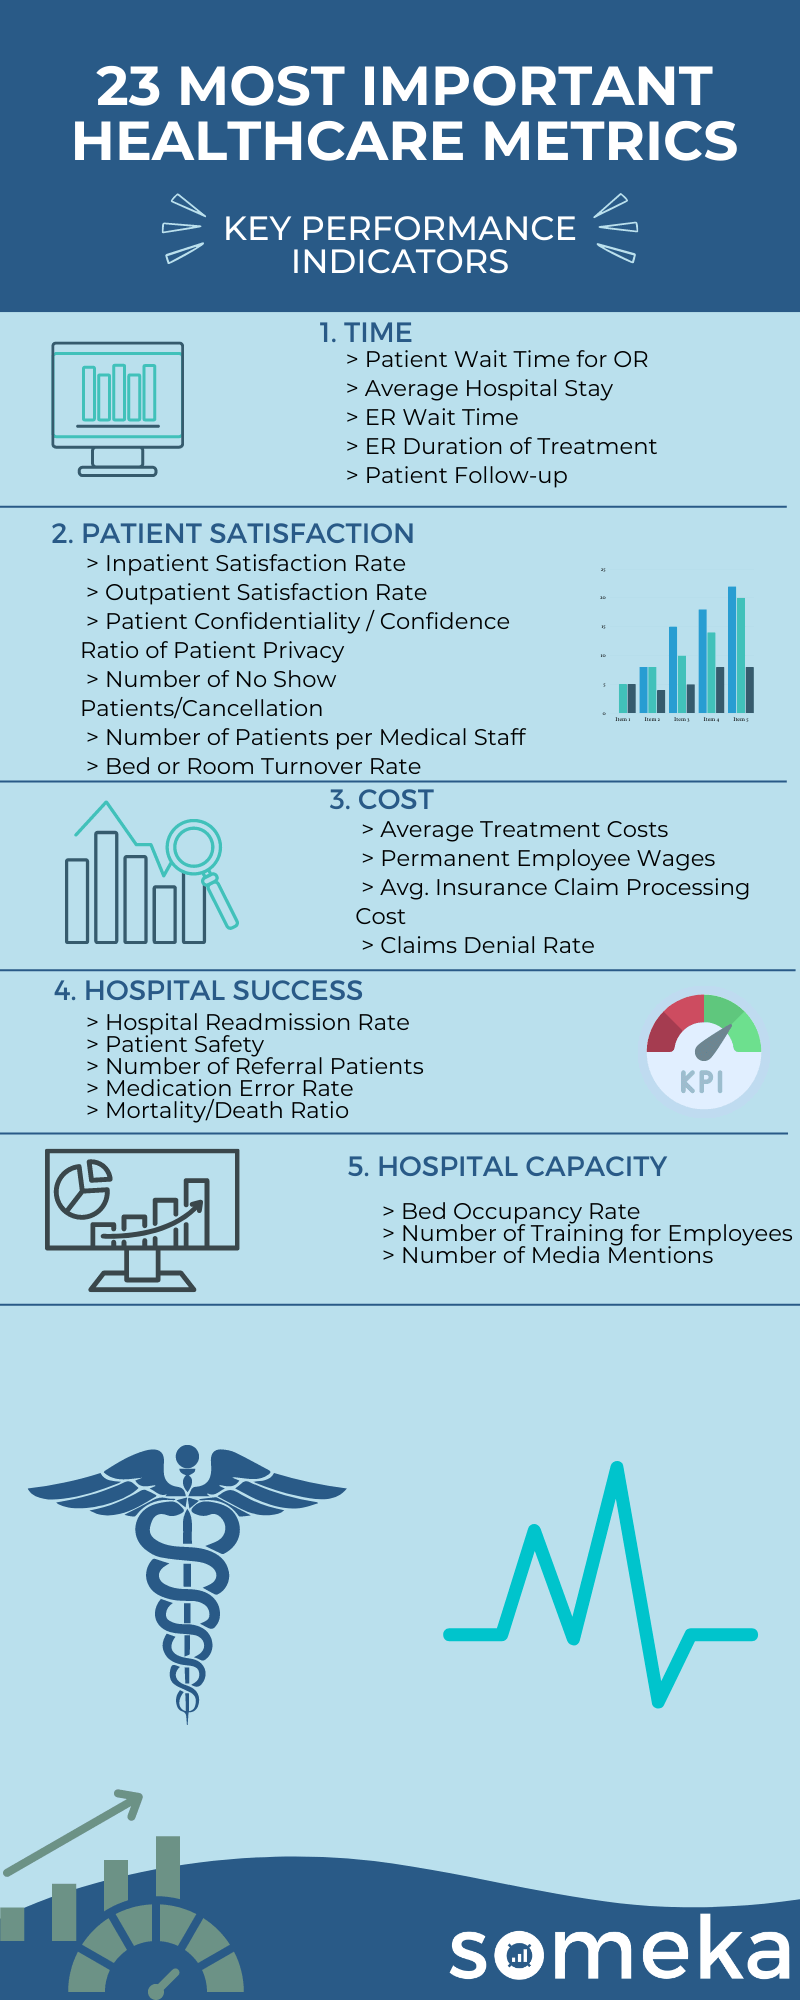
23 Most Used Healthcare Metrics
1. Patient Wait Time for OR
Healthcare Metrics / Customer Satisfaction
Description:Average time to wait for operating room. It is an average time that patients are waiting for the surgery.
Calculation Method / Formula:total time to wait for OR all patients wait/ number of patients
Should be High or Low?:The shorter the better. It can have influence on the satisfactory rate.
2. Average Hospital Stay
Healthcare Metrics / Customer Satisfaction
Description: Amount of days on average that your patients stay in the medical center. Depending on the heath issue patient has the time will vary so if it is necessary this metrics could be split in more categories.
Calculation Method / Formula:number of days per each patient/number of patients
Should be High or Low?:Best if it’s close to the target. It has an impact on hospital capacity, number of beds, doctors and other medical stuff.
3. ER Wait Time
Healthcare KPIs and Metrics / Customer Satisfaction / Work Time Management
Description:Shows how long patients wait until seeing a doctor.
Calculation Method / Formula:total time all patients wait/ number of patients
Should be High or Low?:The shorter the better. It can have influence on the satisfactory rate.
4. ER Duration of Treatment
Healthcare Metrics / Customer Satisfaction / Work Time Management
Description:This is complete time measured from admission until getting into emergency room and full time of the first medical intervention.
Calculation Method / Formula:Total time ER wait time + Time of doctor intervention
Should be High or Low?:The shorter the better. It can have influence on the satisfactory rate.
5. Patient Follow-up
Healthcare Metrics / Customer Satisfaction / Work Time Management
Description:How many days patient’s health conditions are under observation. Time between first day in the medical center and the end of the full recovery.
Should be High or Low?:Best if it’s close to the target,
6. Inpatient Satisfaction Rate
Healthcare Metrics / Customer Satisfaction / Work Organization
Description:Satisfaction of the patients being hospitalized. Shows an overall percentage of how satisfied inpatients are with healthcare and other services provided during the time of hospitalization.
Should be High or Low?:The best if it’s 100% or as close as possible.
7. Outpatient Satisfaction Rate
Healthcare Metrics / Customer Satisfaction
Description:Satisfaction of the patients NOT being hospitalized. Shows an overall percentage of how satisfied patients are with their visit and provided service during their visit.
Should be High or Low?:The best if it’s 100% or as close as possible.
8. Patient Confidentiality / Confidence Ratio of Patient Privacy
Healthcare Metrics / Customer Satisfaction / Customer Relationship / Brand Value
Description:This measures how on average patients feel confident about privacy regarding their medical records.
Should be High or Low?:The best if it’s 100% or as close as possible.
9. Number of No Show Patients/Cancellation
Healthcare Metrics / Cost / Work Time Management
Description:Shows number of missed or cancelled visits. Depending on cancelation policy and organization it can have an impact on other metrics like waiting times or capacity.
Should be High or Low?:The smaller the better.
10. Number of Patients per Medical Staff
Healthcare Metrics / Customer Satisfaction / Work Organization
Description:The target should be measured based on capacity (number of rooms, doctors, beds, time of visits etc.) of the medical center.
Calculation Method / Formula:number of medical personel / number of patients
Should be High or Low?:Best if it’s close to the target. A higher ratio number means bigger chance to provide better care to patients, but it also increases total cost of the medical facility.
11. Bed or Room Turnover Rate
Healthcare KPIs and Metrics / Customer Satisfaction / Cost / Market Demand
Description:Calculated as an average number of patients that used the same bed within a period of time. In our template the time period means 1 month.
Calculation Method / Formula:Number of discharges (including deaths) in a given time period / Number of beds in the hospital during that time period.
Should be High or Low?:Best if it’s close to the target. Higher number means bigger capacity but there is a limit depended on number of medical staff, fully recovery time that indicates satisfaction rate etc.
12. Average Treatment Costs
Healthcare Metrics / Customer Satisfaction / Cost
Description:The average amount that a facility charges a patient for treatment. However, on that cost influence a lot of factors depending on how serious problem patient has.
Calculation Method / Formula:average cost of total treatmants in a period of time
Should be High or Low?:The higher cost may indicate higher income, but it also depends on time it took to take care of a patient. It can have influence on satisfaction rate or claims denial.
13. Permanent Employee Wages
Healthcare Metrics / Employee Satisfaction / Cost / Work Efficiency / Budget Management
Description:The average value of wages paid to all full-time employees during the reporting period. It is very important metrics that influence the satisfaction rate of employees what leads to better qualified staff and better healthcare.
Should be High or Low?:It depends on a target; however higher wage leads to better quality of hired staff.
14. Avg. Insurance Claim Processing Cost
Healthcare Metrics / Cost
Description:Total money spent by a hospital on insurance claiming procedures.
Should be High or Low?:The best if total cost goes down but it depends on amount of cases to be proceed.
15. Claims Denial Rate
Healthcare Metrics / Cost
Description:The percentage of payment claims was rejected by payers in each period. It can be a patient itself because of not enough funds on its account or other reason or an insurance company that reject payment.
Calculation Method / Formula:Total of Claims Denied/Total of Claims Submitted.
Should be High or Low?:If it’s close to zero, the hospital does not lose money on that matter. Otherwise all the rejected claims are covered by the medical facility.
16. Hospital Readmission Rate
Healthcare Metrics / Cost / Brand Value / Customer Satisfaction
Description:What is the percentage of patients returning to the facility because of wrong treatment. It depends on personnel competence and quality.
Calculation Method / Formula:number of returning patients / total closed cases in a period of time
Should be High or Low?:High number might be a threat for facility prosperity.
17. Patient Safety
Healthcare Metrics / Customer Satisfaction / Brand Value
Description:The percentage showing how good the environment, tools, implementation and doctors to keep the safety for patients as high as possible.
18. Number of Referral Patients
Healthcare Metrics / Customer Satisfaction / Cost
Description:The number of patients referred to different departments.
19. Medication Error Rate
Healthcare Metrics / Cost / Brand Value / Customer Satisfaction
Description:The ratio of wrong treatment of patients. Like the “Hospital Readmission Rate” however might include medical malpractice or changes of medication during the time of treatment.
Should be High or Low?:If the number is close to zero it can have a big impact on reviews and patient satisfaction.
20. Mortality/Death Ratio
Healthcare Metrics / Customer Satisfaction / Brand Value
Description:The percentage of death patients out of all patients that has been treated in the medical center.
Calculation Method / Formula:Total number of patients’ death in facility/Total number of patients
Should be High or Low?:The lower the better. It builds trust of society. However, zero mortality is impossible.
21. Bed Occupancy Rate
Healthcare Metrics / Capacity / Brand Value / Customer Satisfaction
Description:The proportion of hospital beds in use at any time.
Calculation Method / Formula:number of days bed was used during period of time / available bed-days during the period of time
Should be High or Low?:The ratio should be close to 100 but slightly below because for any emergency it might be good to have available bed.
22. Number of Training for Employees
Healthcare Metrics / Employee Satisfaction / Employee Management / Budget Management / Quality / Work Efficiency
Description:It shows the total number of training for employees in a facility.
Should be High or Low?:In this healthcare kpi, higher numbers of trainings results in higher qualifications however the target should be related to funds and possibility of the facility.
23. Number of Media Mentions
Healthcare Metrics / Digital Marketing / Marketing Effectiveness / Sales / Brand Value
Description:The total number of news, opinions or articles in media regarding to the facility and working staff.
Should be High or Low?:If the number is larger it brings more patients, however bad opinions or reviews may decrease the general opinion about facility.
Below is the summary of Healthcare KPI metrics:
Most Important KPIs for Different Industries
All industries have different dynamics hence various kpis are being tracked and measured. Below you can see the list of different sectors and areas where we have listed most important kpis for each of them.
Related Posts


