Ranking factors of Fortune 500: Companies returns to scale
Conceptually, increasing returns to scale is: when you add a dollar of expenditure, you get more than a dollar in return. Decreasing returns to scale is that you get less than a dollar in return. Constant returns to scale is borderline, you add a dollar, and you get a dollar in return. There is a fourth one that economists do not like to talk about: Negative returns to scale. You add a dollar and you LOSE money. So with decreasing returns to scale, your return falls to zero, and then decreasing returns TAKES money from you, more than you paid.
A word of explanation about the Fortune 500 spreadsheets:
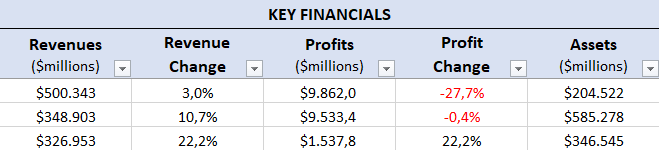
Here is the latest spreadsheet 2017/2018, giving the Fortune 500 Companies returns to scale in the list, using their latest values of employment. There are columns for Labor, Revenue, Profit, Asset for two succeeding years.
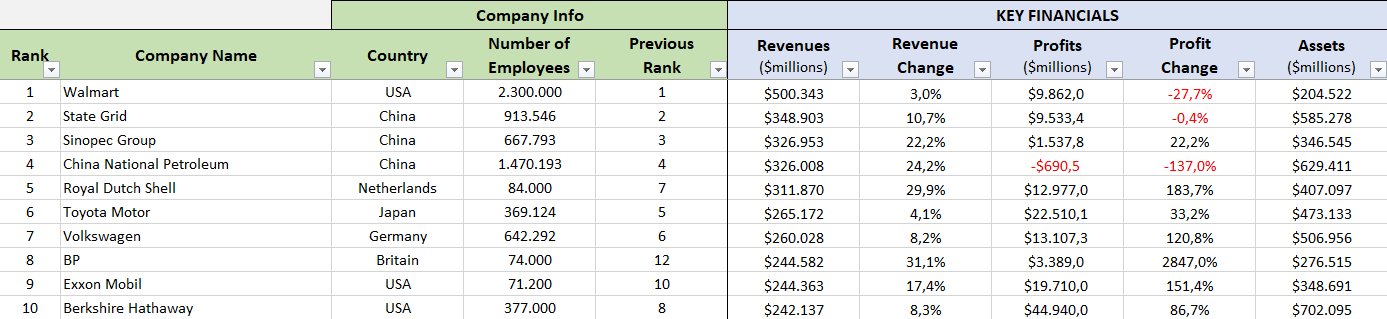
The entries for Capital and Labor are proxies for expenditure on capital and labor. Capital cost figures are not published, and neither are wage costs. They are too difficult to work out for all companies individually, so this will have to do. Labor is the number of employees at the end of the year. So in economic talk, there is one flow Revenue, and three stock variables, Labor, Profit, and Asset.
These figures are placed in succeeding columns for all the companies in two successive years in the Fortune 500 and Fortune 1000 publication.
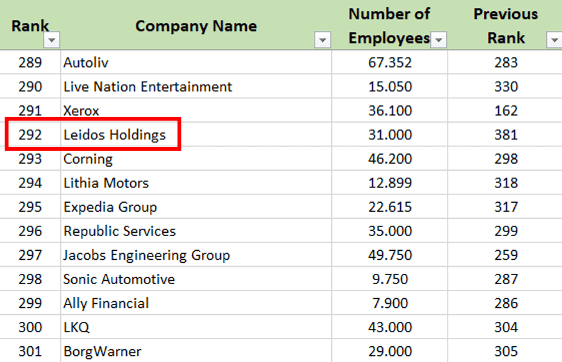
Change in Ranking
As you can see the top of the list has changed since the previous year of 500 companies. One of the interesting additions is Leidos Holdings, whom I had never heard of.
Assurant has gone from the top of the list.
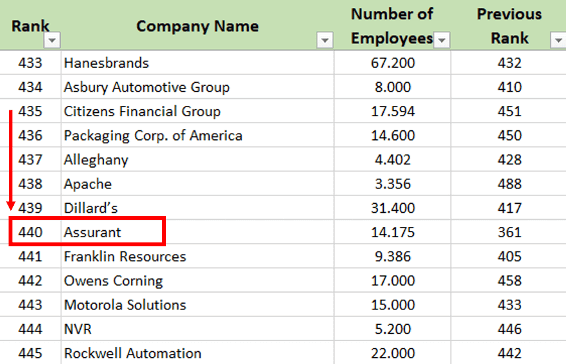
Ill-advisedly they had dismissed a number of high performing staff, while at the same time increasing their inefficient capital base. It goes to show that remaining in that select high returns to scale group is highly unstable.
In this spreadsheet, the last three columns show returns to scale for capital expenditure, returns to scale for labor expenditure, and total returns to scale for the firm.
If you peruse these columns you will see that often companies have negative values in one or other column.
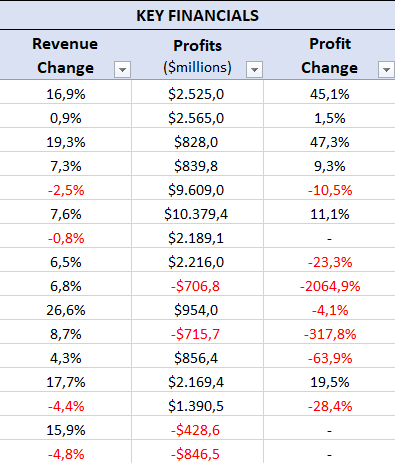
This means that these companies are wildly inefficient in the use of either capital or labor. If these figures are between zero and one, they are relatively inefficient in the use of these resources. Having both negative is Soviet-style, leading to total and rapid collapse. A total between zero and one means the company is not expanding but surviving.
Those companies with totals above one are worth investing in. There is a caveat though: Those companies with large negative figures in Labor or Capital can have wildly unstable performances and are only worth investing in when the share price is low. The next year they can boom!

Conclusion
Generally speaking Fortune companies spreadsheets are great for sorting out those companies that are NOT worth investing in, total under one, and selecting companies that are, total over one, after further investigation.
As various people have told me, at least I can avoid the junk shares that stockbrokers are trying to dump on me!
This Fortune 500 Companies Returns to Scale guest post is written by Tim Walshaw, a qualified economist who has had a successful career advising clients how to invest profitably in company shares. He is an author of Economic Rents, The Hidden Profit: How to Identify Safe Companies to Invest In and Increasing Returns to Scale books.
Related Posts