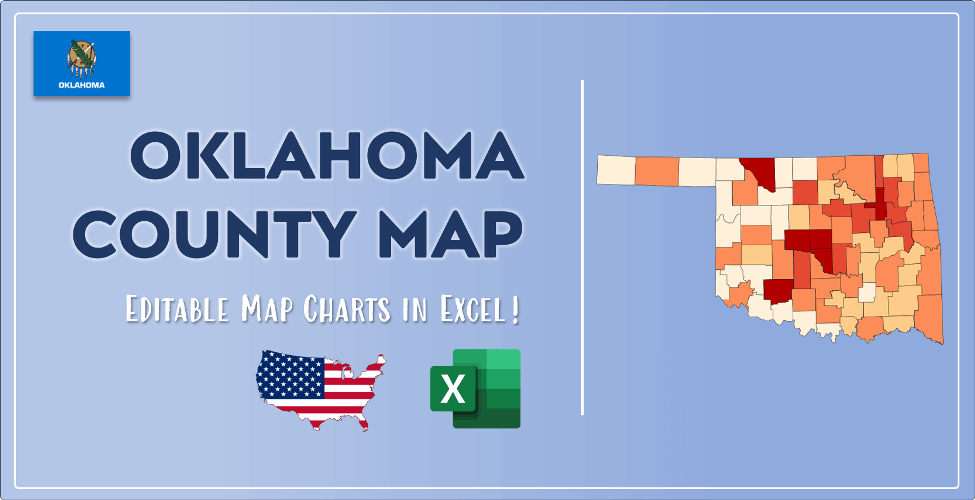
The US state Oklahoma (OK) is the 28th largest state by population and 20th biggest state by area. Oklahoma has 77 counties ranking it the 17th state with the most counties in USA. See below some basic information about the state:
| Country: | United States |
| State: | Oklahoma |
| Abbreviation: | OK |
| Capital: | Oklahoma City |
| Largest City: | Oklahoma City |
| Population: | 3,956,971 |
| Population rank in US: | 28th |
| Total Area [mi²]: | 69,899 |
| Total Area [km²]: | 181,037 |
| Area rank in US: | 20th |
| Number of Counties: | 77 |
If you want to show data distributon per geographical area, density maps (or heat maps) are a great way to achieve this. For example, here is a Oklahoma Population Density Map per County:
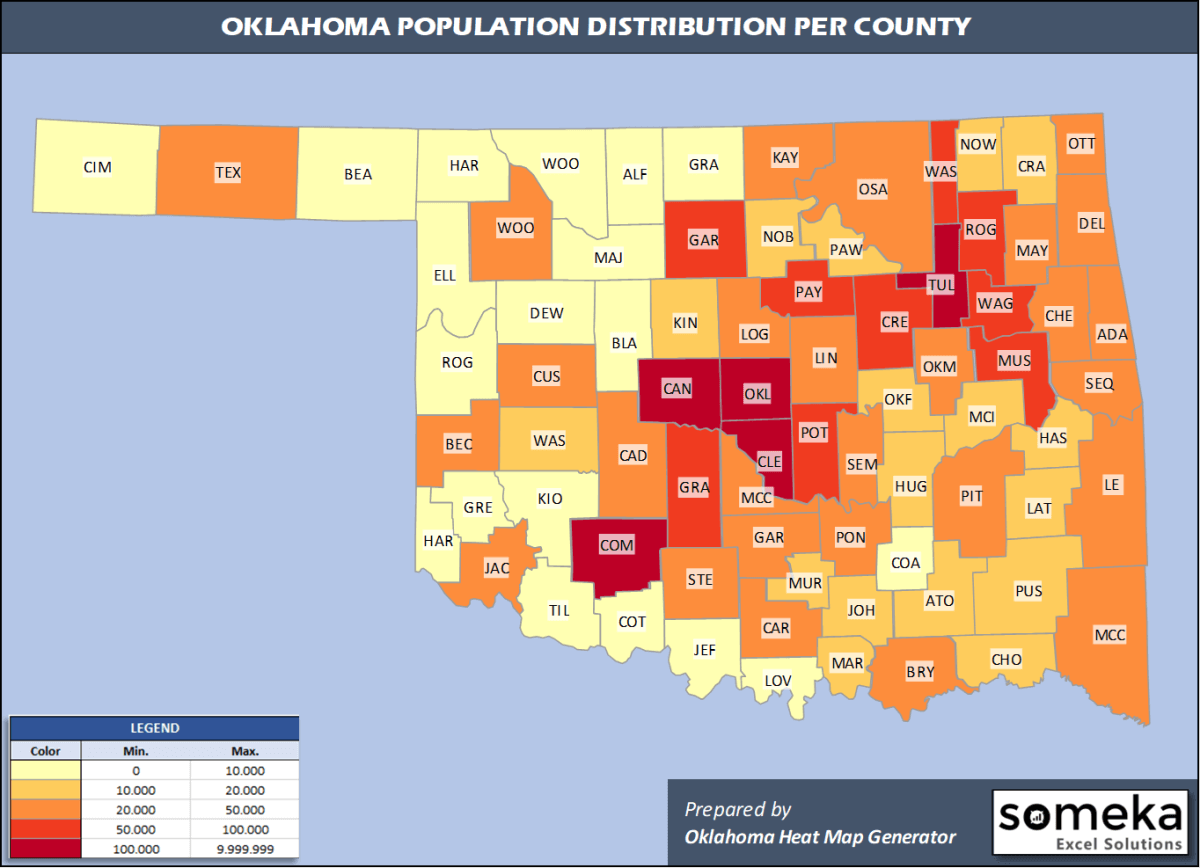
We have prepared this easily with Oklahoma County Heat Map Generator for population info. But it can also be used for many different data types such as employment rate, average temperature, racial distribution and so on.
Below are 77 Oklahoma counties ranked by population information. The data is from the US Census Bureau. You can copy and paste this list directly into your spreadsheet.
(Top 10 counties shown. To expand the list, simply click on the “show more” button)
| Rank | County | Population |
|---|---|---|
| 1 | Oklahoma County | 797,434 |
| 2 | Tulsa County | 651,552 |
| 3 | Cleveland County | 284,014 |
| 4 | Canadian County | 148,306 |
| 5 | Comanche County | 120,749 |
| 6 | Rogers County | 92,459 |
| 7 | Payne County | 81,784 |
| 8 | Wagoner County | 81,289 |
| 9 | Pottawatomie County | 72,592 |
| 10 | Creek County | 71,522 |
| 11 | Muskogee County | 67,997 |
| 12 | Garfield County | 61,056 |
| 13 | Grady County | 55,834 |
| 14 | Washington County | 51,527 |
| 15 | Le Flore County | 49,853 |
| 16 | Cherokee County | 48,657 |
| 17 | Carter County | 48,111 |
| 18 | Logan County | 48,011 |
| 19 | Bryan County | 47,995 |
| 20 | Osage County | 46,963 |
| 21 | Pittsburg County | 43,654 |
| 22 | Kay County | 43,538 |
| 23 | Stephens County | 43,143 |
| 24 | Delaware County | 43,009 |
| 25 | Sequoyah County | 41,569 |
| 26 | Mayes County | 41,100 |
| 27 | McClain County | 40,474 |
| 28 | Okmulgee County | 38,465 |
| 29 | Pontotoc County | 38,284 |
| 30 | Lincoln County | 34,877 |
| 31 | McCurtain County | 32,832 |
| 32 | Ottawa County | 31,127 |
| 33 | Custer County | 29,003 |
| 34 | Caddo County | 28,762 |
| 35 | Garvin County | 27,711 |
| 36 | Jackson County | 24,530 |
| 37 | Seminole County | 24,258 |
| 38 | Adair County | 22,194 |
| 39 | Beckham County | 21,859 |
| 40 | Woodward County | 20,211 |
| 41 | Texas County | 19,983 |
| 42 | McIntosh County | 19,596 |
| 43 | Marshall County | 16,931 |
| 44 | Pawnee County | 16,376 |
| 45 | Kingfisher County | 15,765 |
| 46 | Choctaw County | 14,672 |
| 47 | Craig County | 14,142 |
| 48 | Murray County | 14,073 |
| 49 | Atoka County | 13,758 |
| 50 | Hughes County | 13,279 |
| 51 | Haskell County | 12,627 |
| 52 | Okfuskee County | 11,993 |
| 53 | Noble County | 11,131 |
| 54 | Pushmataha County | 11,096 |
| 55 | Johnston County | 11,085 |
| 56 | Washita County | 10,916 |
| 57 | Love County | 10,253 |
| 58 | Nowata County | 10,076 |
| 59 | Latimer County | 10,073 |
| 60 | Blaine County | 9,429 |
| 61 | Woods County | 8,793 |
| 62 | Kiowa County | 8,708 |
| 63 | Major County | 7,629 |
| 64 | Tillman County | 7,250 |
| 65 | Jefferson County | 6,002 |
| 66 | Greer County | 5,712 |
| 67 | Alfalfa County | 5,702 |
| 68 | Cotton County | 5,666 |
| 69 | Coal County | 5,495 |
| 70 | Beaver County | 5,311 |
| 71 | Dewey County | 4,891 |
| 72 | Grant County | 4,333 |
| 73 | Ellis County | 3,859 |
| 74 | Harper County | 3,688 |
| 75 | Roger Mills County | 3,583 |
| 76 | Harmon County | 2,653 |
| 77 | Cimarron County | 2,137 |
Out of the 77 counties in Oklahoma, Oklahoma County is the largest by population. Osage County is the largest by land area.
Cimarron County is the smallest Oklahoma county by population. Marshall County is the smallest by size.
In terms of economics and average income level, Roger Mills County is the richest Oklahoma county.
Greer County is the poorest Oklahoma county.
We have prepared Oklahoma county density map by population as a downloadable PDF.
You can download the PDF for free from the link below:

Oklahoma County Density Map PDF
Check the video below to see how we use our Oklahoma County Map Excel Template to visualize any data over Oklahoma counties.
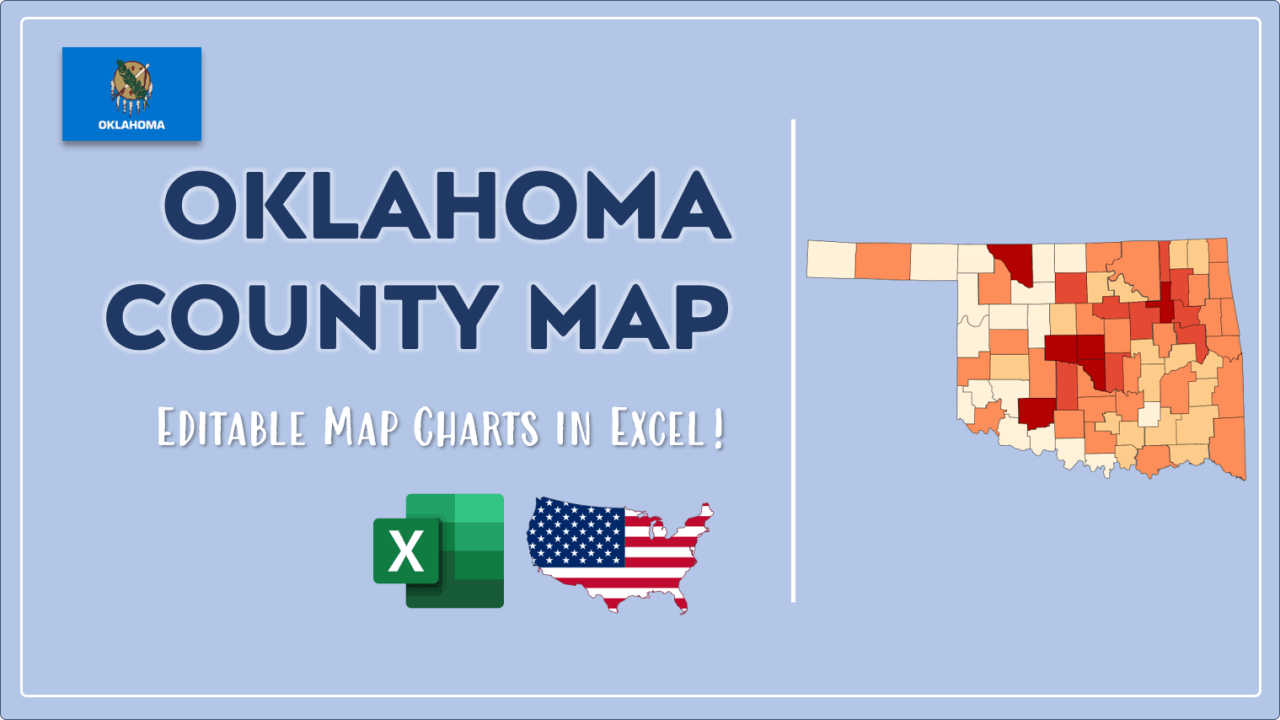
We have built the easiest Oklahoma Heat Map Maker in the universe! It works fully in Excel:
Here is a list of useful links which we think can be helpful whether you work on data visualization or make research about Oklahoma state and Oklahoma counties.
Data Source for Population and many other US related data:
https://www.census.gov
Wikipedia Page for List of Oklahoma Counties:
https://en.wikipedia.org/wiki/List_of_counties_in_Oklahoma
Official Website of the State of Oklahoma:
https://www.ok.gov
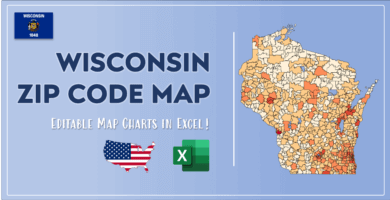
Are you looking for Oklahoma Zip Code map?:
Oklahoma Zip Code Heat Map Generator in Excel