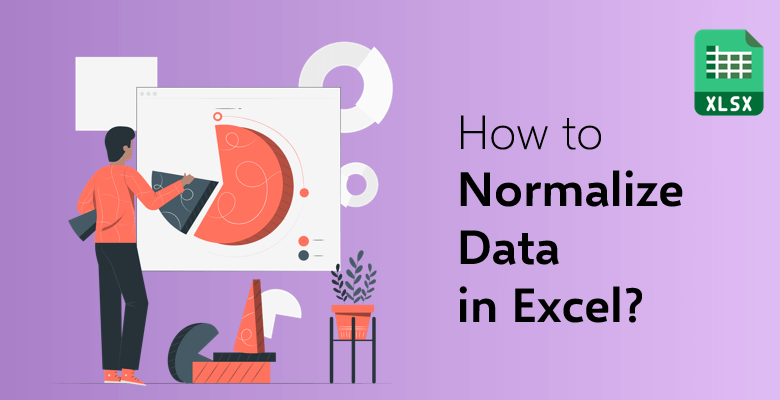
How to Normalize Data in Excel?
Imagine two flower-seller who grow rose in their rose garden. They want to find out who is better at getting more roses to grow in their garden. One of them Jack says, “I have only 5 roses branches but this year I picked 30 roses!” and the other one Mary replies, “You are not good at this, I picked 100 roses this month!”. Let’s see how to normalize data!
Table Of Content
- What Is Normalized Data?
- What’s the difference between Normalization and Standardization?
- How to Normalize Data in Excel?
- Methods Used to Normalize & Standardize Data
- Why Should You Normalize Variables
- Final Words
If you just compare 30 roses of Jack and 100 roses of Mary, it does seem like Mary is the better gardener. But think like that: what if Mary had to plant 25 roses branches to get that harvest?
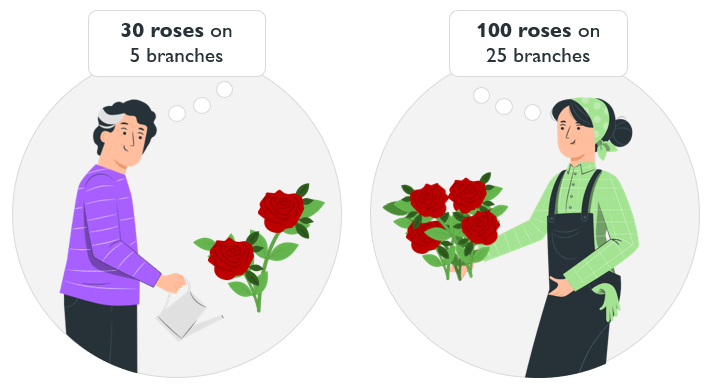
Just “normalize” the data to get a more fair way of comparing these two. Instead of counting the total number of roses, let’s compare both gardeners with a fair standard – how many roses did they each grow per branch?
Jack grew 30 roses on 5 branches. 30/5 = 6 roses per branch.
Mary grew 100 roses on 25 branches. 100/25 = 4 roses per branch.
Now that you’ve normalized the data, you can clearly see that gardener Jack is much better!
If you’re working on data analysis in Excel, consider using downloaded VPN for Mac to ensure secure data transfer during your processes.

What Is Normalized Data?
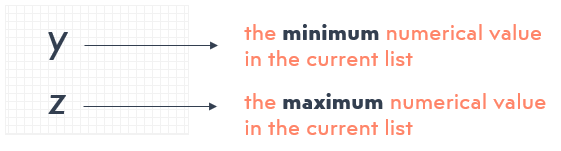
Normalized data is the data transformed to fit within a certain range which is usually simpler. Let’s say we have a list of values ranging from y to z.
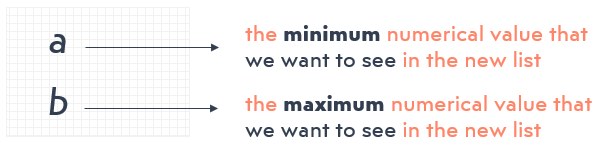
We want to simplify this list by making it range differently such as ranging from a to b.
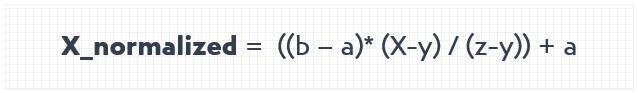
To establish the formula, let’s say the list begins with a number X.
X: the first value appearing in the list
The formula to normalize the value X is;
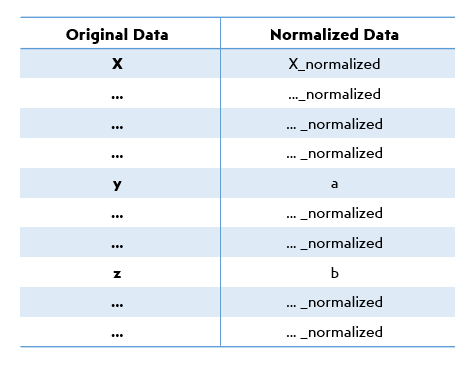
After establishing the formula for the first value X, we can duplicate it for the other cells to normalize all values in the list. Hence, at the end, we get a simpler range of data that is easier to read and understand.
This is how the list will basically become after the normalization calculation:
What’s the difference between Normalization and Standardization?
Normalization and standardization are concepts that are often confused with each other.
We can normalize a list of values via the calculation above, however, if we want to standardize values, Excel has also its own formula to calculate it, called Standardize.
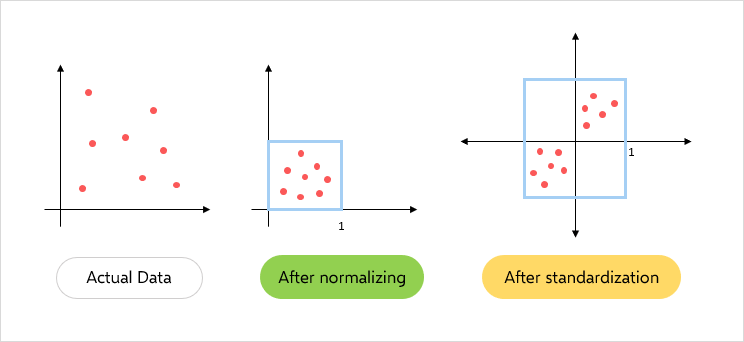
While normalization transforms the original values to fit within a certain range, standardization transforms them to fit within a distribution that has a mean of 0 and standard deviation of 1. This operation is also called getting Z-scores or Mean Centering:
How to Normalize Data in Excel?
The calculation of standardization is quite easy. Let’s say, we again have a list of values ranging from y to z and it begins with a number X.
X: the first value appearing in the list
The formula to standardize the value X is;
X_standardized = (X – mean of range) / standart deviation of the range
The Excel formula for this calculation is:
=STANDARDIZE (X; mean of range; standard deviation of the range)
So obviously to write this formula, we also need to know the mean calculating formula and standard deviation calculating formula.
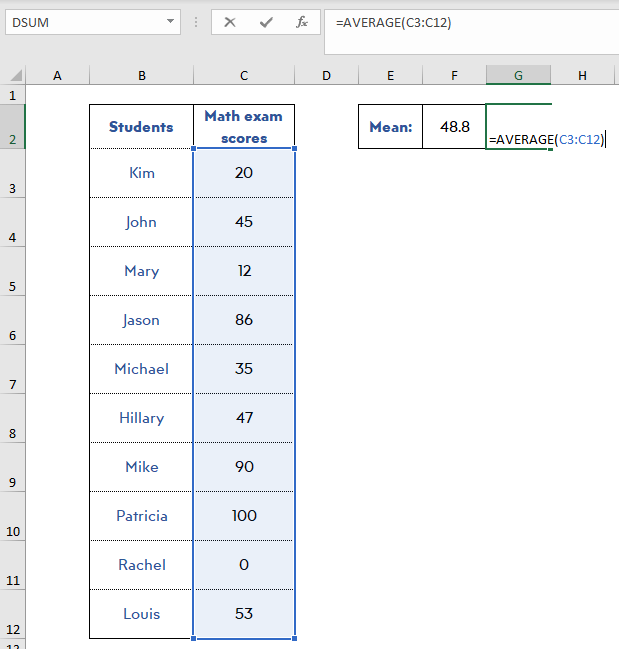
Mean calculating formula: =AVERAGE(range of values)
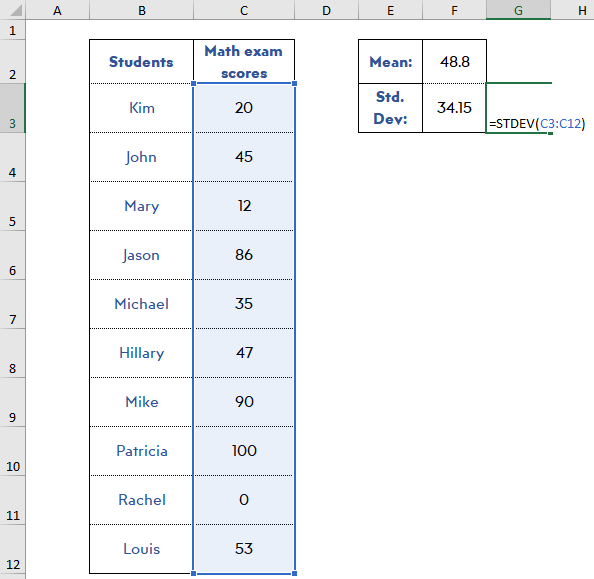
Standard deviation calculating formula: =STDEV(range of values)
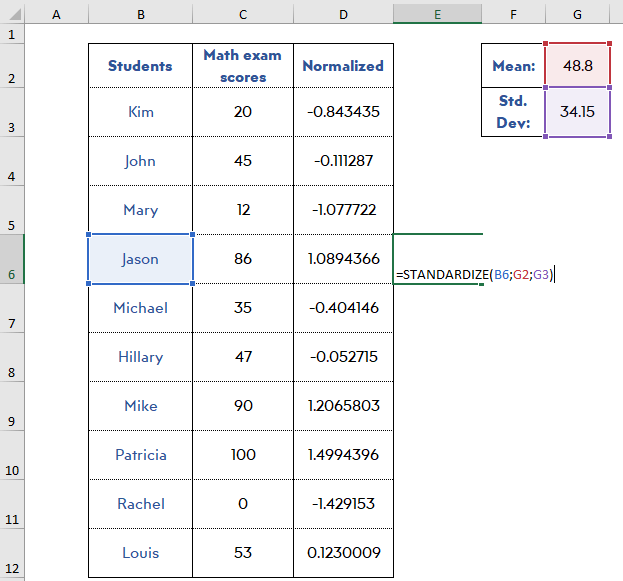
Then, let’s dive into these formulas with the following example in our spreadsheet:
Step 1: Find the mean:
First of all, you need to calculate the mean of the data set. Here let’s use =AVERAGE(range of the values) formula.
Step 2: Find the standard deviation:
Now, let Excel calculate the standard deviation for you. Write down =STDEV(range of values) before normalizing the data set.
Step 3: Normalize the values:
As we have everything we need, it is an easy thing to normalize your data with the formula: =STANDARDIZE (X, mean of range, standard deviation of the range) If you would rather not write the formulas by hand, GPT for Work is an AI agent inside Excel and Google Sheets that normalizes a range from a plain-language prompt.
Methods Used to Normalize & Standardize Data:
Data normalization is generally being used in 2 ways:
1) In order to make a range of data easier to understand and assess:
For instance; we have a list of math scores of 10 students. The scores are ranging from 0 to 100, but we want them to range from 0 to 1 so as to assess it more easily. When we make the calculation we get the scores like this:
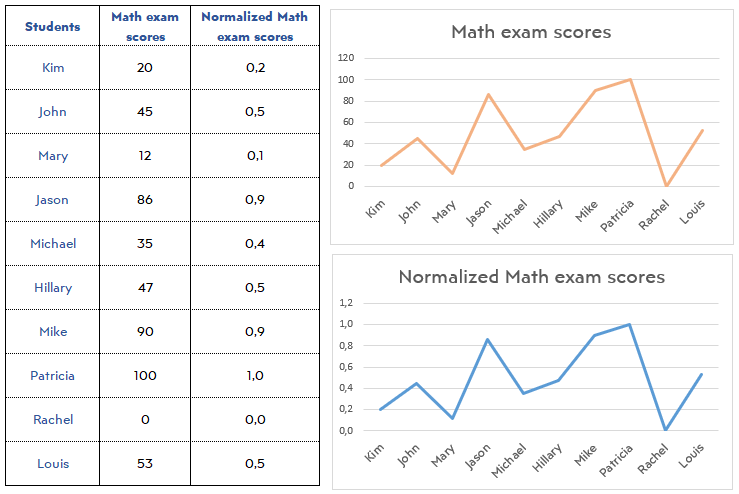
Thanks to normalization, we can deduce that the more successful students are Jason and Mike.

To crosscheck the calculation, we can make graphs and see the line graphs of both columns have the same trends (but different ranges).
2) In order to compare more than one set of data with different ranges:
For example; we have a list of Math exam and Physics exam scores and we want to compare who is more successful on what. However; the Math exam was scored out of 100 and the Physics exam was scored out of 50. Since the ranges are different, the assessment out of original numerical values may be confusing. When we normalize the scores, we get:
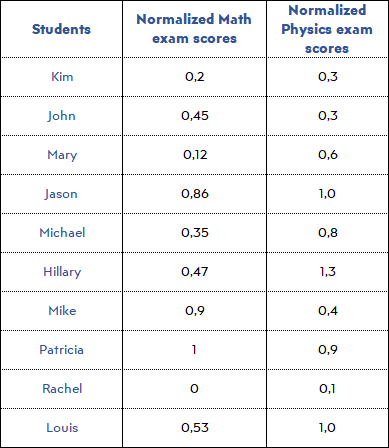
Now, we see all scores as if the exams were scored out of 1.
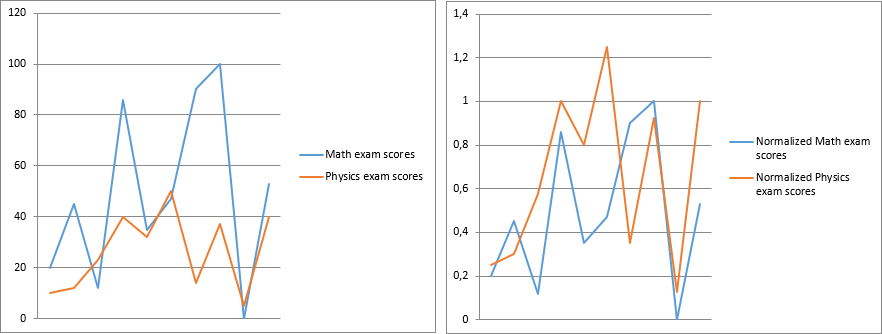
When we make graphs from both original scores and normalized scores, we see that original data is misleading because, for example, Jason looks like he is better at Math, however actually he is better at Physics. Also, Harvey’s success on both exams is alike, however, actually, he is way much better at Physics than Math.
Standardization can also be used in 2 different ways:
1) In order to simplify different variables with a mean of 0 and standard deviation of 1:
For instance; we have a portfolio of 8 stock exchange accounts with a mean of 23,5 and a standard deviation of 22,1. When we standardize the values, it is much more convenient to read and evaluate:

Standardization tells us the standard deviation of the value from the mean. If a value has a negative standardized value, it means its value is less than the mean. Conversely, if a value has a positive standardized value, it means its value is bigger than the mean.
For example; here Walmart has 0.610 standard deviation below the mean (since it has a minus) and Apple has 1.513 standard deviation above (since it is a positive number).
Recommended Reading: Apple SWOT Analysis
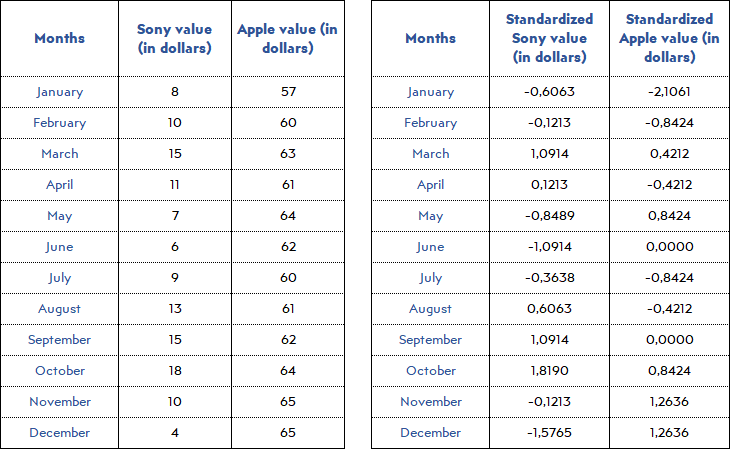
2) In order to make it simple to evaluate fluctuations of different data sets if they have different means and/or standard deviation:
Let’s say we have monthly values of 2 different stock exchange accounts. When we standardized the data, we get;
Why Should You Normalize Variables
Normalization and standardization are great methods especially when we are dealing with a large number of data or data with different scales because they help to make the large data shrink into a smaller size and make it easy to make deductions and use the data correctly.
If data analysis, cluster analysis, or statistical modeling is a part of your job, these two major data pre-processing techniques can help you to form predictive models and detect relations and correlations between data sets if there is any.
Final Words: How to Normalize Data?
All in all, whether you want to make a presentation to your company on a particular topic or you want to reduce the size of the data that you are dealing with to make clear cut deductions for yourself, consider using normalization or standardization functions of Excel.
Recommended Readings:
Related Posts