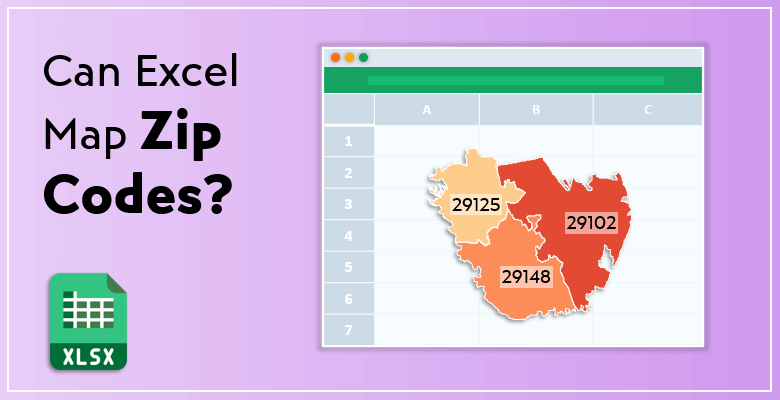
Can Excel Map Zip Codes? How to Plot Zip Codes on a Map in Excel?
Do you know that Excel can map zip codes? Here’s a step by step guide on Excel Zip Code Map. So, in this post, you’ll discover how to create a map in excel with zip codes.
Table Of Content
1. How to Map Zip Codes in Excel?
2. Limitations of Creating Map Chart in Excel
3. Someka US Zip Code Map Generators
4. Additional Benefits of The Template
5. Final Words
Microsoft Excel is very good at taking certain information and adapting them into your current data. From the various types of charts that Excel can plot, the map is what we are going to talk about in this article. This feature of Excel helps you to make comparisons among geographical regions.
 Let’s get started learning how Excel does this step by step.
1. How to Map Zip Codes in Excel?
Having the data is the very first step to create a map chart. Provide your existing data to Excel; write them manually or copy-paste from a source. You can even do that with geography data types as an easier alternative.

We will see it through the steps. Also, it should be stated at this point that Excel creates map charts based on either value or category. Value map shapes and colors the chart based on the values, such as inflation rate; category map on the other hand based on categories, such as countries.
Step 1. Set the data for Excel Zip Code Map
Firstly, open your Excel. Enter your data into the spreadsheet with ZIP codes and values. Then, write them or copy from somewhere and paste.
If you prefer to do that with geography data type; input your data which includes geographical values, then go to Data > Data Types > Geography.
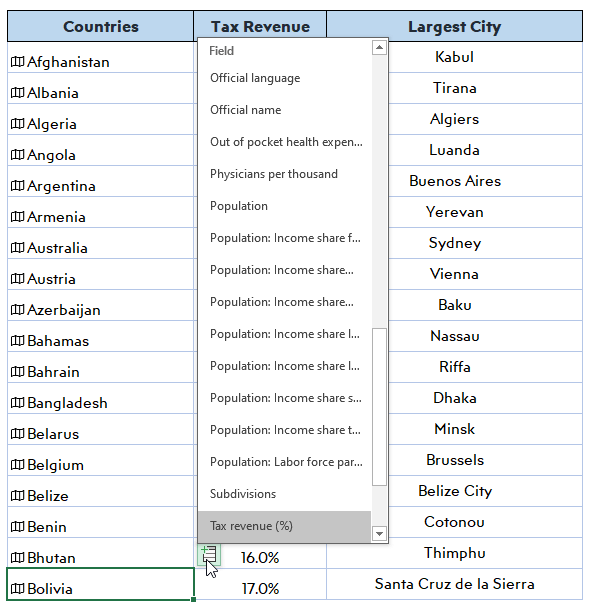
Then, your data will be converted into a geography data type. Thus, tou can then add columns to the data, like population or tax rate.
Step 2. Create the map chart
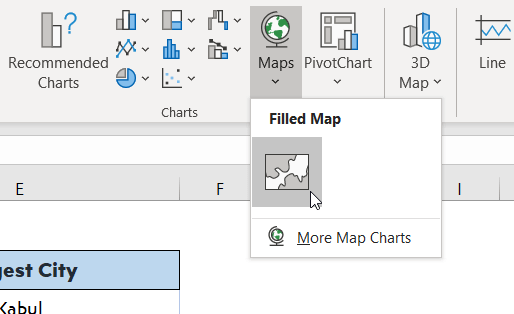
Once you finish arranging your data, select the cells you want to turn into the map.
Then on the Insert tab, go to Charts > Maps > Filled Map.
Here Excel reads the ZIP codes you entered and creates a map chart based on them. Relatively low values are represented by light colors and higher values are shown with darker colors.
Step 3. Confirm
Your to-be map chart will be previewed. After the preview, click “Ok” to confirm.
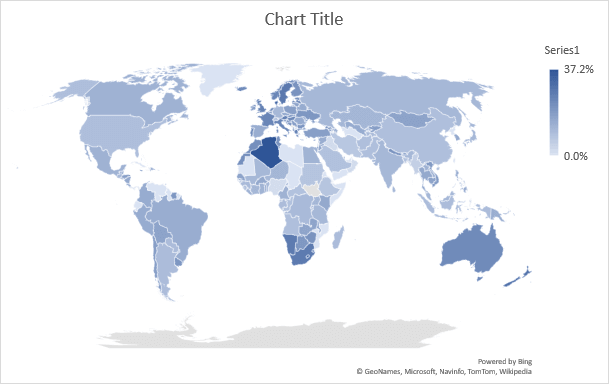
Excel will give you the map chart based on value or category depending on your data.
Step 4. Customize your Excel Zip Code Map
Excel arranges the colors by default; however, you can format the map chart in your style using design tools. Open the formatting table by double-clicking on the map chart. You will see the options that you can customize. 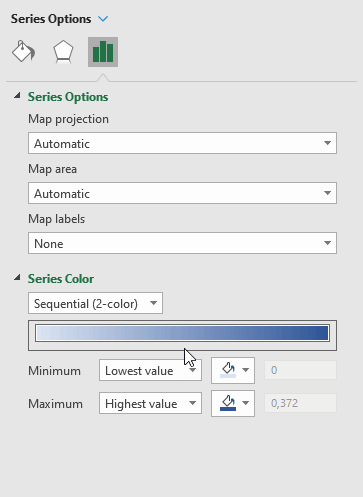
Filling, colors, and other types of formatting could be edited here. Also, if you double click on the map, you will see another button on the right that is used to format the map itself.
You can edit map projection, map area, and map labels. You can decide how much of the map you want to show, or which geographic names you prefer to display.
2. Limitations of Creating Map Chart in Excel
Excel does have some limitations. We better mention them so that we know what the obstacles would be and how to be more careful using Excel.

- Map chart feature is only available in the latest versions of Excel. If you have Microsoft 365 or 2019, you will be able to reach that function. However, older versions require using an add-in for that.
- You need an internet connection to connect to the maps online or to get data from the web and insert them into the maps.
- If you don’t provide high-level information about your location, Excel might not recognize the place. Map charts don’t support specific details like street address or coordinates.
- Map charts don’t support multi-dimensional displays. You can not do that without the 3D Map feature of Excel. It allows one-dimensional only.
Recommended Resource: All US States Zip Codes & Counties Population List
3. Someka Excel Zip Code Map Generators for US! How to Use it?
Thankfully, ready templates exist for us users. If you do not have one of the latest versions of Excel or you are having issues with using add-ins, a template will generate the zip code map for you. Don’t worry about finding the map section in the worksheet; use the template and make things quicker.
Let’s get everything straight to create Excel Heat Map for US Zip Codes.
Someka US Zip Code Heat Map Generator is a customizable Excel template created for converting data into heat maps by zip codes. It is available for all 51 states of the USA, plus Washington DC.
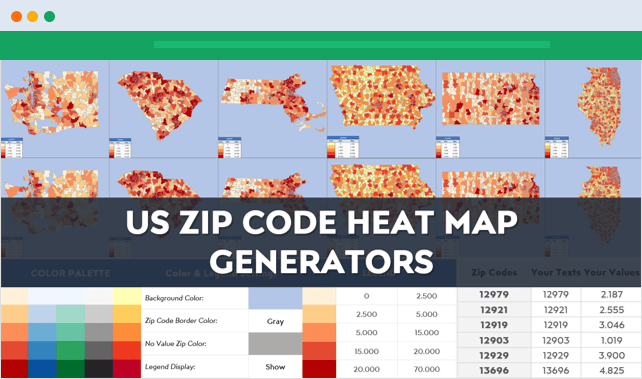
The working logic of the template is basically taking your data and giving it back to you visualized in a heat map shape. It creates color-coded maps over ZIP codes according to the color value you determine.
See how you can use the template following the right steps.
Step 1: Determining the data
Before starting to adapt your data into the template; you need to arrange them according to the template. You need to sort your data in Excel.

Enter your data into a worksheet, select the cells with data, right-click and select Sort > Smallest to Largest.
Step 2: Put your own values into the data section
The template consists of three main sections: map, data, and settings. You start building your territory map by inserting your relevant data. There are “zip codes”, “texts” and “values” columns in the data section, where you are expected to enter your own data.
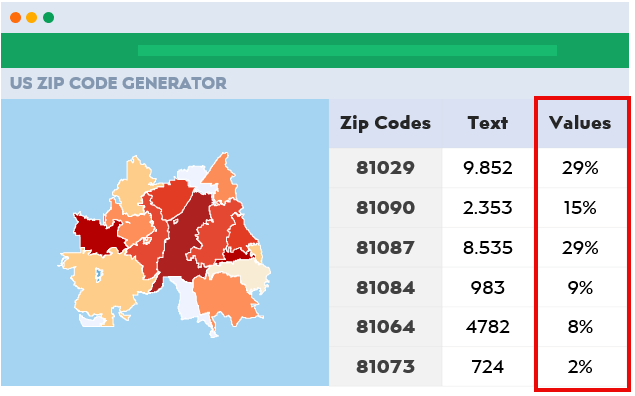
You can do that either manually or by copying and pasting from other sources. Write the values you have; then you can move onto the next step.
Step 3: Choose your limits for painting in the settings part
So, to adjust the appearance of the map, the template has color options in the settings section. The map arranges the colors from light to dark according to how you determine limits. First, you choose which color range you will use for the map.
Then , go to the color palette and select what you want. On the right next to the palette, you will see the data range section in which you determine limits. Also in this box, you set your minimum and maximum limits. Each range corresponds to the tone of the selected color.
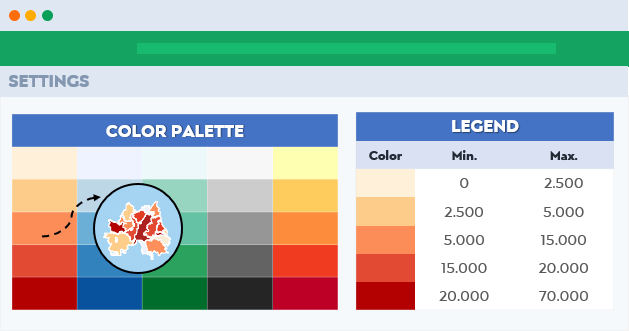
Lastly, the tool automatically looks for in which data range your values stand, and visualizes the relevant zip codes in the corresponding color tone. As the value grows, the color gets darker. For instance, values in between 0 and 300 would be light blue, and the range 600-900 would be much darker, and so on.
Step 4: Customize
Again, a great feature of this template is that it allows users to edit their map as they want. You can do your customizations by changing the preferences in the settings part.
1. Color palette
Firstly, under the color palette, there are five different options available. Choose the one you want by clicking “select” under those colors. Additionally, you can create your own color palette if you don’t prefer to use the existing ones.
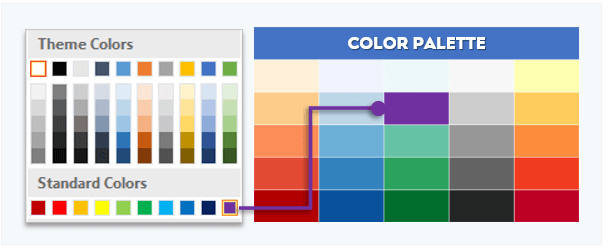
So, to do that, click the cell you would like to change, go to the tab above and choose from the colors. Then that cell will be filled with the color you just chose. Once it is filled with the new one, click on “select”.
2. Color & Legend Settings
If you want to make more changes about color, you will find the “Color & Legend Settings” box at the left bottom in the settings section. Here you can change the background or zip code colors, and also choose the legend appearance.
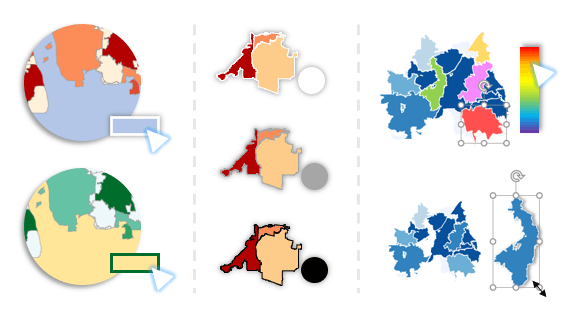
- First, to change the background color, fill the cell with the color you prefer.
- Then, to change the zip code border color, select from the drop-down menu next to it either white, grey or black.
- Also, under the zip code border color, no value zip color places. This color will be displayed on the zip code area where there is no value in the data section. You can change it in the same way as changing the background color.
- Lastly, the last part in this box is the legend display. So, there are two options under the drop-down menu: show or hide. If you hide, the legend won’t appear on the map created.
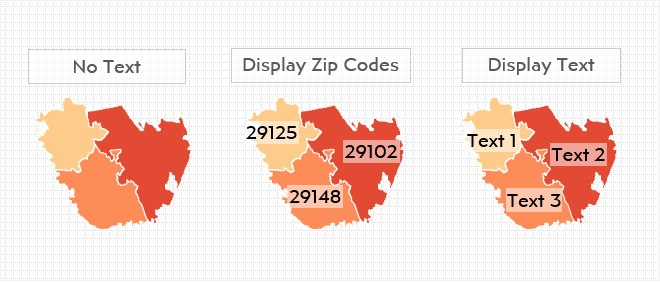
3. Text Settings
Here you choose what to display in the zip code area. If you select no text, then on the zip code areas in the map there will be only colors. Display zip codes will show the default zip codes and the display text option will show your own texts that you put in the data section in the first place.
After arranging all your data and making your customizations, the only thing left is to run the template. Click on “paint” and your heat map will be built instantly.
4. Additional Benefits of The Excel Zip Code Map Template
Within the template, you will have instructions that guide you along the way. You can turn on or off these instructions if you prefer. Another advantage of this template is that it allows you to use colored maps outside of the template as well.
>> Download US Zip Code Heat Map Generator
You can export the info to PDF, or copy and paste them into a PowerPoint presentation. Feel free to use these editable maps as variably as you want.
5. FINAL WORDS:
So, we have covered how to map zip codes in Excel, and also how it is possible within a ready-to-use Excel template. Despite the limitations of Excel itself, you can benefit from Excel by using the templates and reach excellent results. The advantages of Microsoft Excel are countless if you manage to use it properly.
Recommended Readings:
What is a choropleth map? Definition, Examples & Tools
How to Make Geographic Heat Map in Excel? With Simple Instructions
Related Posts


