The US state California (CA) is the 1st largest state by population and 3rd biggest state by area. California has 58 counties ranking it the 27th state with the most counties in USA. See below some basic information about the state:
| Country: | United States |
| State: | California |
| Abbreviation: | CA |
| Capital: | Sacramento |
| Largest City: | Los Angeles |
| Population: | 39,512,223 |
| Population rank in US: | 1st |
| Total Area [mi²]: | 163,696 |
| Total Area [km²]: | 423,970 |
| Area rank in US: | 3rd |
| Number of Counties: | 58 |
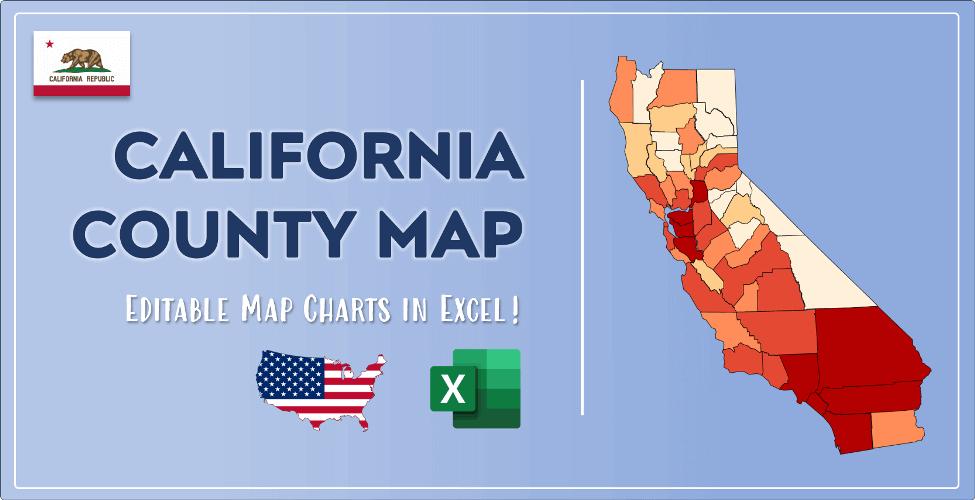
If you want to show data distributon per geographical area, density maps (or heat maps) are a great way to achieve this. For example, here is a California Population Density Map per County:
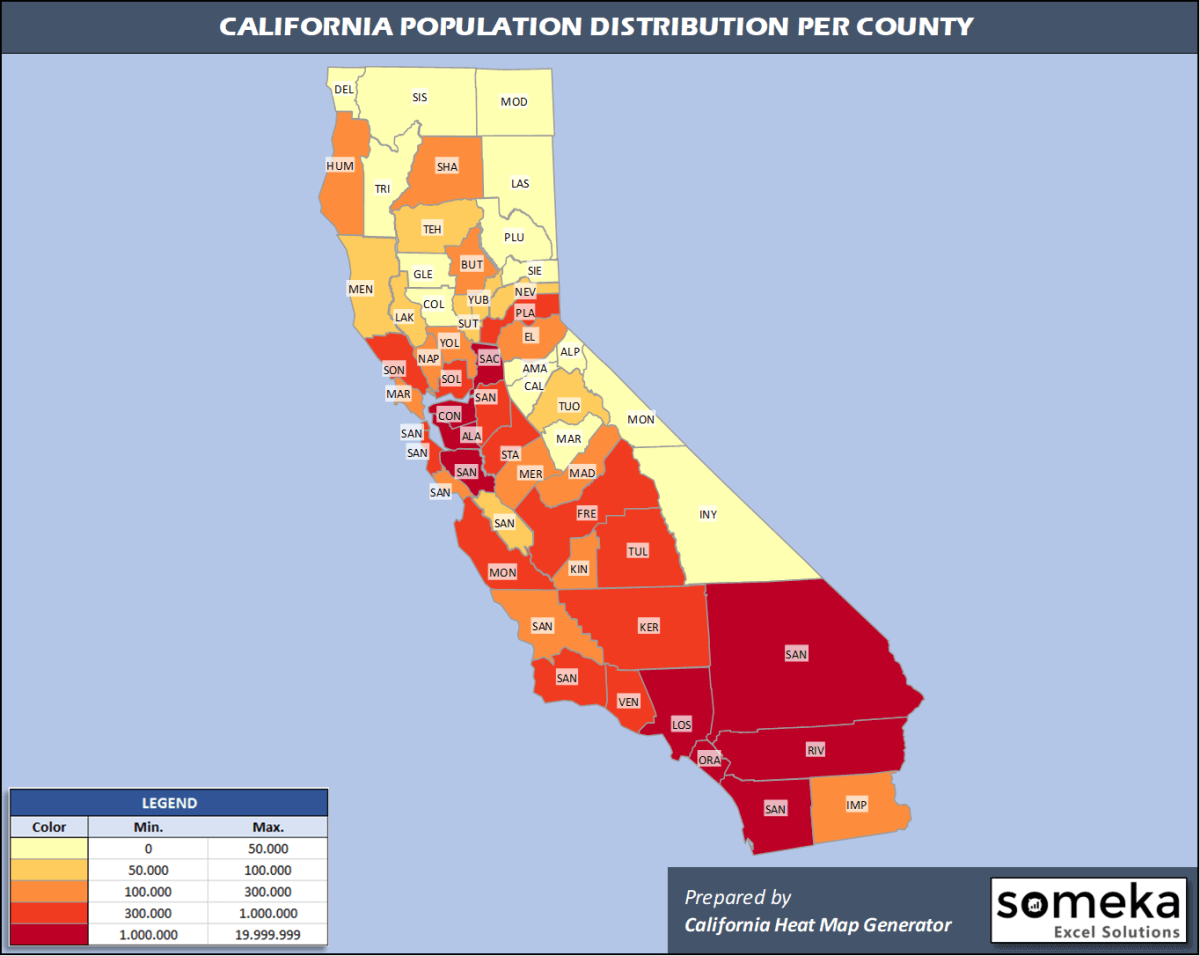
We have prepared this easily with California County Heat Map Generator for population info. But it can also be used for many different data types such as employment rate, average temperature, racial distribution and so on.
Below are 58 California counties ranked by population information. The data is from the US Census Bureau. You can copy and paste this list directly into your spreadsheet.
(Top 10 counties shown. To expand the list, simply click on the “show more” button)
| Rank | County | Population |
|---|---|---|
| 1 | Los Angeles County | 10,039,107 |
| 2 | San Diego County | 3,338,330 |
| 3 | Orange County | 3,175,692 |
| 4 | Riverside County | 2,470,546 |
| 5 | San Bernardino County | 2,180,085 |
| 6 | Santa Clara County | 1,927,852 |
| 7 | Alameda County | 1,671,329 |
| 8 | Sacramento County | 1,552,058 |
| 9 | Contra Costa County | 1,153,526 |
| 10 | Fresno County | 999,101 |
| 11 | Kern County | 900,202 |
| 12 | San Francisco County | 881,549 |
| 13 | Ventura County | 846,006 |
| 14 | San Mateo County | 766,573 |
| 15 | San Joaquin County | 762,148 |
| 16 | Stanislaus County | 550,660 |
| 17 | Sonoma County | 494,336 |
| 18 | Tulare County | 466,195 |
| 19 | Solano County | 447,643 |
| 20 | Santa Barbara County | 446,499 |
| 21 | Monterey County | 434,061 |
| 22 | Placer County | 398,329 |
| 23 | San Luis Obispo County | 283,111 |
| 24 | Merced County | 277,680 |
| 25 | Santa Cruz County | 273,213 |
| 26 | Marin County | 258,826 |
| 27 | Yolo County | 220,500 |
| 28 | Butte County | 219,186 |
| 29 | El Dorado County | 192,843 |
| 30 | Imperial County | 181,215 |
| 31 | Shasta County | 180,080 |
| 32 | Madera County | 157,327 |
| 33 | Kings County | 152,940 |
| 34 | Napa County | 137,744 |
| 35 | Humboldt County | 135,558 |
| 36 | Nevada County | 99,755 |
| 37 | Sutter County | 96,971 |
| 38 | Mendocino County | 86,749 |
| 39 | Yuba County | 78,668 |
| 40 | Tehama County | 65,084 |
| 41 | Lake County | 64,386 |
| 42 | San Benito County | 62,808 |
| 43 | Tuolumne County | 54,478 |
| 44 | Calaveras County | 45,905 |
| 45 | Siskiyou County | 43,539 |
| 46 | Amador County | 39,752 |
| 47 | Lassen County | 30,573 |
| 48 | Glenn County | 28,393 |
| 49 | Del Norte County | 27,812 |
| 50 | Colusa County | 21,547 |
| 51 | Plumas County | 18,807 |
| 52 | Inyo County | 18,039 |
| 53 | Mariposa County | 17,203 |
| 54 | Mono County | 14,444 |
| 55 | Trinity County | 12,285 |
| 56 | Modoc County | 8,841 |
| 57 | Sierra County | 3,005 |
| 58 | Alpine County | 1,129 |
Out of the 58 counties in California, Los Angeles County is the largest by population. San Bernardino County is the largest by land area.
Alpine County is the smallest California county by population. San Francisco County is the smallest by size.
In terms of economics and average income level, Santa Clara County is the richest California county.
El Dorado County is the poorest California county.
We have prepared California county density map by population as a downloadable PDF.
You can download the PDF for free from the link below:

California County Density Map PDF
Check the video below to see how we use our California County Map Excel Template to visualize any data over California counties.
We have built the easiest California Heat Map Maker in the universe! It works fully in Excel:
Here is a list of useful links which we think can be helpful whether you work on data visualization or make research about California state and California counties.
Data Source for Population and many other US related data:
https://www.census.gov
Wikipedia Page for List of California Counties:
https://en.wikipedia.org/wiki/List_of_counties_in_California
Official Website of the State of California:
https://www.ca.gov
Are you looking for California Zip Code map?:
California Zip Code Heat Map Generator in Excel