
How to Prepare a Financial Plan for your Mobile App Idea?
The title can seem a little bit of overwhelming to someone who wants to get into the ‘business’ of mobile apps. However, you do not have to be a professional app designer or an experienced entrepreneur to become involved in the mobile app sector. It does not have to be an industry which you need to be scared to get in. Let’s dive into how to prepare mobile app financial plan.
In this blog post, you can find detailed information about the aspect of financial planning in designing and making a profit from mobile apps. And perhaps, the first thing you need to know on this subject is that you do not need a financial expert or a business analyst to conduct these processes. You can do feasibility studies, profitability researches and establish the methods of purchases just by yourself.
Table of Contents
1. General Overview of Mobile App Industry
2. Feasibility and Profitability of Mobile Apps
- Financial Statements
- Break-Even Analysis
- Profits Trend Report
- Downloads
- Revenue Details
- Commissions
- Salaries
Everyone is on their phones in today’s world. You cannot function properly without a phone. Your banking information, your personal identifying details, your life in general are inside that technological device. That means that your money, your most personal information, your social life can all be accessed through the applications located in your phone. So, the question becomes: How can your business profit from the mobile apps you can create? Let’s look for answers while giving some statistical information on really how much time everyone spends on their phones.
In the dynamic world of mobile applications, where innovation sets the course for success, businesses are constantly seeking effective strategies to stay ahead of the competition. So it is highly important to calculate how much does it cost to make an app.This will be a benchmark also for comparing the cost of outsourcing app development.
General Overview of Mobile App Industry
Firstly, let’s check the basic dynamics of mobile app industry. We’ll look at two main aspects. The first is the demand aspect, where we’ll look at the total time spent by the users. And the second is the supply aspect, where we’ll check the competition.

-
Demand in Mobile Apps: Spending Time with Mobile Devices
Yes, it does not come as a surprise that we spend the most amount of time on our phones for almost every activity: When we play games, when we watch entertainment, when we read, when we look at the news and etc.
This can be seen via a report by Mary Meeker that shows adult users in the United States spend almost 4 hours per day on their mobile devices. You might think that they use their desktop or laptop devices or their television screens more; but you would be wrong. An adult United States citizen spends only 2 hours on their desktop or laptops. This is a clear demonstration that people turn towards their phones in order to spend more time on the Internet than their computers.
And if you look at the time spent on the mobile internet (let’s say 4 hours), it is estimated that 88% of it is spent in mobile apps, according to a study conducted by eMarketer. People (and users) not only use apps, but they need apps. Therefore, a business might not thrive as in their revenue or profit, if they did not optimize a functional app for their company. Additionally, it is not enough to make your website suitable for mobile devices; you are going to need a mobile app if you want to reach as many as users you want.
-
Supply in Mobile App Industry: Counting the Apps
Let’s do a test. Take out your phone if you are reading this from another device or just get to the main page on your phone if you are reading this from your phone… which is the more likely option. Count the apps you have downloaded (excluding the ones that came with your phone). Statistically speaking, on average you have more than 10 and less than 40 apps on your phone. This shows that you have to always compete with other apps on your user’s or customer’s phone.
There are more than 3 million apps on each of the platforms in Google Play Store and Apple App Store. But keep in mind that this is not a situation against your desire to create and operate an app. On the contrary, think of this situation as ‘there are many fish in the sea’. You can always stand out amongst other apps, if you manage a proper financial plan for your mobile app.
Feasibility and Profitability of Mobile Apps
If you want to create an app, publish it and make money out of it, you need to follow a few steps. In addition to these steps, you need to arrange and manage your finances as well. Hence… a financial plan for your mobile app. Let’s divide this plan into three main categories:
- A. Revenue
- B. Costs
- C. Reports
A) Revenue in a Mobile App Financial Plan
The first question you can ask yourself is ‘How am I going to make money from a mobile app?’. And the answer to this question is your revenue options, channels and opportunities. These can be the money you make from a priced app; the in-app purchases your users make or subscriptions they buy. Let’s list these one by one before going into income details and sales projections of your mobile app revenue.
Your Apps: Your company can create app(s) to suit the needs of their customers. For example, you are working in a company that specializes in building mainly a navigation app. On top of that single app, your company also develops a weather app and a maps app to go together with the navigation one. Users can easily integrate one into another and switch between them in ease. You can also add a ‘lite version’ of the main navigation app which is more basic yet less in size.
Platforms You Can Put Your Apps Into: Of course, the two main platforms you should (and need to) put your apps in are Google Play Store and Apple App Store. However, keep in mind that they are not the only ones. There is also Samsung’s own app store which is called Samsung Galaxy Apps. There are LG’s and Huawei’s own and unique stores as well. And additionally, of course always, Amazon has its own Amazon Appstore for Android to more easily connect your Amazon devices with your Android phone.
It is also important that the more platforms you put your app(s) into, the more commission you are going to pay to the respective platforms. You can find more details for the commission costs of platforms later in this blog post.
Other Revenue Types
In-App Purchases: These purchases can be additional items users can buy through your app. Or features that they pay money to in order to make their user experience more comfortable. Removing ads, adding a night mode, accessing an archive or even extra ‘hearts’ or ‘tries’ in mobile games can be counted as examples to in-app purchases. These are not the main channel for revenue; but they can be. Because they are incredibly important especially for ‘freemium’ apps.
Subscriptions: It is highly likely that you have a subscription for one of the major apps on your phone. This can be Spotify for music, Netflix for entertainment, LinkedIn Pro for additional features or Amazon Prime for… bunch of stuff! You can also provide your users different packages such as Silver, Golden and Platinum; and offer different and special features for each of them. If you choose to offer more than one package, you will need to include their sales projections into your revenue calculations as well.
These are the basic items you need to first estimate and then, calculate in order to see if you can make a profit out of your mobile app(s) or not. And this process needs to occur before you publish any of your apps. This process can be done even before you have created your app! Because what you want to do is to create a financial plan. This financial plan is going to help you look at ‘the big picture’ for your mobile app(s) if this whole endeavor is worth your time and money. And if it is worth it, this will show you how much you can and might make with these apps. So, let’s start ‘projecting’!
Projections, Assumptions and Examples
This chapter and its subsequent sub-chapters are going to be about all the factors, elements and the little details that can go unnoticed. And there are a lot of details which can go unnoticed while you are developing your app(s) and doing feasibility studies. Because all of these factors actually affect the revenue side of your mobile apps one way or another. And a positive financial impact is the result that you strive for while creating an app. Let’s look at some of the aspects that will be taken into consideration:
- Projections for pay per download model
- Calculations of customer retention
- Number of active users
- Parameters for ads income models
- Sales estimates for in-app items and purchases
- Price adjustments for subscriptions models
- Other non-standard income items
1. Downloads
To calculate your revenue regarding the number of downloads for your app, first, you need to understand the pay per download model. (It is sometimes written as pay-per-download and also abbreviated as PPD.)
Pay Per Download Business Model
This model is the monetization of downloads of anything including mobile apps. Now, there are a couple of different ways for you to make money from downloads.
The first to do it is to charge users to download the app. This priced app method can work if your app can deliver what it has promised to users. Otherwise, if people pay for a mobile app and they are disappointed, they will share their bad experiences and comments on their social media platforms.
The second way you can monetize the download of an app is making the user ‘unlock’ a feature in the app by completing a survey, quiz or a form. This process can be making the user watch a video clip or the video itself as well. This is familiar to those who use YouTube or those who are forced to watch mobile game ads in their free apps. This is the easier way for you to make money from free apps; yet at the same time, it can also turn into a frustrating experience for your users.
Download Projections
Now that the pay per download business model is covered, you can start writing down your projections for downloads of your app. As it was mentioned above in the previous chapters, let’s continue with the example of four apps: a navigation app, its lite version, a weather app and a maps app. And keep in mind that only the main navigation app is priced at $6 for Apple App Store and $5 for Google Play Store.
The download projections for each app and for each platform can and will differ. While preparing this financial plan, you can look at other apps’ numbers and the number of total users for each of the platforms. This method became a kind of ‘best practice’ as in the standard way of forecasting download figures. After that, you can estimate your own download projections as in units.
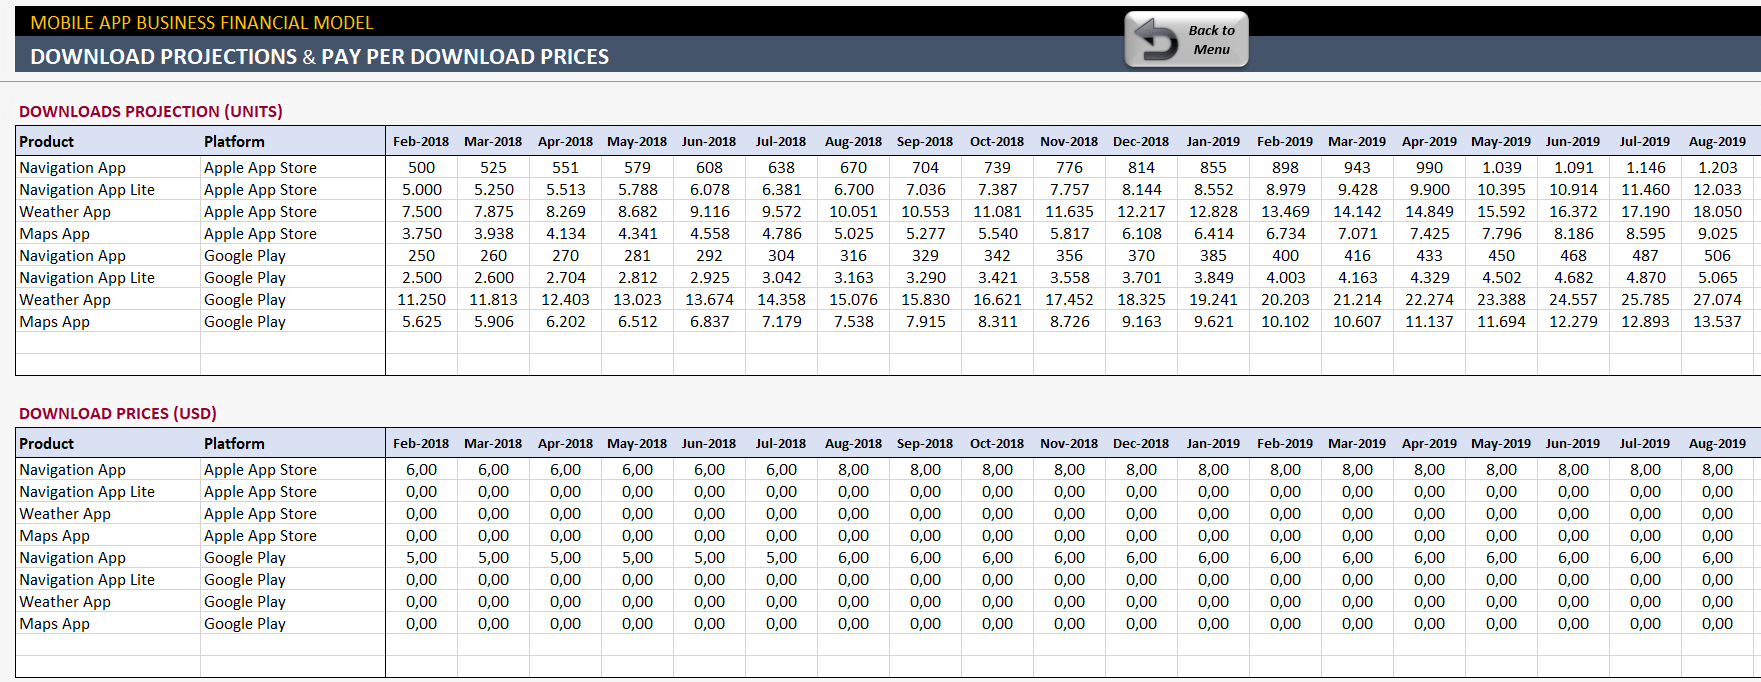
– This is the Download Projection section of Someka’s Mobile App Financial Model Excel Template –
In order to accurately calculate the revenue from the apps, make sure that you list each of the apps with its unit price. Additionally, as you can see with the increase of prices as months go by, these unit prices can change according to the rise or decline of your sales numbers.
Revenue is the result of the unit price times the number of downloads. That is why it is important not to initially write down your revenue projections for each of the apps. This way you can manage the changes in the unit prices and the increase or decrease of your download numbers in a much easier way.
2. User base
You need to evaluate your user base in terms of customer retention rate and monthly active users. The retention rate of your users consists of the number of users who actively continue to use the app after a month. This number is crucial for the success and the reach for your apps. If your company and your app(s) are active in terms of new products, content or features, then your user base needs to be active as well.
-
Average Monthly Retention Rate
For example, at the beginning of the month 100 people download your main navigation app from each of the app store platforms. At the end of the month, if you see that 80 of those 100 still actively use the app, that means your retention rate is 80%. But… is 80% too high of a number? What is the average?
As you can see from the line graph, different industry apps tend to give different results yet the difference is not quite apparent. As for ecommerce apps, if your retention rate stays at 25% after a month, it means that you are one of the average apps. If your ecommerce app’s retention rate stays around 30%, that means your app is doing great.
You can attract and make people download an app on their phones; however, the thing that will make you money and reach more people is maintaining them in the app. The app cannot grow in terms of users, if the ones that had downloaded the app are not using it. Now, the question becomes: ‘How can you increase your monthly active users?’
Press or advertisement done in the correct way and through correct platforms can help you increase this number. Also, constantly updating the app can bump your monthly active user numbers.
-
Cumulative Active Users
Analyzing monthly active users should not divert you from evaluating and noting your calculations of cumulative active users as well. Of course, you can operate and make your profit from month to month, but realizing your total number of active users for each of the apps can become quite useful.
3. Ads in a mobile app financial plan
Even if your apps are free; you do not have any in-app purchase options, you can still make money from featuring ads in your apps. And if you do have priced apps or in-app purchase options, then the ad revenue becomes an additional source of income.
-
Parameters for Ads Income Model
First, separate the apps that feature an ad and those who do not. Then, note how many times a typical user opens up your app in a month (sessions per month). You can also write down the average time (as in minutes) a typical user spends per session. After that, decide on a number on how many times you want to show an ad in a minute of usage. This is called an ‘ad impression’.
While you are looking for advertisers or while the advertisers are contacting you to put their ads in your apps, always decide upon a CPM. This is Cost Per Thousand (or Mille). The advertisers can have their figures already lined up because this CPM comes out of their pockets. CPM shows the amount of money that they are willing to pay for a thousand impressions in your app. If you are a new app developer or a fresh start-up, it can be hard to ‘charge’ advertisers for large amounts of money. That is why it can be informative and actually help you build business relations to ask for the advertiser’s CPM first.
After you decide on the CPM, you can figure out the monthly ad revenue you can get per user on your app. Below, you can find an example on ads income model parameters featuring the four apps mentioned before in this blog post:
You can also calculate cumulative ads revenue by using the number of cumulative active users from the ‘downloads’ section of the blog post.
Recommended Readings:
Recommended Reading:
How to use Excel for E-commerce Business?
4. In-App Purchases
In-app purchases can be thought of as ‘offers’ that apps provide to their users while using the app. In recent years, the mobile app industry numbers show that users actually prefer free apps with ads or free apps with in-app purchases. The reason for that is actually quite simple: Because they do not want to pay in order to buy an app. And even though the ads or the in-app purchase offers can be confusing, frustrating and flat out spammy, they actually tend to interact with them.
According to a study done by Invesp, (in 2017) in-app purchases make up 48.2% of the mobile app revenue for app developers. Beating out ads revenue which is in 14% and priced app downloads which stays in 37.8%. That means although they seem frustrate users, they seem to work as well!
You do not have to include in-app purchase options into all of your apps or even into your financial plan. But if you do, you can make additional revenue as seen by the statistics. You can create projections tables for in-app items that you are selling and their unit prices:
As with each of the revenue channels, you can also calculate the cumulative revenue you can get from the in-app purchases of in-app items.
5. Subscriptions
Apps, websites and services which use this subscription model are everywhere… for a reason! They are all using or transforming their business into using this model because it has far too many advantages:
- It helps to build a trusting relationship between the customer and the company.
- It makes the customer appreciate the service they are getting. Because they experience every period that what they are paying is worth to the service that they are getting.
- It is a much safer source of income due to the fact that you are getting paid periodically.
- It creates a situation from time to time to offer discounts to new users.
– This is the Download Projection section of Someka’s Mobile App Financial Model Excel Template –
-
Apple Approves the Subscription Model!
Apple takes a 30% commission fee from the apps featured in their App Store. So, their revenue model to app developers is 70/30. However, they encourage apps to follow a subscription model and if they do, they actually increase the net revenue of the subscription to 85% (after the user paid their subscription for one year). That means Apple likes this subscription method that much, they actually adjust their revenue model for app developers to 85/15.
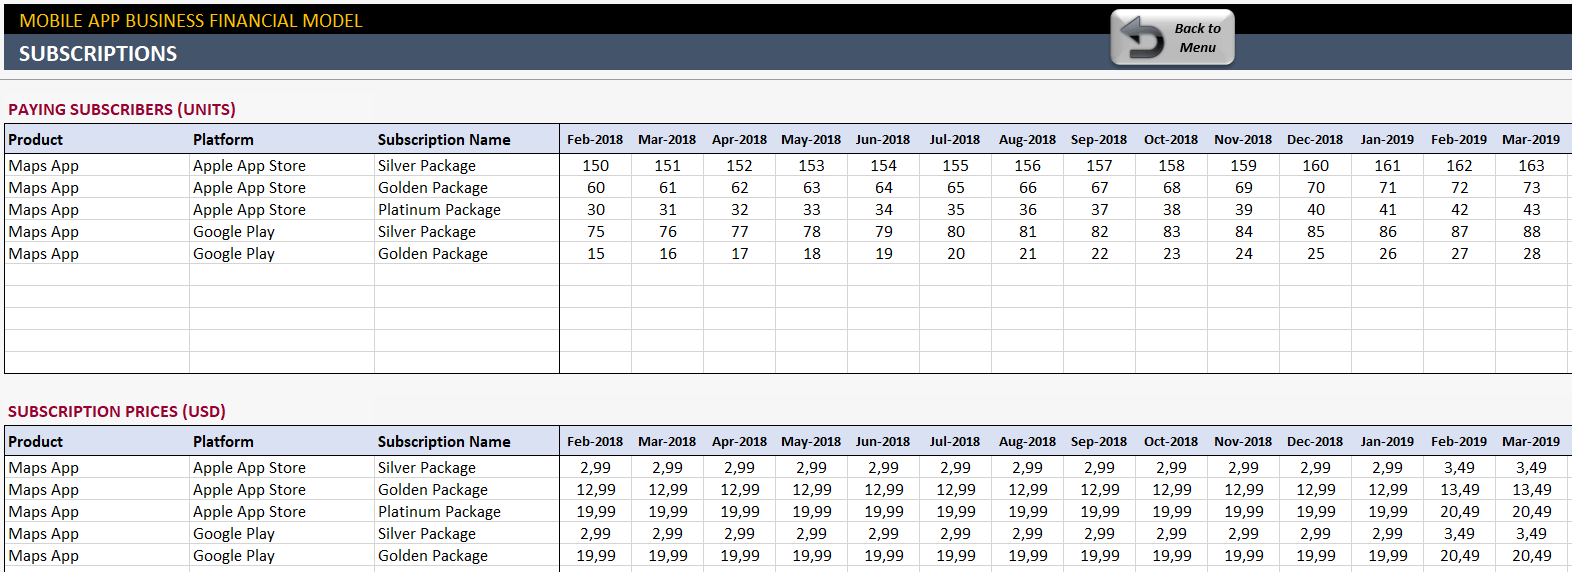
You can create a table for your forecast of paying subscribers for each of the apps you established a subscription method and for each of the platforms. Also, make sure that you always separate the figures for different packages and subscription options in order to see all of the individual numbers.
You can form another table for the subscription prices for each of the different subscription packages as well:
And you can calculate the cumulative subscription revenue which you get from the multiplication of the two tables above:
6. Other Revenue Channels
You have covered the essential revenue models in order to maintain a certain amount of income through your app(s). There are also other, non-standard ways for you to make profit through your apps as well.
These can consist of donations made through the app or directly to you; affiliate marketing campaigns which through collaborations return a commission to you; email marketing launches as a way of advertisement; sponsorship deals; investments and ‘angel investors’. All of these can be put into a table titled ‘other revenue’.
B. Costs in a Mobile App Financial Plan
It can be somewhat difficult to try to pinpoint all of the developmental expenses and the total cost of a mobile app. The mobile app industry became flexible, variable and fast paced. Therefore, there are a lot of factors that affect the cost of it.
To make it easier to understand all the different types of expenses, you can divide them into three separate categories as:
- Variable Costs
- Fixed Costs
- Startup Costs
1. Variable Costs
Variable costs are the production or the purchase expenses. The reason why it is called a ‘variable’ cost is because the higher your sales get, the higher the costs get. A certain percentage of the changeable amount of revenue will always be a variable cost.
The variable costs for your is the expenses that change depending on the app itself. For example, the commission fees each of the platforms take from your sales is a variable cost:
Due to the fact that the commission rate and the ads revenue commission differ from platform to platform, it will be always for the best for your company to list them separately.
In order to make more accurate projections and get more correct results, you can analyze variable costs into three categories as well:
-
Costs Per Download
This is the cost of each download from a platform. The figures you put in here will be directly multiplied with the units of downloads.
-
Costs Per Active User
These are the expenses you have to spend for each of the active users using your app(s). These numbers will be multiplied with the calculations in the cumulative active users’ table.
-
Costs Per Paying Subscriber
The figures here will be multiplied with the number of paying subscribers which you already calculated the projections of it in the revenue section.
2. Fixed Costs
These are expenses that no matter what you are going to pay for. They include employee salary, freelancer wage, developers, managers, hosting, office utilities, etc. The cost of app development is determined by the type of the app, the development’s location, number of platforms and the complexity of the app design.
There is also the distinction between freelance app developers and established app development agencies. Although the cost of freelance developers is much less than agency employees, their trustworthiness and teamwork become shakier as well.
The region which you hire your developers from also can determine the fixed costs and the total cost of your app. The hourly rate for a North American Senior Developer is clearly higher than a Senior Developer residing in Eastern Europe. Furthermore, you can hire two Senior Developers in Eastern Europe for the price for one in North America.
Here is an example table for only the salaries of your employees and workers:
You can also put all of your other monthly expenses such as hosting, platform memberships, office rent and utilities and additional expenses into a table as well:
3. Startup Costs
The startup costs include your ‘one time purchases’ made until your app goes live on each of the platforms. These are not monthly expenses; their purchases are made at the beginning and after the app is published, these expenses are redeemed.
C. Reports of a Mobile App Financial Plan
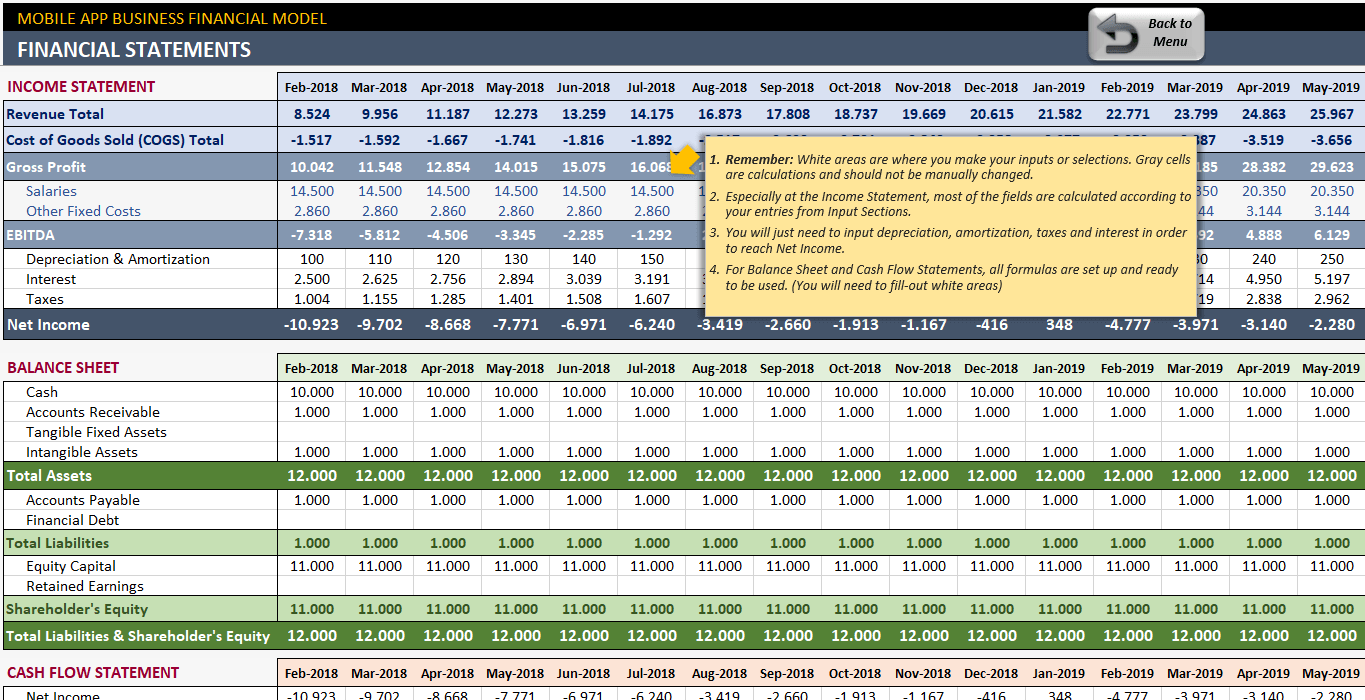
1. Financial Statements
A financial plan should include the three main financial statements: Income Statement, Balance Sheet, Cash Flow Statement.
-
Income Statement
An income statement features the company’s revenues, expenses and the financial performance of the company over a certain amount of time. It deals with the gains and losses of the company. Also, it analyzes how each of the profits are transformed into net income or the net revenue for the company.
If you are using Microsoft Excel, you can bring the revenue of your app by using the SUM formula if you have accurately noted your projections and assumptions. Your fixed costs for each of your apps can be included in the income statement as well.
You can calculate your expenses by allowing a dynamic period for depreciation and amortization accounting processes. It can be a little bit complicated compared to manually putting down the data; however, it can save you time while you are putting together your income statement.
-
Balance Sheet
The balance sheet consists of the assets of the company and the details on how the assets are financed. It can be thought of as the company’s statement of its net worth. The equation it always uses is “Assets = Liabilities + Equity”.
Your balance sheet will feature your company’s assets as well as the liabilities your mobile app has. This means the debts, bank loans, unpaid bills or the financial promises you have made to the investors will be accounted for in this financial document.
If your company (which produces mobile apps) has other shareholders, all of their stakes and ownership of other assets will be detailed in the company’s balance sheet as well.
-
Cash Flow Statement
The cash flow statement demonstrates the summary of all the cash or the equivalents of cash which is entering and leaving the company. There are cash from operating activities, cash from investments and cash from financing activities featured in the cash flow statement.
The cash flow statement is the third mandatory financial report which a company must have with the income statement and the balance sheet.
2. Break-Even Analysis
Break-even analysis examines the amount of fixed costs and compares it to the profit made by each of the units sold. It analyzes if the company can ‘break even’. If you have a low fixed costs number, then it will be easier for your company to break even.
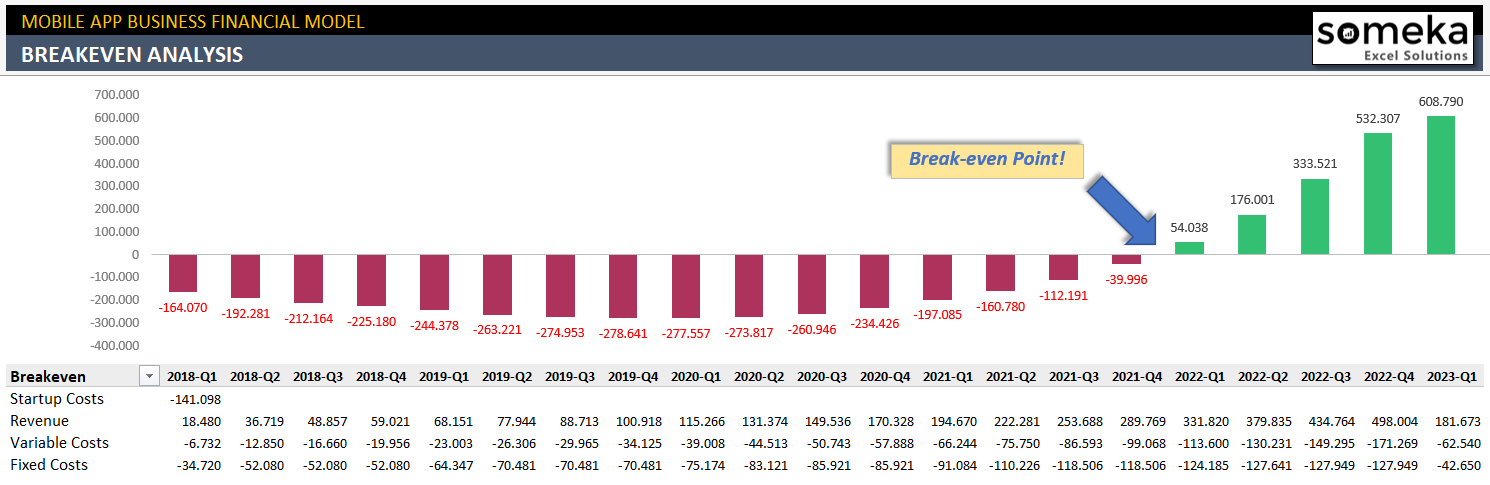
– This Break Even Analysis is from Someka’s Mobile App Financial Model Excel Template –
But you need to determine the variable unit costs as well as fixed costs while evaluating your company’s ‘break-even point’. Then, decide on the unit price for your product (your app in this case). You can create a spreadsheet in order to more easily analyze the break-even point to your app.
3. Profits Trend Report for Mobile App Financial Plan
The profits trend report shows the upward or downward profit trend of a company. An upward trend suggests more profit and a downward one suggests a decrease in profit.
EBITDA is also used as a metric to demonstrate the company’s operating performance. Earnings Before Interest, Taxes, Depreciation and Amortization focuses on the organization’s profitability based on operations and the cash flow of the company.
4. Downloads
The analysis of the downloads for each of your apps in each of the platforms can present detailed information. This projection data can help you adjust and change your financial plan and strategies in general for the future.
5. Revenue Details
You can put in all of the revenue details for each app, for both of the platforms and also, the total number as well.
6. Commissions
You can also create a table of all the commissions you will be paying for your apps. This may include your subscription packages, in-app purchases and their total.
7. Salaries in a mobile app financial plan
You can see every employee’s salary that is on your mobile app development team with this table.
SUMMARY
Creating a mobile app and establishing a financial plan can be tough. But with the technology you have literally ‘in your hands’, it is also very much doable. This blog post consist of getting close to accurate projections, writing down these data and creating tables and spreadsheets. You can also watch mobile app financial plan tutorial to get more info.
You can try achieving this by writing them down on a piece of paper with a pen. Well, let’s say a lot of pieces of paper. But you know, you do not have to. You have incredibly advanced technological devices waiting for you to utilize them in many ways that you can explore.
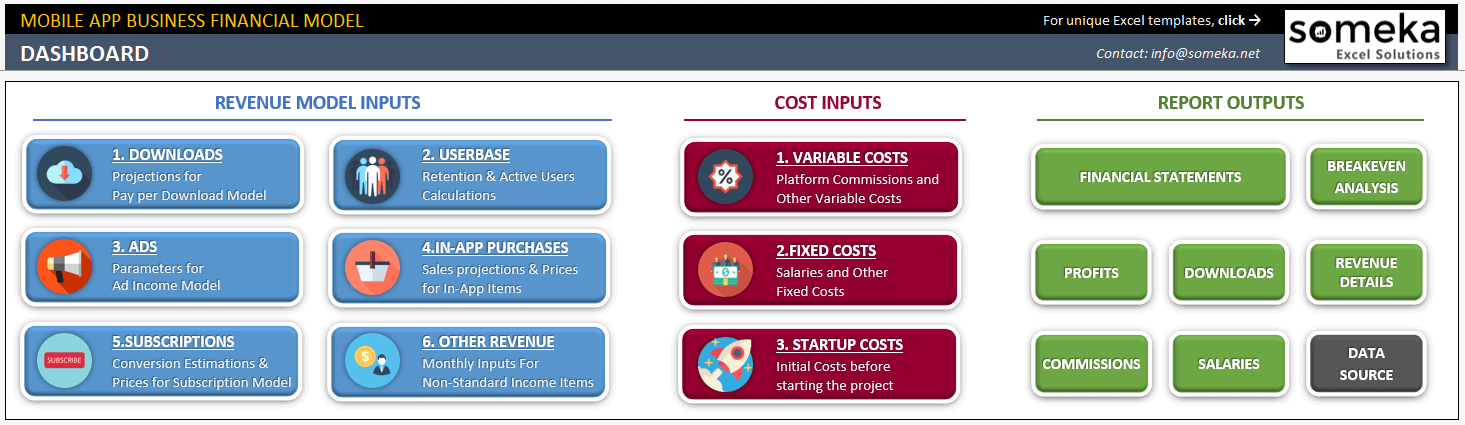
And if you use Microsoft Excel, you might think how you are going to manage all of these different sections. Where to start, right? You can start by downloading a third party template. This template is all special for you to create a financial model for your mobile app.
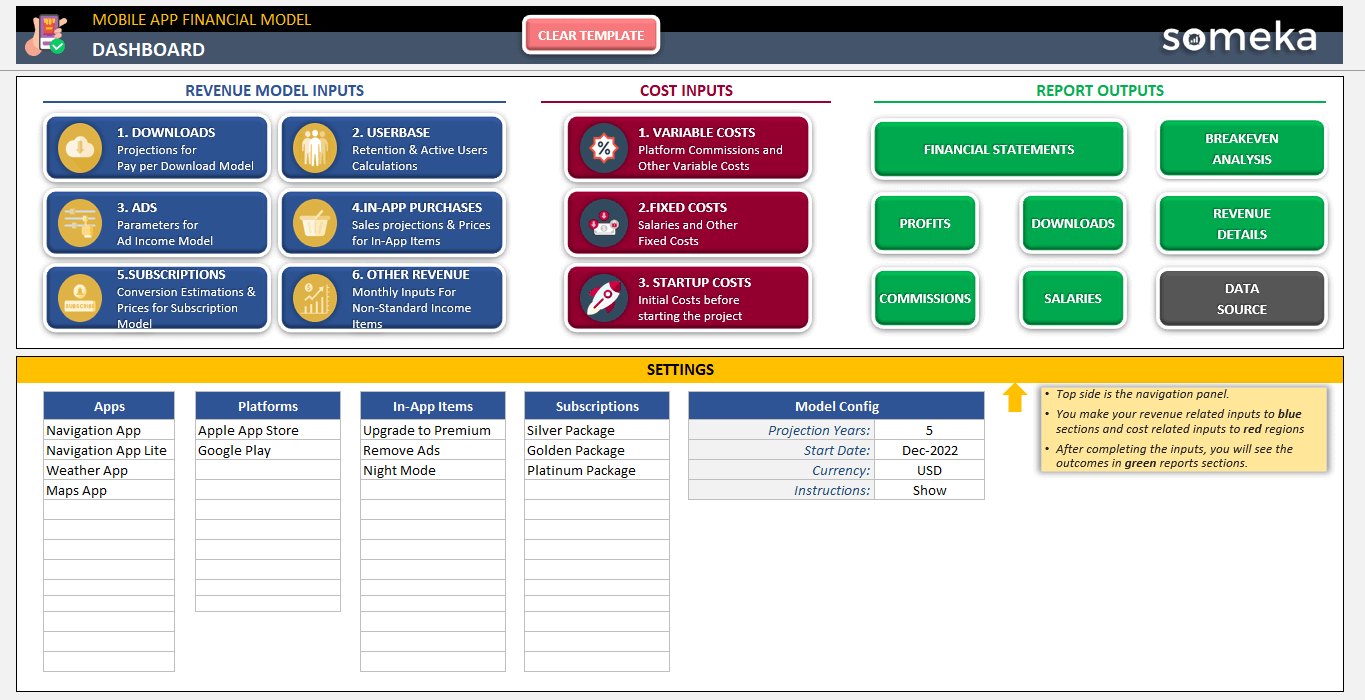
– This is the Menu section of Someka’s Mobile App Financial Model Excel Template –
Someka’s Mobile App Financial Model is not only one of the most comprehensive templates out there. But it’s also incredibly easy to use. You can do everything featured in this blog post, including generating reports for your company and much more! The detailed projection features combined with the innovative reporting system make the most essential tool for you!
Recommended Readings:
How to start a business successfully?
Complete List of Things You Can do with Excel
Why Shoud We Make a Feasibility Study Before Kicking-Off a Business Idea?
Related Posts


