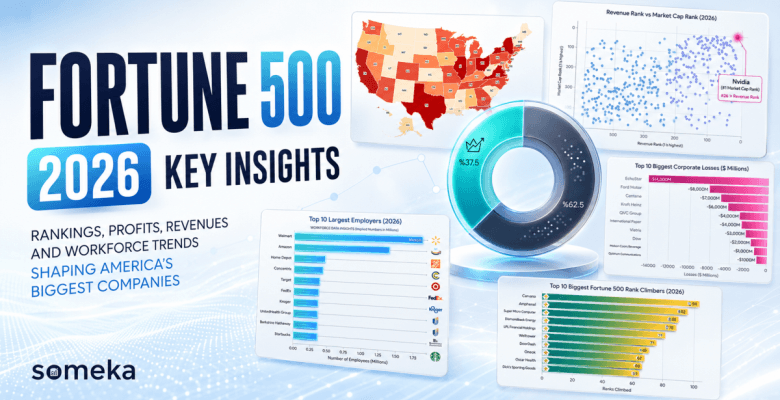
The 2026 Fortune 500 List is Out: 7 Insights You Can’t Miss
The 2026 Fortune 500 list has officially been published, mapping out the corporate titans dominating the American economy. While the sheer size of the revenues is staggering, the raw numbers only tell half the story.
If you dig a little deeper, the landscape of American business reveals some surprising realities about where the real money is made, who is actually employing the nation, and how Wall Street values the future.
Table Of Content
1. The Volume vs. Margin Game (The Profit Gap)
2. Nvidia is Defying Financial Gravity
3. The Employment Paradox
4. You Don’t Have to Make Money to be in the Fortune 500
5. Wall Street Pays for Tomorrow, Not Today
6. The Giant Leaps: It’s Not a Static List
7. Two Completely Different Economies in One List
Before we dive into the deep financial metrics, let’s look at the geographical footprint of these corporate giants.
Where is the Fortune 500 Power Concentrated?
Have you ever wondered which US States host the most headquarters? We mapped out the entire 2026 list to see the distribution of corporate power.
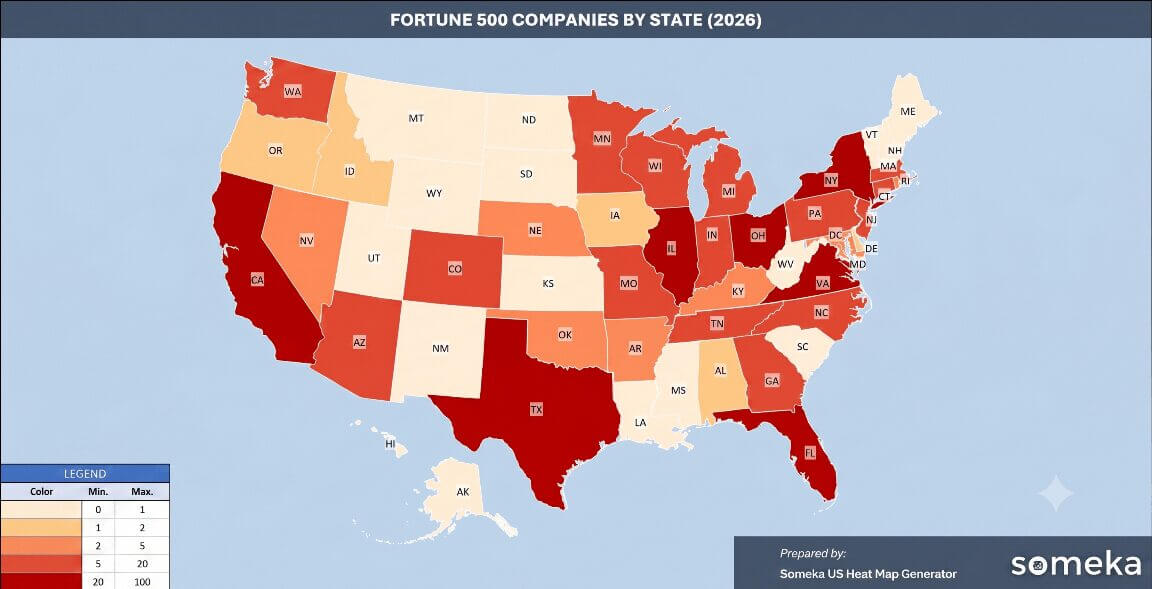
(Created with the Someka United States Heat Map Excel Template)
From the tech hubs of California and the financial centers of New York to the energy capitals in Texas, the concentration of corporate headquarters gives us a fascinating snapshot of the American economy.
First, Let’s Start with the “Biggies”
When we think of the Fortune 500, we immediately think of the undisputed heavyweights. Here is a quick look at how the absolute biggest players are doing:
- Amazon: Takes the crown for top revenue, pulling in an astonishing $716.9 billion.
- Walmart: Right on Amazon’s heels with $713.2 billion in revenue, remaining the ultimate heavyweight in physical retail.
- Apple: Proves that ecosystem loyalty prints money, sitting comfortably with $112 billion in pure profit.
- Alphabet (Google): The actual king of the cash register this year, generating over $132.2 billion in profit.
But what happens when you look past the top 5? We analyzed the data using the Someka Fortune 500 Excel Template and extracted the most fascinating trends.
Here are the 7 insights that will change how you view America’s largest corporations.
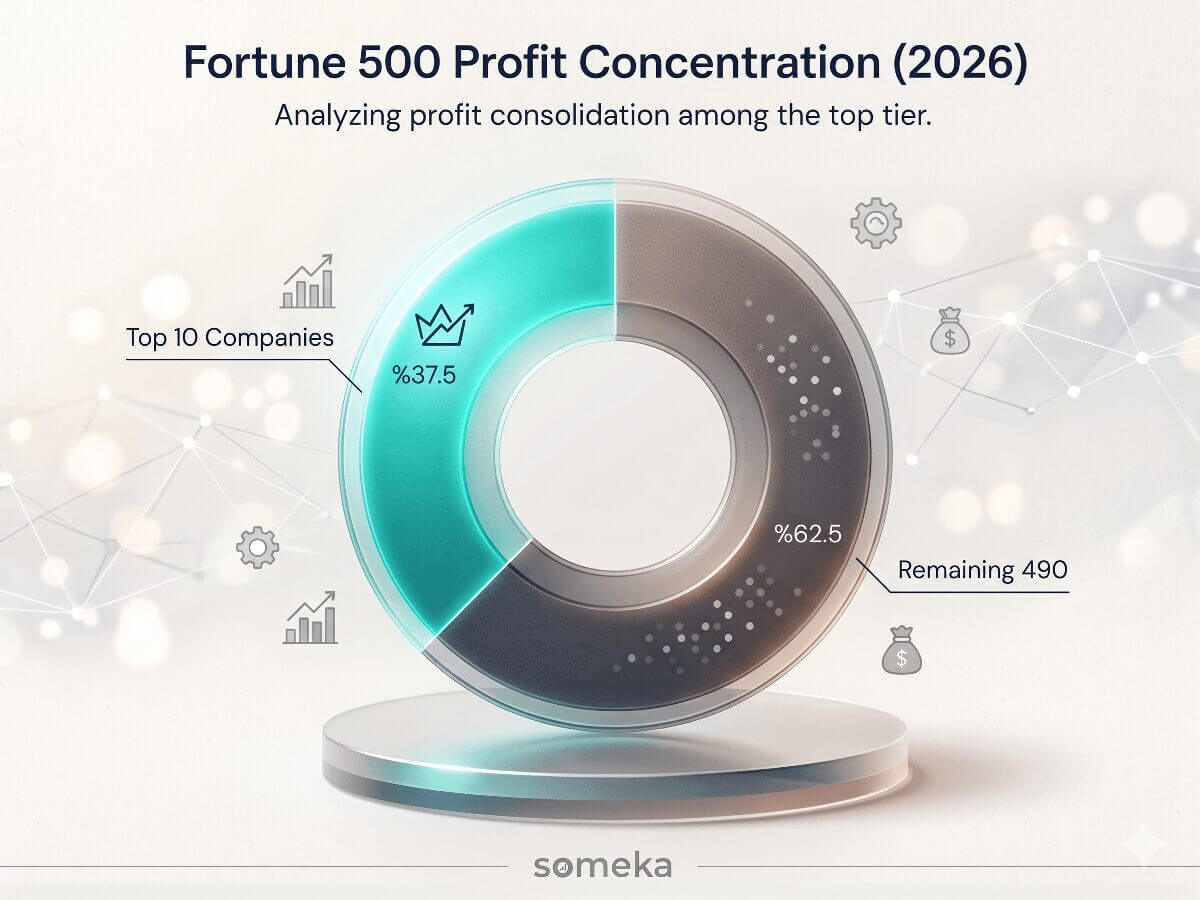
1. The Volume vs. Margin Game (The Profit Gap)
Selling the most does not mean earning the most. While Amazon and Walmart lead the list in total revenue, they are playing a volume game. The tech companies are playing a margin game—and winning.
- Alphabet ($132.2B) and Apple ($112B) crush the retail giants in actual bottom-line profit.
- Out of the 500 companies on the list, the top 10 most profitable companies generate over $780 Billion in profit.
- That means just 10 companies hold roughly 37.5% of the entire Fortune 500’s profits.
Key Takeaway: The corporate wealth gap is massive. Retail giants chase volume, but tech giants capture the actual wealth.
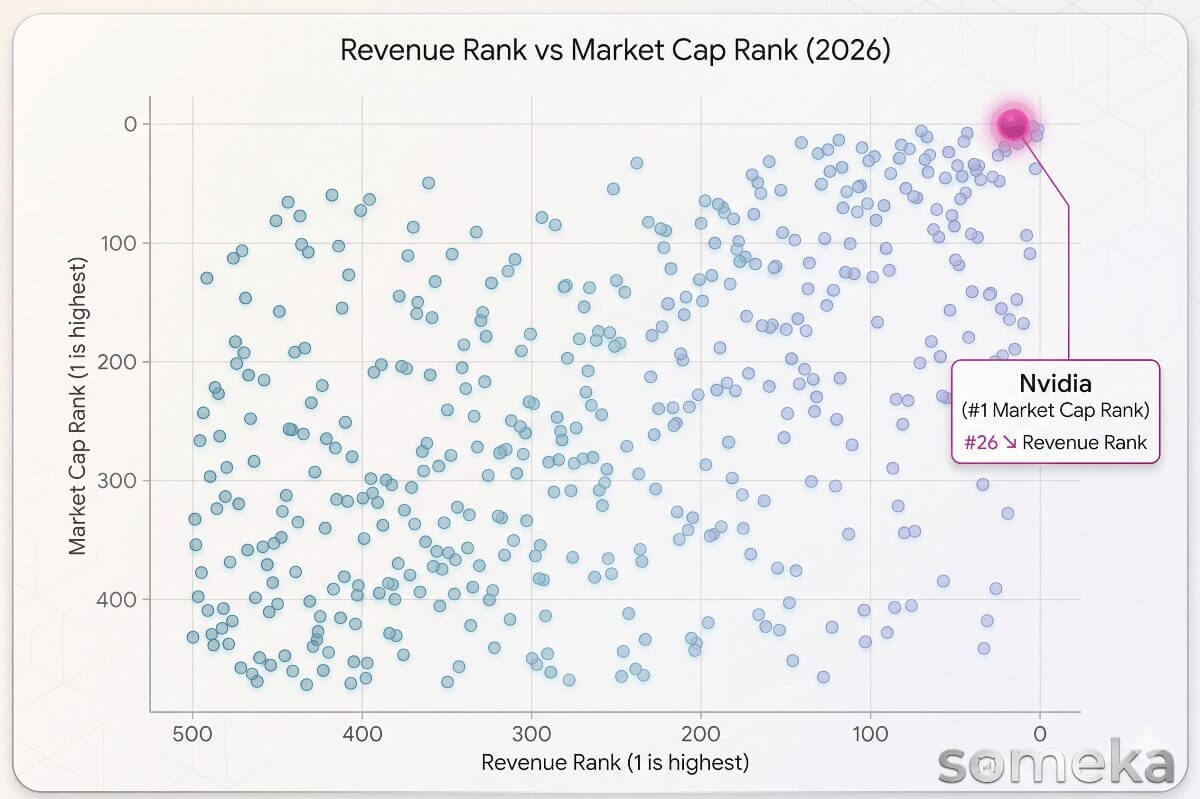
2. Nvidia is Defying Financial Gravity
Nvidia is the ultimate anomaly of the 2026 list. If you want to understand the AI boom, look no further than these numbers.
- Nvidia sits at #16 in terms of total revenue.
- Yet, it is #1 in Market Value, sitting at a staggering $4.24 Trillion.
- The company boasts a mind-bending 55.6% profit margin. For every $100 they make, they keep nearly $56 in pure profit.
Key Takeaway: Nvidia is no longer just a tech company; it is being priced as the foundational infrastructure of the future economy.
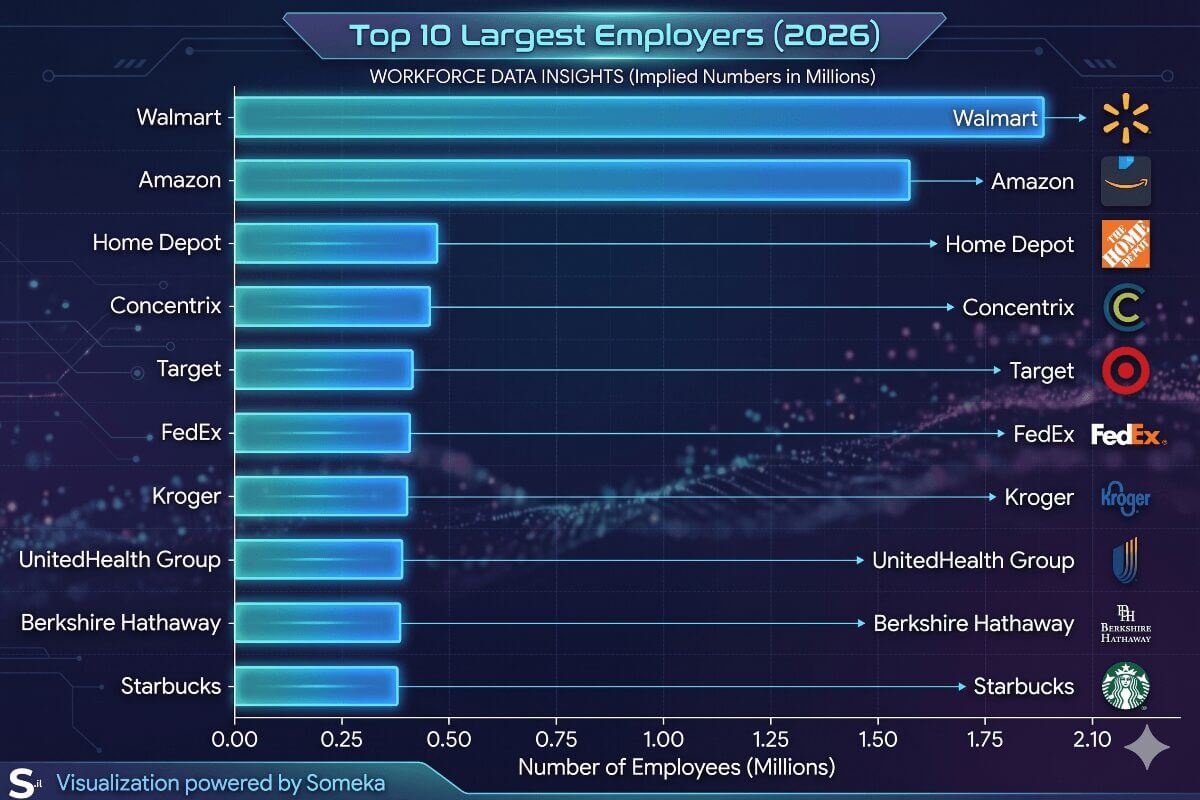
3. The Employment Paradox
Apple and Nvidia might be worth trillions, but they don’t employ the masses.
- Walmart operates like a small country, employing an incredible 2.1 million people.
- Amazon follows with 1.58 million employees.
- Apple, despite its massive profitability, employs only 166,000 people.
- When looking at profit per employee, companies like Cheniere Energy and Nvidia generate roughly $3 million in profit per single employee.
Key Takeaway: Headcount shows the scale of operations, but profit-per-employee reveals the true quality and efficiency of the business model.
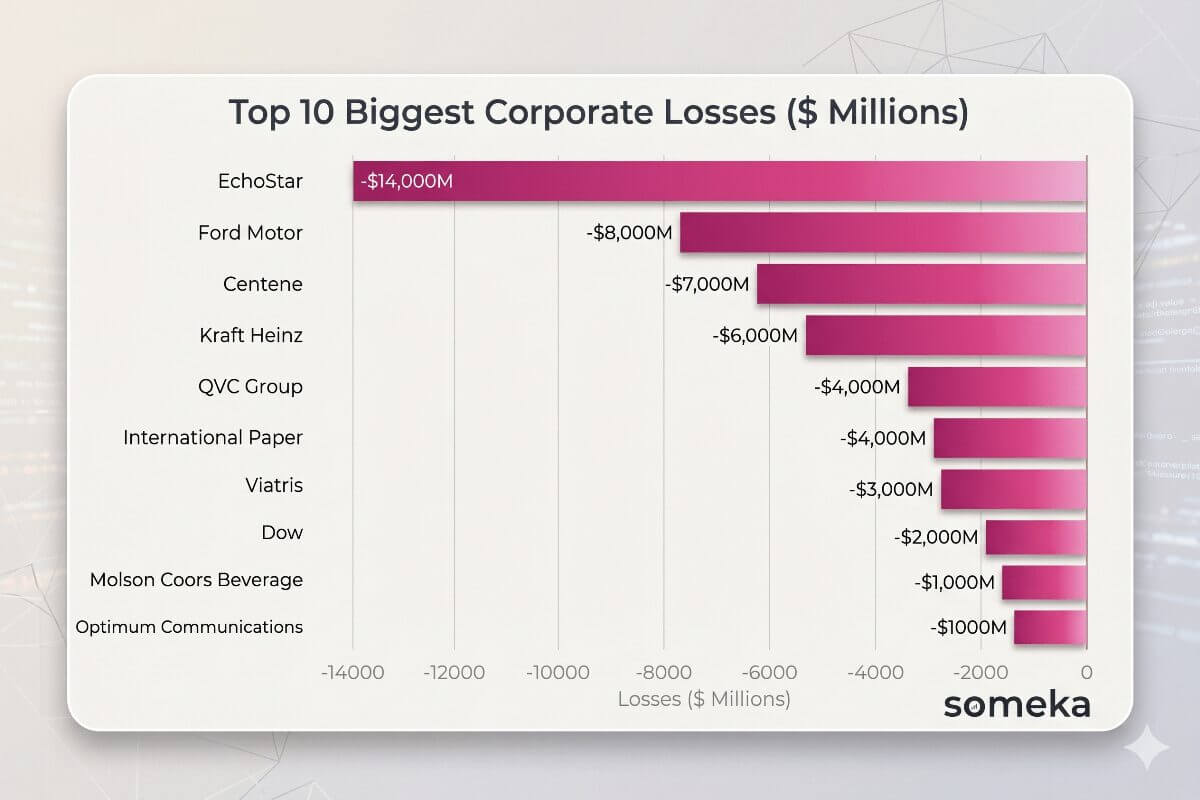
4. You Don’t Have to Make Money to be in the Fortune 500
It is easy to assume that America’s largest companies are all highly lucrative. That is completely false.
- Entering the list only requires massive revenue, not profitability.
- There are 47 companies on the 2026 list currently operating at a loss.
- Some of these losses are catastrophic: EchoStar lost over $14.5 billion, Ford lost $8.2 billion, and Centene lost $6.7 billion.
Key Takeaway: Massive revenue can sometimes be a smokescreen hiding equally massive operational losses. Bigger isn’t always better.
5. Wall Street Pays for Tomorrow, Not Today
Revenue size does not equal company value. The stock market heavily rewards future potential over current sales.
- Companies like Arista Networks (#444), Palo Alto Networks (#437), and Intuitive Surgical (#418) are near the bottom of the revenue list.
- Despite their low revenue rank, they trade at massive valuations in the stock market.
- Market Cap-to-Revenue multiples are wild: Broadcom trades at 22.9x, Nvidia at 19.6x, and Arista at 17.1x.
Key Takeaway: Not all revenue is created equal. The market aggressively rewards high-margin software, AI, and network infrastructure over traditional sales.
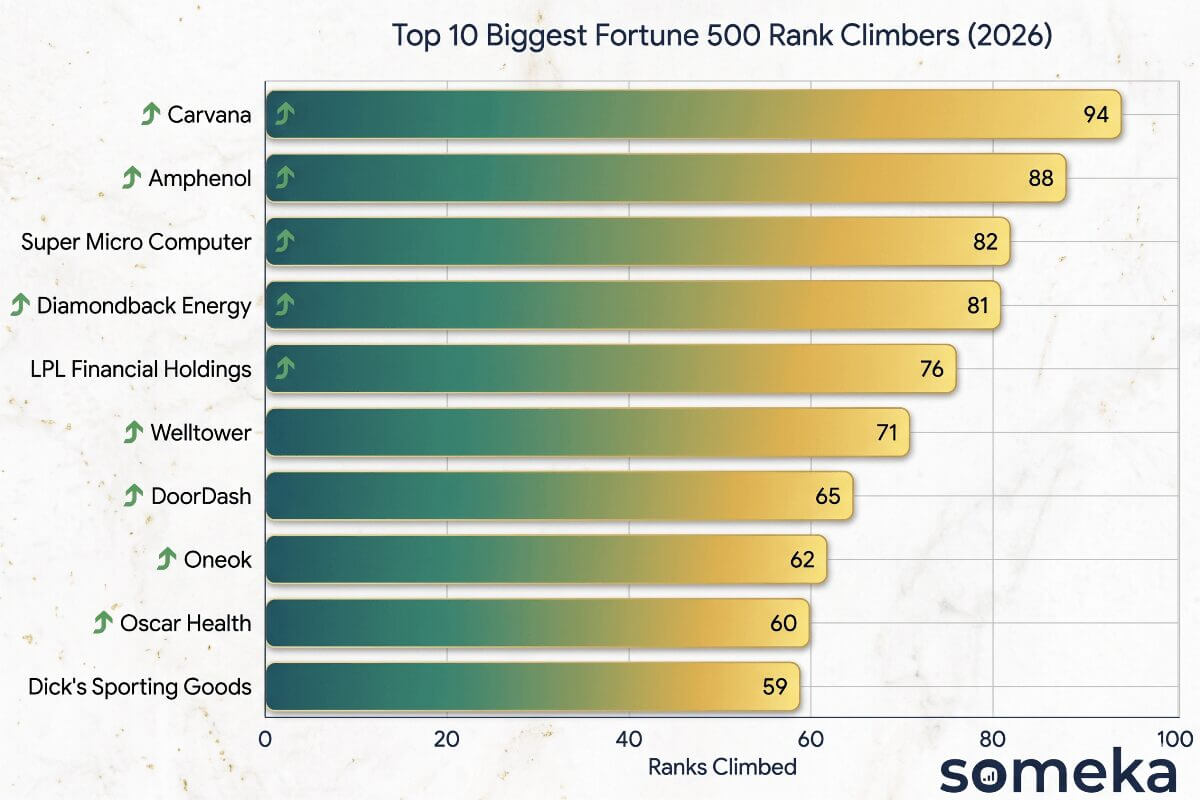
6. The Giant Leaps: It’s Not a Static List
The Fortune 500 is not just a list of old, unmoving giants. There is incredible volatility and growth happening right now.
- Carvana is the standout star, jumping a massive 94 spots up the list.
- Amphenol climbed 89 spots.
- Super Micro Computer jumped 84 spots, heavily riding the AI hardware wave.
Key Takeaway: The Fortune 500 map is redrawn every year. There is always room for explosive growth, even among the largest corporations.
7. Two Completely Different Economies in One List
If you look at the ratio of Total Assets to Total Revenue, you realize the Fortune 500 contains two entirely different business universes.
- On one side, you have asset-light tech and software companies with high margins and minimal physical footprints.
- On the other side, you have the financial and insurance behemoths.
- Companies like Equitable Holdings, Fannie Mae, and Freddie Mac have assets that are 20 to 27 times larger than their annual revenue.
Key Takeaway: The digital economy and the balance-sheet economy co-exist on the same list, requiring completely different rules for success.
Conclusion: Data is More Than Just Ranks
The 2026 Fortune 500 list proves that simply looking at revenue rankings gives you a flawed view of the business world. Whether it’s Nvidia’s margin explosion, Walmart’s country-sized workforce, or the surprising amount of unprofitable giants, the real story is hidden in the underlying data.
Want to dive into the numbers and find your own insights?
You don’t need to be a data scientist. You can download the exact tool we used for this analysis. Check out the Someka Fortune 500 Excel Template to explore the full 2026 list, filter by industry, and create your own custom reports in seconds.
Related Posts