Data Analysis Excel Templates
Professional Data Analysis Excel Templates. Automatic chart and diagram makers. Visualize your data in dynamic dashboards.
Ready-to-use spreadsheet templates. Sleek-design tools with dynamic dashboards. Instant download files in Excel and Google Sheets.
Ready-to-use spreadsheets for Data Analysis
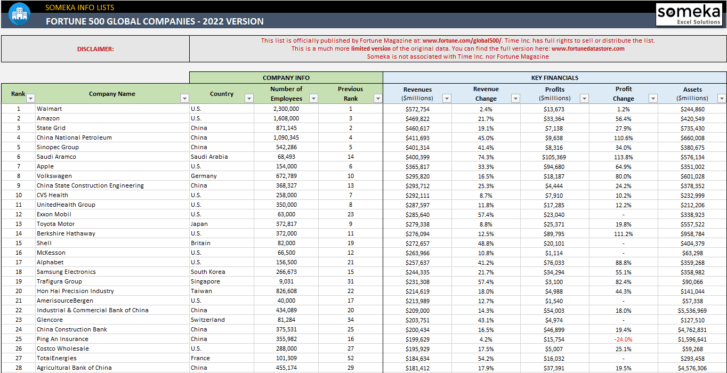
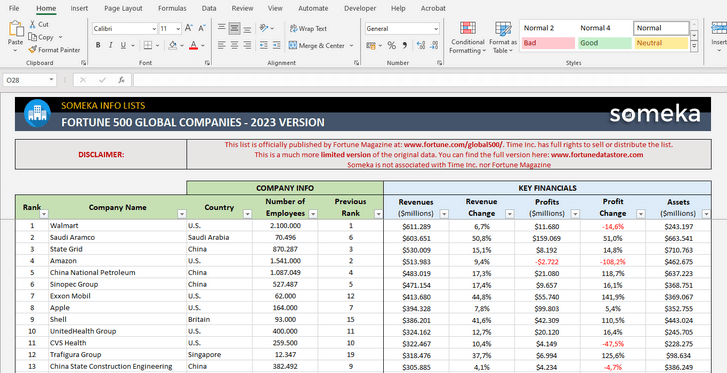
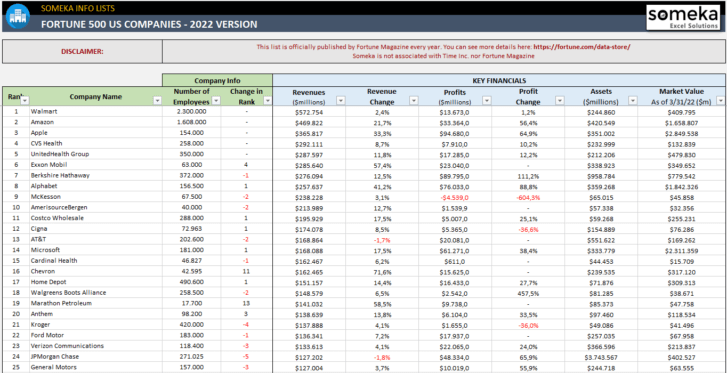
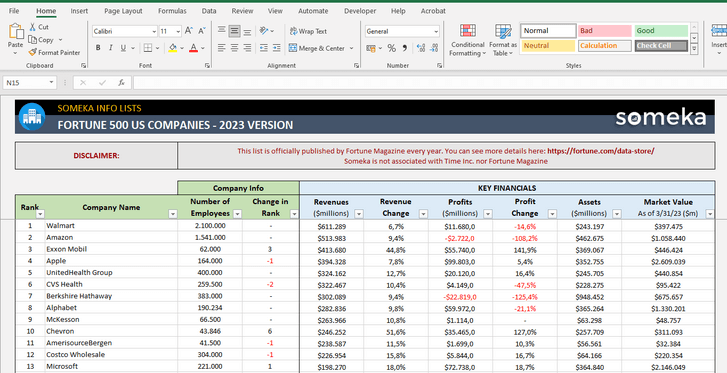
We’re living in an info world, but how to analyze all that big data? Our Data Analysis Excel Templates will help you choose the right data visualization methods to report and present your statistics and data inputs.
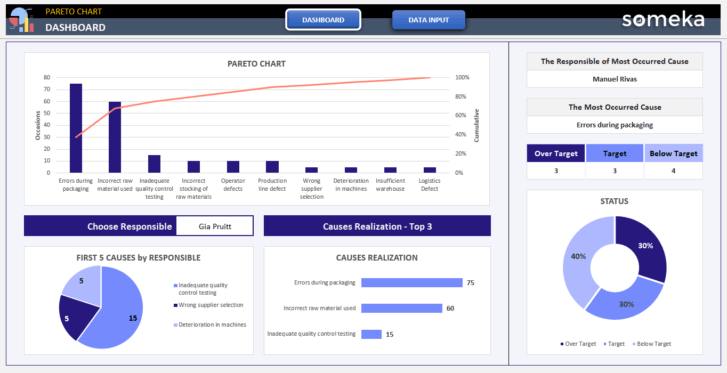
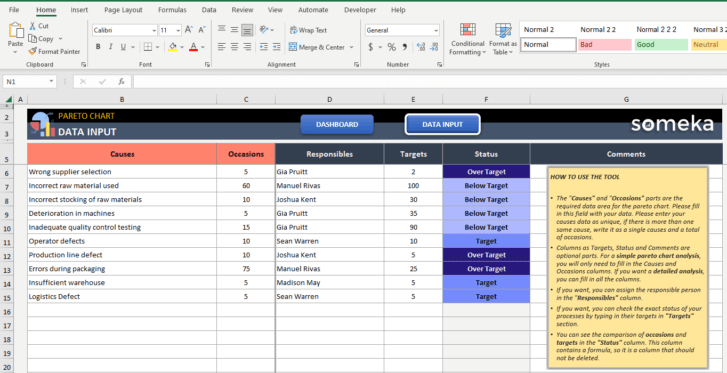
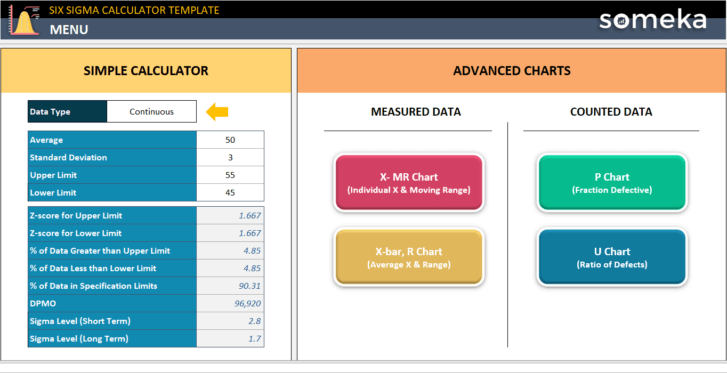
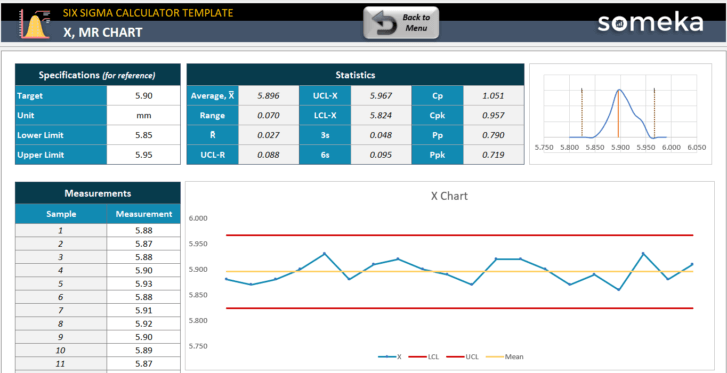
With these data analysis tools in Excel, a single click will be enough to create charts and diagrams with sleek-design dashboards. Input your data and let our templates visualize it for you.
All in Excel. No need to install any extra software.
For who?
This Data Analysis Templates in Excel will help many people to analyze data including but not limited to business owners, start-ups, e-commerce businesses, consultants, data analysts, as well as students, teachers and academy people.
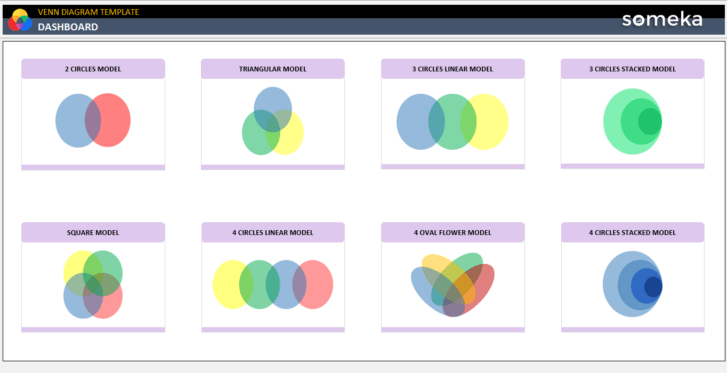
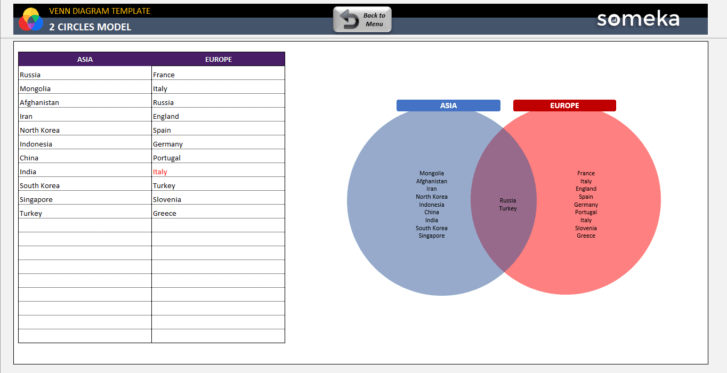
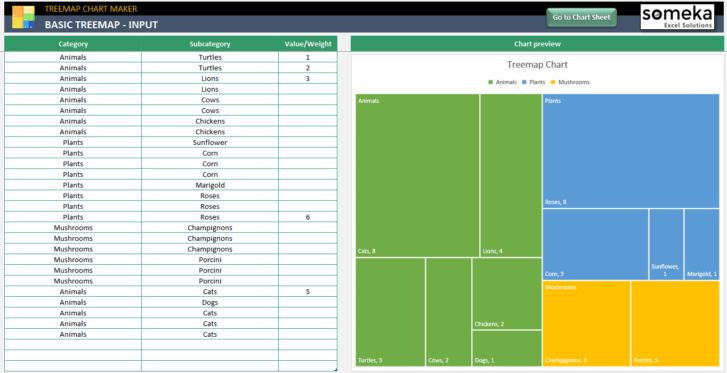
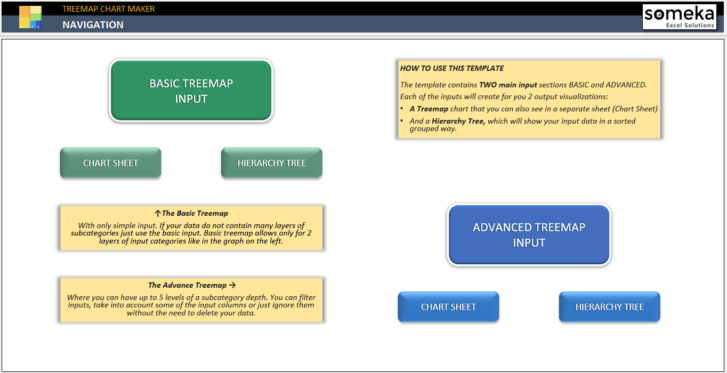
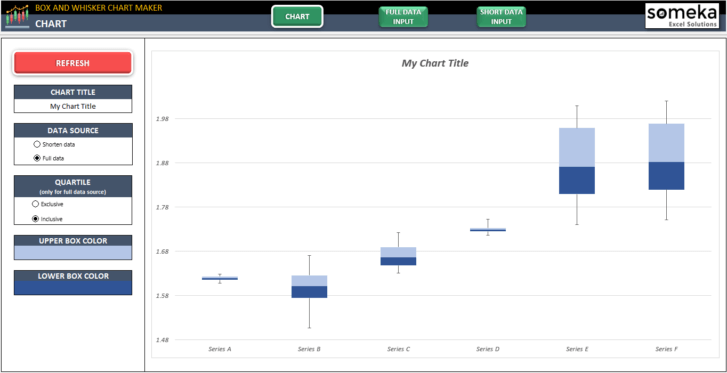
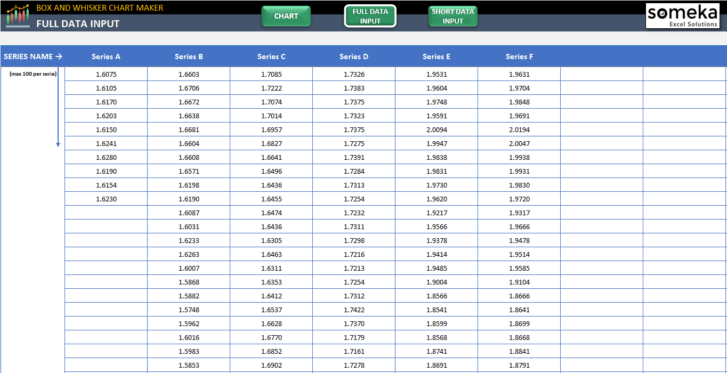
You will easily assess your data in pareto, treemap, box and whisker, histogram charts or Venn diagrams. Many other useful chart makers are available here.
Benefits
- Auto chart makers for big data
- Dynamic dashboards included
- Fully editable and printable
- On-sheet instructions
- Works both on Windows and Mac
- Ready-to-use
