Excel T-Chart Template
T-Chart Maker in Excel. Simple, clean, editable and printable spreadsheet with different format options. No installation needed. Ready-to-use T Chart Graphic Organizer.


GET FULL VERSION
30-Days
Return
Top-notch
Templates
Instant
Download


TEMPLATE DESCRIPTION
Sometimes the basic tools can be the best choice to compare and examine a topic in a proper and clean way. So, this T-Chart Template is a good example of basic and useful diagrams in the business or a daily job. Also, it’s in Excel, so very familiar and easy-to-use. You’ll find all printable and editable formats in this t chart graphic organizer.
In particular, most people prefer using tcharts because of the simplicity of examining multiple categories at the same time in an ordered list.

What is the T Chart?
T-chart is a visualization tool to compare two categories. With these graphic organizers, you can compare pros & cons or cause & effect. Besides, t-charts are also widely used for mathematical calculations. Accounting t-charts are one the best examples for this. You can compare Debit/Credit of the accounts for your general ledgers.
Hence, the main idea is to separate the information, either text or numerical info, into two categories to better analyze or solve an issue.
What are T Charts used for in math?
T chart method can help you to solve mathematical problems or equations easily. You can write independent variables (x) to one side, and the dependent variables (y) to the other side to discover the correlation. As a very simple graphical organizer, t-chart is also very helpful while teaching algebra to kids. So, you can use them as a learning method, too.
So, what are t-charts used for?
– See the differences or similarities
– Examine all causes & effects
– Track all of the accounting items separately
– Analyze by compare & contrast
– List all the possible ways according to the categories
– Evaluate the pros & cons
Main Features of the Excel T-Chart Template:
The T Chart template helps you to examine the topics in at least two different categories according to the title that you specified. Additionally, there are 6 different types of T-Charts provided in this template!
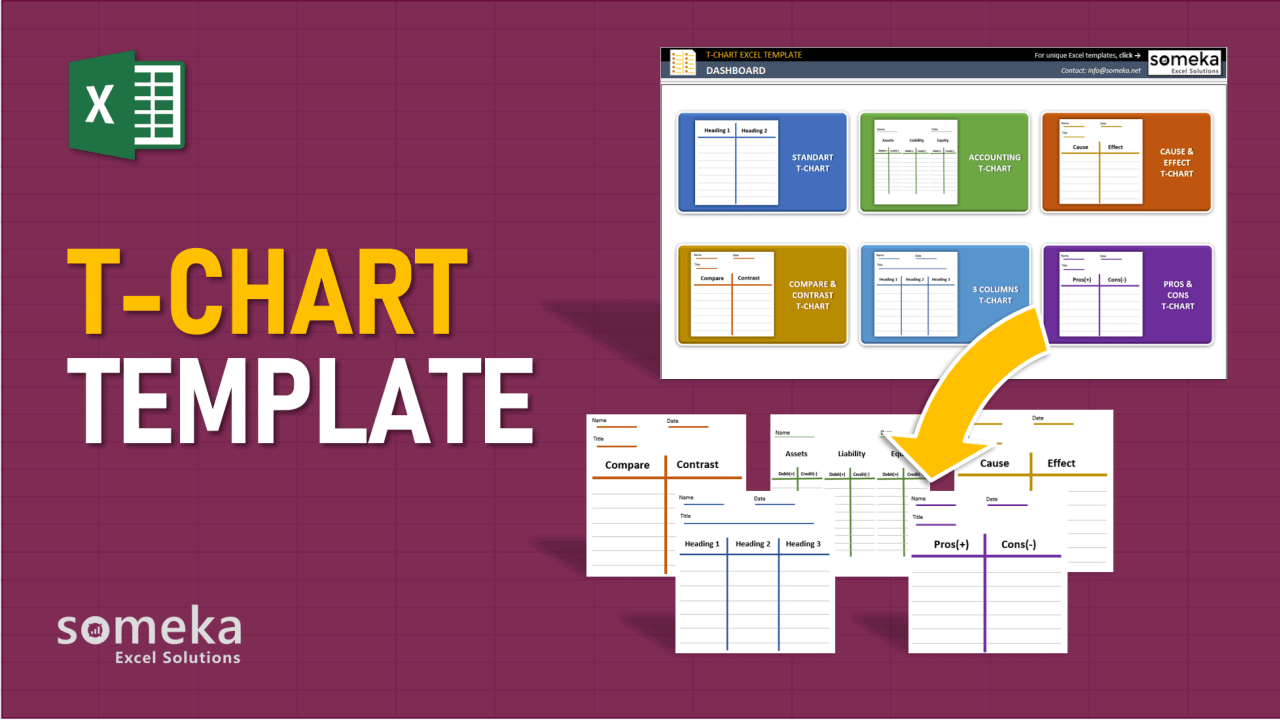
Different Tchart Types
This t-chart maker provides many different types of T-Charts.
What are the T Chart Examples?
- Standard T-Chart
- Accounting T-Chart
- Cause & Effect Chart
- Compare & Contrast T-Chart
- 3 Columns T-Chart
- Pros & Cons T-Chart
Let’s have a look at them one by one:
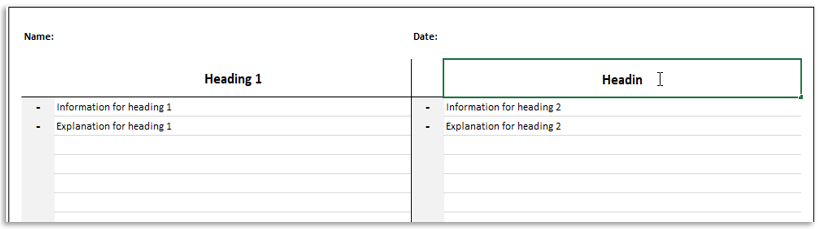
– Standard T-Chart: Firstly, It is the most basic way to create a T Chart. All you need to do is, change the headings and specify new ones by yourself. Moreover, you can easily print it as well after you finished creating your T-Chart. Besides, we have also left a space for entering Name and Date if it is necessary.
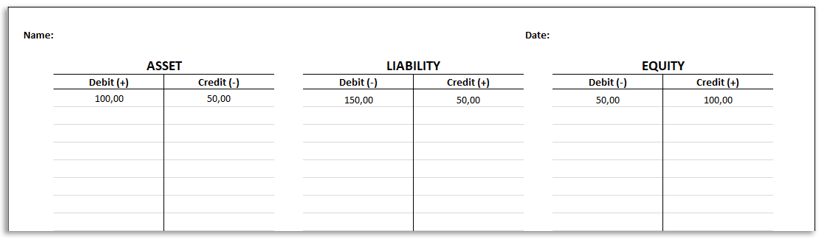
– Accounting T-Chart: This T-Chart helps you to see all of the Assets, liabilities, and equities at the same time. So, using T-Chart in accounting is preferring a lot because it is easy to track and represent visually. T Chart Template will help you to calculate your Debit/Credit balance.
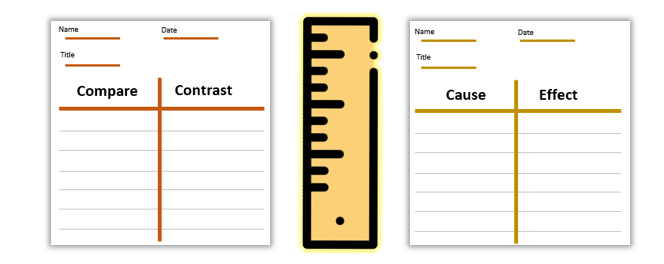
– Cause & Effect and Compare & Contrast T-Chart: These two types of T-Chart diagrams are too similar to each other. The only difference is the examination of the title frame. Although it is that simple, those are the most used and preferred chart types.
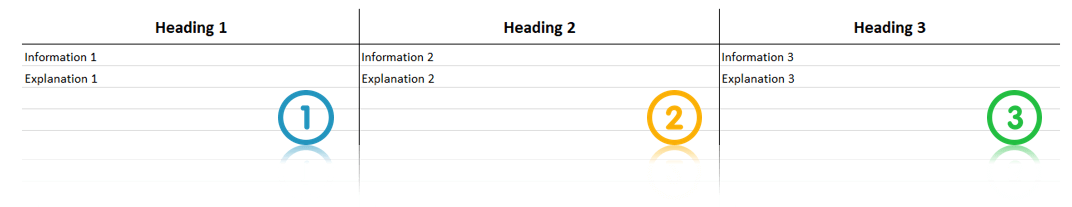
 – 3 Columns T-Chart: In this chart, you can sort all of the information into three different groups. In fact, it provides you to see each group’s positive/negative sides and different features or properties. This type of T-Chart also helps you to see the general scope of the three different categories.
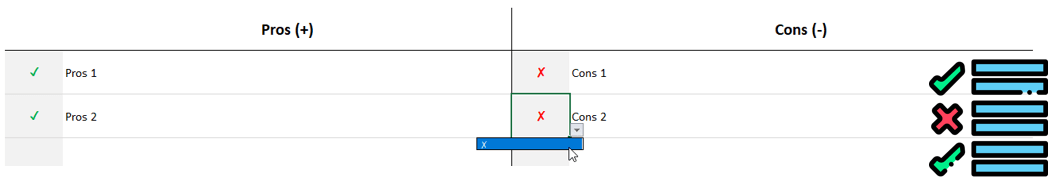
 -Pros & Cons T-Chart: This chart helps you to see one topic’s all positive or negative aspects which are existing or are possible to have. In that way, this tool makes it easier to make a decision or choose by evaluating all points. Additionally, there is a sign to make your T-Chart visually clean and professional on both Pros and Cons side.
T Chart Excel Template Features Summary:
- Examine and enumerate one topic in Excel
- Printable T-charts
- Informational notes included
- No installation needed. Ready to use.
- Works both on Mac and Windows
- Compatible with Excel 2007 and later versions
PRODUCT VIDEO
Watch the video below to see the template in action! Presentation also includes usage notes, explanations and tips & tricks about the template.
FREQUENTLY ASKED QUESTIONS
USER REVIEWS & COMMENTS
5 reviews for Excel T-Chart Template
You must be logged in to post a review.
RELATED TEMPLATES
-

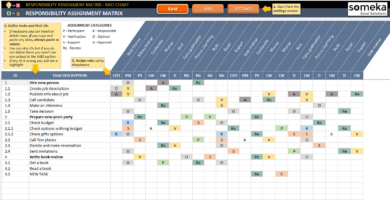
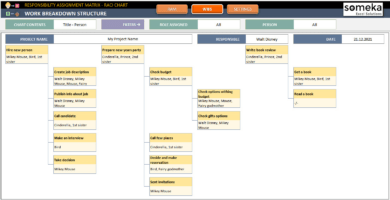
Responsibility Assignment Matrix Excel Template
$0.00 – $69.95Excel project management tool for team roles & tasks. Responsibility Assignment Matrix includes both RACI Chart and Work Breakdown Structure. All printable.
-
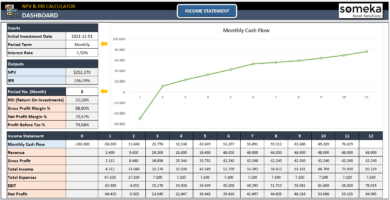
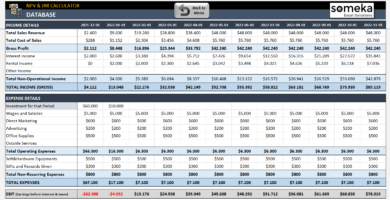
NPV and IRR Calculator Excel Template
$0.00 – $59.95Professional Excel spreadsheet to calculate NPV & IRR. Estimate monthly cashflows & feasibility. Ready for presentations. Dashboard with dynamic charts.
-
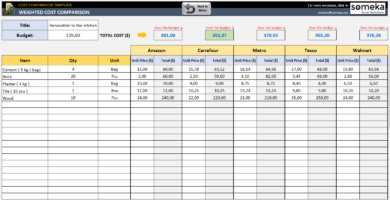
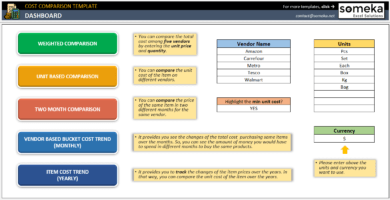
Cost Comparison Excel Template
$0.00 – $59.95Cost comparison spreadsheet in Excel. Compare prices from multiple vendors. Weighted cost analysis and printable dashboard with charts. Ready to use.
-
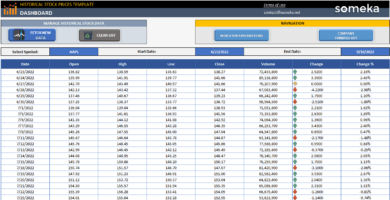
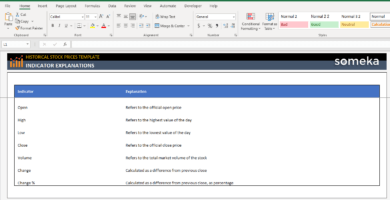
Historical Stock Prices Excel Template
$0.00 – $69.95Excel spreadsheet to fetch historical stock prices. One-click access to data from NASDAQ and NYSE. No installation needed. Ready to use.
-
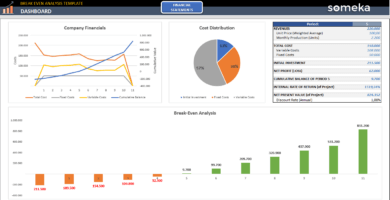
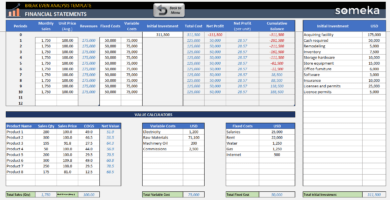
Break Even Analysis Excel Template
$0.00 – $59.95Break Even Analysis Template. Calculate profitability point. Automated charts and dashboard. Instant download file in Excel. Works on Mac & Windows.
-
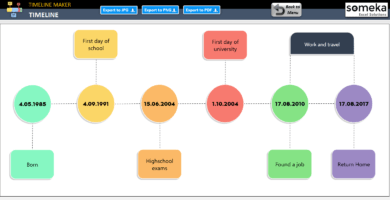
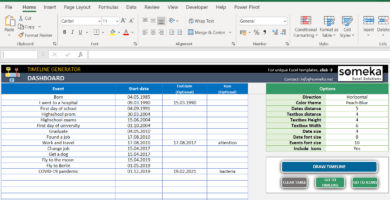
Excel Timeline Maker
$0.00 – $69.95Create a timeline in Excel automatically! This interactive spreadsheet template allows you to make functional timeline charts. Works in Mac & Windows.
Mert Şakar –
Great!
Sixta –
I am impressed with the template because it saves a lot of my time
Gaby N –
Nice product I like it but I have to make some changes and it won’t let me because it is password protected can you tell me how to unlock it
Someka –
Hello Gaby,
Thank you for your comment.
Our templates are password protected to prevent undesired changes that could make them stop working properly.
However, we include the password to unlock it in a text file along with your template.
Follow the instructions in this link to unlock it.
Stefan –
I strongly reccommend this template
Linda –
awesome