HR KPI Dashboard Excel Template
Excel spreadsheet for HR metrics. Most common staff KPIs. Printable dashboard with trend charts. No installation needed. Ready to use.


30-Days
Return
One-Time
Payment
Instant
Download
Redeem 3 Templates
Download 3 premium templates of your choice for free each month.
Continuous Technical Support
We’ll be your one-stop assistant for all your Excel & Google Sheets questions and needs.
Multi-User Environment
You’ll be entitled to multi-user licensing for your templates.
Cancel Anytime | Growing Catalogue | Continuous Updates


This template is also included in bundle with special discount! See details >>
TEMPLATE DESCRIPTION
This HR KPI Dashboard Excel Template offers the perfect tool to identify where performance is met and where needs improvements. Therefore, you can analyse your metrics at a glance and in-depth inside this spreadsheet. You can enter recorded workplace operations and the organization’s objectives into the Dashboard, for instance.
In that way, you will be able to measure the set goals for employee performance metrics and results from your team’s activity, which will also lead you to a healthy OKR (Objectives and Key Results) tracking.
The accurate presentation of key performance indicators via the Human Resources Dashboard is important to your company’s success. Because finding and entering the correct data is essential to getting a clear picture of the efficiency of your department as a human resources professional.

How Can You Create The Best HR KPI Dashboard?
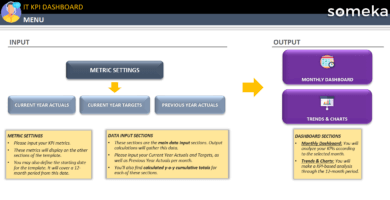
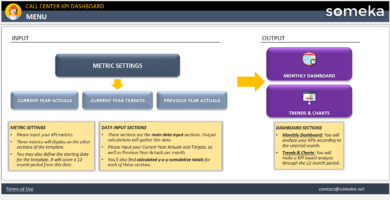
Firstly, there are two sections in this template: Inputs and Outputs. Current Year Actulas, Current Year Targets, and Previous Year Actuals make up the input section. Then, the output is made up of two things: a monthly dashboard and charts and trends.
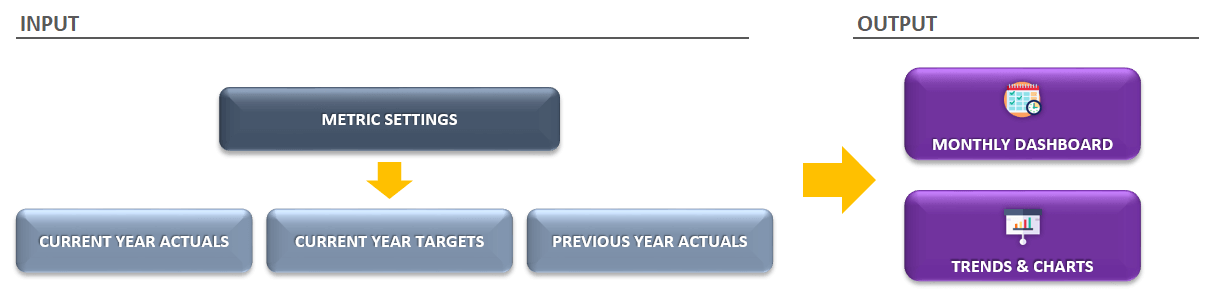
You could build templates to form your own dashboard design. Alternatively, you can purchase a purpose-built Excel-based program that is primed and ready to use. Our HR Key Performance Indicator Dashboard is all you need. The Template comes with:
- The Main Key Human Resources Metrics Used Worldwide
- Charts Showing Trends Within Your Department
- Differences Associated with Past and Present Objectives
- 30 Day Records and Cumulative Analysis
You can also use this Excel Template for executive meetings to provide a snapshot of the current and comparative performance. This would help you define the areas of development and work on them to have a better performing business. Furthermore, you may easily include the dashboard and the charts in your internal and external presentations and create new sheets within the Excel file to include extra information such as notes.
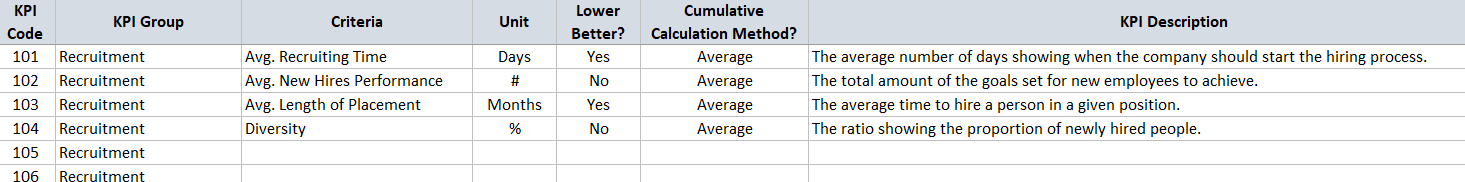
KPI Metrics
A few columns in this sheet are pre-answered, which are samples of data. Moreover, if you need more rows, just insert them. It is also possible to change/remove existing KPIs or add new ones. It is also advisable to clean the existing data on the input sheets before inserting any rows to prevent overwriting.
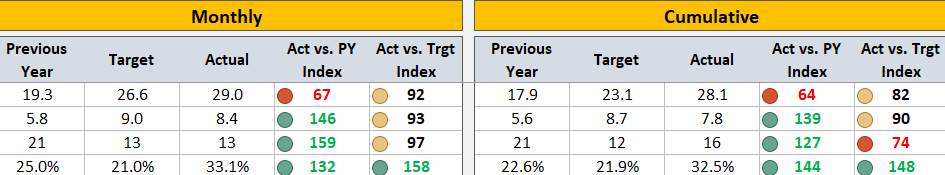
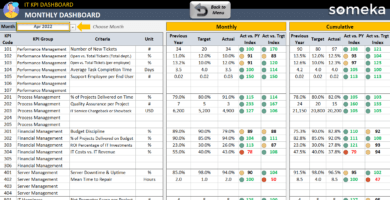
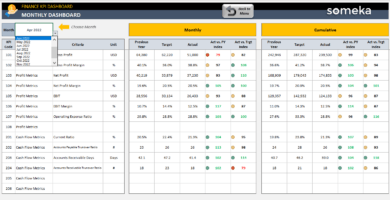
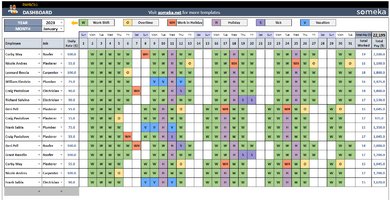
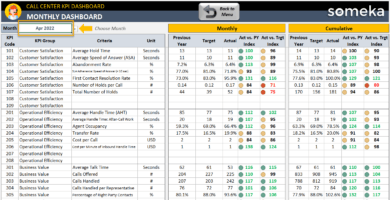
Monthly Analysis of HR KPI Dashboard Excel Template
As part of the HR KPI Excel Template, you can track the performance of each KPI criteria Monthly and Cumulatively. When you select a Month from the dropdown menu above.

the template will compare the Current year’s data to the Previous year’s data and your goals; and then it will color code the results green, yellow, and red.
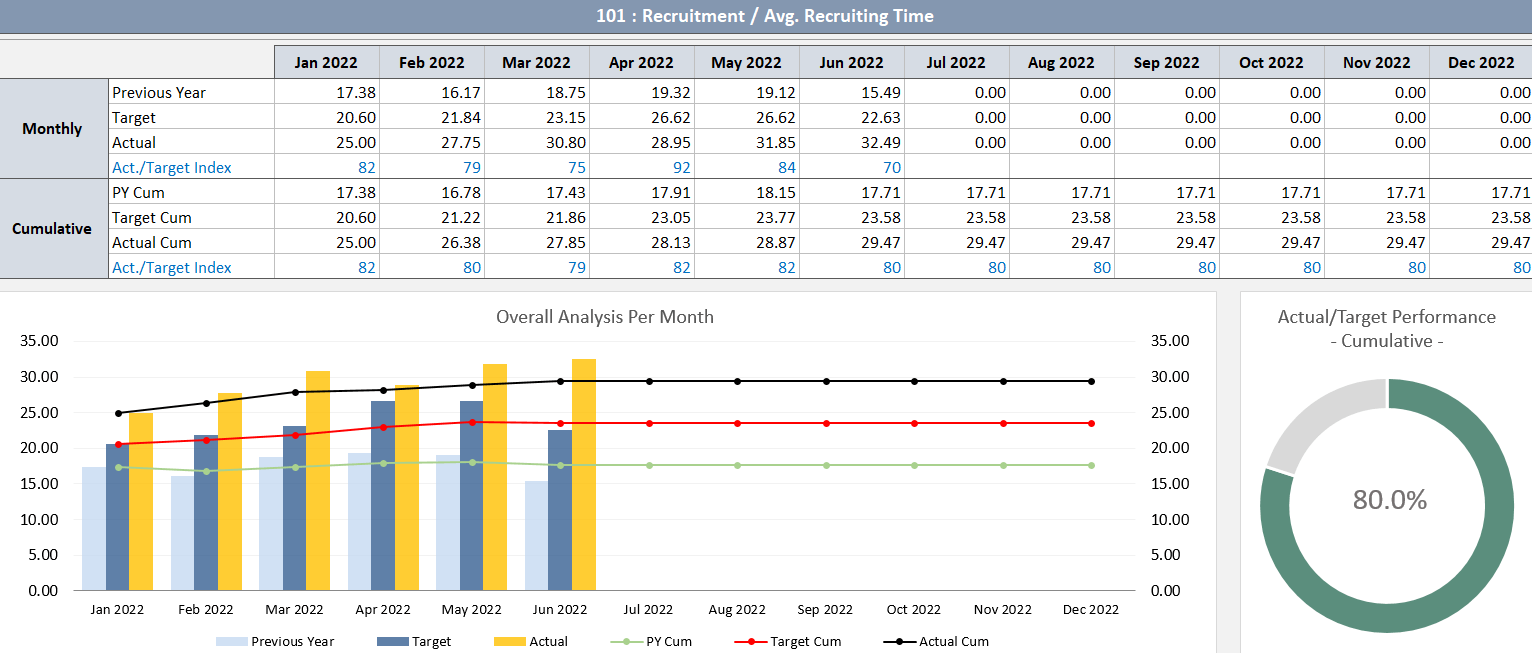
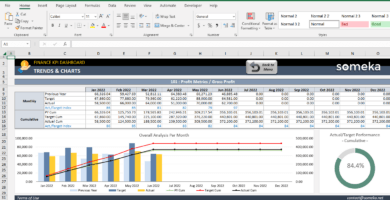
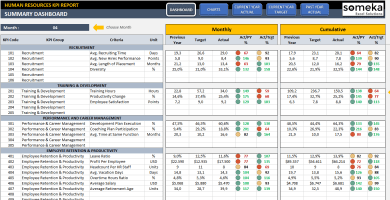
Trends and Charts of HR KPI Dashboard Excel Template
As a result of this section, you can monitor monthly and cumulative performance per KPI metric. The template will compare your monthly data with your overall analysis. Additionally, you can view cumulative performance against your targets using the doughnut chart.
Not Sure Which Employee Key Performance Indicators To Use In Your HR Department?
As part of the development of the HR Dashboard we collated the most frequently used Human Resources metrics and categorized them under the following five headings:
- Recruitment: Average Lead Time to Recruit New Employees | Performance Score of New Employees within 6M | Average length of placement in months for the manager | Diversity (Female to Male Ratio)
- Training & Development: Training Hours per Employee / Year | % Change of Productivity Before/After the Training | Employee satisfaction points with training
- Performance & Career Management: % of employees that fully execute their Individual Development Plan | % of employees that participate in Career coaching plan | Average time employees are in the same function
- Employee Retention & Productivity: % of employees who leave the company in a given time period | Profit per Employee | Average headcount of employees each human resources (HR) employee caring for | Average number of vacation days per employee | Total overtime hours as a percentage of all work hours | Average salary | Average retirement age | Total overtime hours as a percentage of all work hours
- Budget Metrics: Actual vs Budgeted Hire | Percentage of HR budget spent on training | Average training costs per employee
The Dashboard also allows you to create and add your own HR metrics if desired. Once completed, you can monitor the information alongside the standard employee KPIs. It will help you analyze the results of the data. You can view the Monthly and cumulative figures separately as well as the comparison of past and proposed company goals and targets.
As a result, the Human Resources Key Performance Indicators Dashboard offers you a easy-to-use Dashboard with valuable data. Waste no more time with multiple spreadsheets which confuse more than they inform, and get working with our purpose-built all-in-one model.
HR KPI Dashboard Excel Template Features Summary:
- Monthly and Cumulative analysis of HR Metrics
- Comparison with Past Year and Target values
- Summary dashboard supported with interactive charts
- Both Staff KPI Report and HR Analytics in Excel
- Straightforward Instructions Available On-sheet
- Compatible with Excel 2010 and later versions
- Works both on Windows and Mac
- No installation needed, ready-to-use
- Full print ready
- White Label
- Does not include any VBA macros
EXCEL KPI DASHBOARDS COLLECTION
PRODUCT VIDEO
Watch the video below to see the template in action! Presentation also includes usage notes, explanations and tips & tricks about the template.

FREQUENTLY ASKED QUESTIONS
USER REVIEWS & COMMENTS
11 reviews for HR KPI Dashboard Excel Template
You must be logged in to post a review.
RELATED TEMPLATES
-

IT KPI Dashboard Excel Template
$0.00 – $79.95Excel spreadsheet for IT departments. Track your key metrics in information technology with target-based and yearly comparisons. Printable trend charts.
-
Finance KPI Dashboard Excel Template
$0.00 – $79.95Excel spreadsheet for finance KPIs. Most common metrics for finance & accounting departments. Printable dashboard with trend charts. Ready for use.
-
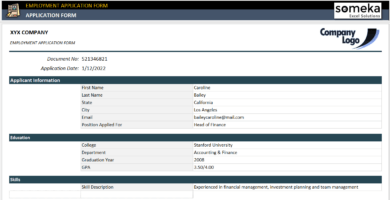
Job Application Form Template in Excel
$0.00 – $59.95Job Application Forms in Excel. Create dynamic candidate forms and keep record of applications. Simple yet useful tool for HR hiring. Fully printable.
-
Employee Attendance Tracker & Payroll Google Sheets Template
$0.00 – $59.95Payroll Calculator and Attendance Tracker in Google Sheets. Dynamic monthly dashboard. Online access from any devices. No installation needed. Printable attendance forms.
-
Human Resources Excel Templates Bundle
$199.95 – $399.95Bundle pack for HR templates in Excel. Top selling human resources tools. All uniquely designed, printable, professional spreadsheets. Ready for use.
-
Call Center KPI Dashboard Excel Template
$0.00 – $79.95Excel KPI spreadsheet for call centers. Track your key metrics with yearly and target-based comparisons. Printable dashboard with trend charts.


Divya –
The budget metrics section is particularly useful. TNX
Kacper D. –
I acquired the template, yet I’m uncertain of how to open the ZIP file. Could you provide me with instructions on how to accomplish this?
Someka –
Greetings! There’s no need to worry, we can guide you on how to unzip the file.
For Windows users, right-click on the file and choose “Extract All…”. It will then ask you where you would like to save the unzipped file. That’s all there is to it!
As for Mac users, all you have to do is double-click the file and it will be unzipped in the same directory.
Ashkan Ilkhani –
The monthly analysis feature is particularly useful, and the charts and bars make it easy to visualize the data. Great job!
Claire Mohan –
I have been using this HR KPI Dashboard Excel Template for a while now, and it has really helped me track the performance of my team.
Benjamin P. –
The template’s prea-answered columns and charts make it easy to understand and use. Highly recommanded!
Jeb B –
It is very useful for our work.
if we have other options for the chart there is only the bar chart?
Someka –
Hello Jeb,
Thanks for your interest in our KPI Dashboard Templates!
Regarding the question you asked, as default, we do not add a feature to change chart type but you can do that using the Excel function easily.
Just select the chart -> Go to Design Tab-> Click Change Chart Type. You will see all available charts for the data we’ve visualized and change the chart design as you see fit!
Hope this helps! Otherwise please do not hesitate to contact us with any of your questions.
Inti –
contents fully meet our needs, thank you very much
samuel –
I’ve been using these guys KPIs for many many years and I can’t recommend it enough. Great metrics, useful information, incredible customer support.
Jhon G. –
A lot of flexibility. I’ve purchased a few other KPI templates. They look brilliant. Liked it!
Christy Alex –
Template is one of the best i have purchased. Support is amazing too. Great job guys
M. Hilley –
Easy but not week based. I would love to have an option to choose from months-weeks-quarters.
Someka –
Thank you for your comment! Our KPI Dashboard templates work based on months by default. But you can edit them.
Or if you want a customized version, please refer to:
Custom Services