Skip to content

Articles About Data Analysis and Statistics with Excel

Nowadays, 90% of job postings about Data Analysis require excellent spreadsheet skills. So this generally results that the primary tool of many data analyst is Microsoft Excel. In fact, it’s truly amazing how much science you can do with it!

Explore this category to learn a lot of tips, real-life examples, mathematical solutions, data visualization methods, dashboards and graphs in Excel!

Venn-diagram-google-docs-SS1

How to Make a Venn Diagram on Google Docs? Step-by-Step Guide

How to make a Venn Diagram on Google Docs? Step-by-step guide to draw circles with intersections.Includes examples and instructions

Career-guide-data-analyst

Career Guide: Data Analyst

Have you ever wondered where to start for being a successful data analyst? Here is an article that shows everything about data analysis.

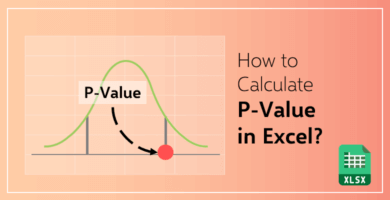
How-to-calculate-p-value-in-excel-cover

How to Calculate P Value in Excel?

P-Value might be hard concept to understand. This blog post aims to teach how to calculate P-Value in Excel with examples!

How-to-calculate-confidence-interval-in-excel

How to Calculate Confidence Interval in Excel?

This article describes the formula and explains how to calculate the confidence interval in Microsoft Excel with real-life examples.


Go back to FAQ Center

Search